Impact of Clustering in Indoor MIMO Propagation
Using a Hybrid Channel Model
Zhongwei Tang
Microwave and Wireless Technology Research Laboratory, Information and Communication Group, Faculty of Engineering, University of Technology, Sydney, L24/B1, P.O. Box 123, Broadway NSW 2007, Australia
Email:[email protected]
Ananda Sanagavarapu Mohan
Microwave and Wireless Technology Research Laboratory, Information and Communication Group, Faculty of Engineering, University of Technology, Sydney, L24/B1, P.O. Box 123, Broadway NSW 2007, Australia
Email:[email protected]
Received 1 March 2004; Revised 7 October 2004
The clustering of propagating signals in indoor environments can influence the performance of multiple-input multiple-output (MIMO) systems that employ multiple-element antennas at the transmitter and receiver. In order to clarify the effect of clustering propagation on the performance of indoor MIMO systems, we propose a simple and efficient indoor MIMO channel model. The proposed model, which is validated with on-site measurements, combines the statistical characteristics of signal clusters with deterministic ray tracing approach. Using the proposed model, the effect of signal clusters and the presence of the line-of-sight component in indoor Ricean channels are studied. Simulation results on channel efficiency and the angular sensitivity for different antenna array topologies inside a specified indoor scenario are also provided. Our investigations confirm that the clustering of signals significantly affects the spatial correlation, and hence, the achievable indoor MIMO capacity.
Keywords and phrases:angle sensitivity, channel efficiency, indoor propagation, signal clusters, MIMO, RiceanKfactor, ray tracing.
1. INTRODUCTION
The multiple-input multiple-output (MIMO) technique is being tipped as one of the most significant breakthroughs in wireless communications for achieving high data-rates with-out increasing the channel bandwidth [1,2,3,4]. In view of its significance, the MIMO technique is considered for in-clusion into the forthcoming IEEE 802.11n WLAN standard. MIMO systems have the ability to turn multipath propaga-tion into a benefit for users by employing multiple antennas at both the transmitter and receiver to exploit multipath fad-ing, in order to maximize data throughput. The underlying mathematical nature of MIMO, where the data is transmitted over a matrix rather than a vector channel, creates new and enormous opportunities beyond just diversity or array gain benefits. This has prompted new research on channel mod-elling, antenna design, coding schemes and signal processing, and so forth.
In MIMO systems, the channel transfer matrix is a key component that includes the coupling information between the transmitter and the receiver and their interaction with the surrounding physical environment, through the spatial and angular features of RF propagation. It has been reported that
the correlation of the channel transfer matrix due to direc-tional multipath propagation tends to decrease MIMO
per-formance [5,6,7] for both indoor and outdoor MIMO
sys-tems, when time diversity is not considered [8]. Thus, the
characteristics of the transmit and receive arrays, such as an-tenna polarization [9], antenna element separation [10], and array topology and orientations [11] can play a major role in determining the achievable MIMO capacity. It has also been reported [12,13] that the presence of the line-of-sight (LOS) component in Ricean channels also reduces the achievable MIMO capacity.
As the antenna characteristics and channel correlations affect the achievable spectrum efficiency, antenna selection assumes importance for obtaining the optimized capacity
[14, 15]. On the other hand, in indoor propagation
envi-ronments, it has been well-established that multipath waves tend to be clustered in both angular and temporal do-mains [16,17,18,19]. Moreover, the clustering propagation is found to be detrimental to indoor MIMO performance as it increases the spatial correlation between subchannels
[20, 21]. When antenna arrays are employed at both the
clusters, whose characteristics are determined by the physi-cal features of a given indoor environment as well as the lo-cations of the transmitter and receiver. Since antennas are key components in MIMO systems, it is important to un-derstand the impact of antenna array topology and orien-tation on achievable capacity in clustering indoor environ-ments. Many realistic indoor environments are Ricean sce-narios since it is common for a strong line-of-sight compo-nent between the transmitter and receiver to exist. Thus an
investigation on the effect of RiceanK factor on the
achiev-able MIMO capacity assumes practical importance. Further,
the subchannel efficiency in indoor environments is not fully
addressed. Therefore, a comprehensive investigation on the impact of signal clustering on indoor MIMO performance is expedient for the efficient design and deployment of high-performance wireless systems. To this end, it is essential to exploit the MIMO channel transfer matrix by including the spatial and angular behaviour of multipath clusters.
In the pioneering work of Foschini and Gans [3] and
Telatar [4], the MIMO channels were modelled to be
un-correlated with the entries of the channel matrix being inde-pendent and identically distributed (i.i.d.) complex Gaussian variables with zero-mean and unit variance. However, such i.i.d. models do not represent the behaviour of real indoor correlated channels. Attempts have been made to use direct measurements to form the indoor channel transfer matrix [6,22]. However, such models may have limited applicability to specific array configurations or propagation environments under test. Wallace and Jensen [23] and others [16,17] have employed measurement-based statistical models to generate the channel parameters by fitting the models to measured data. These statistical models can be quite useful in generaliz-ing the spatial behaviour for typical indoor channels; but re-quire extensive measurements. On the other hand, determin-istic ray tracing has been applied to investigate indoor MIMO
performance for simple indoor environments [13,24].
How-ever, the use of rigorous 3D ray tracing alone to accurately model realistic indoor MIMO environments can be compu-tationally intensive. Thus simple yet tractable MIMO chan-nel models that can incorporate clustering propagation by exploiting the statistical features of RF propagation are desir-able.
In this paper, we propose a hybrid indoor MIMO channel
model to include the effect of clustering propagation on the
MIMO channel matrix. The hybrid indoor MIMO channel model uses deterministic ray tracing approach to detect the effective signal clusters in a given environment, which will be combined with the stochastic features of the clusters to con-struct the MIMO channel matrix. The model then is used for predicting indoor MIMO characteristics such as the mutual information as a function of antenna topology, spatial
corre-lation, and the RiceanKfactor for specified indoor
environ-ments. The results predicted using the hybrid cluster channel model are also validated by comparing with on-site measure-ments in terms of MIMO capacity. It is expected that the sim-ulation results on the channel parameters presented in this paper may provide detailed insights on the impact of cluster-ing propagation for the design of indoor MIMO systems.
The paper is organized as follows:Section 2reviews the
indoor clustering propagation, the statistical properties of signal clusters, as well as the ray tracing modelling approach; Section 3introduces the signal model and the channel
capac-ity of MIMO systems; inSection 4an indoor MIMO hybrid
channel model is proposed which combines the stochastic properties of signal clusters with the deterministic ray
trac-ing approach; andSection 5presents the results on the effect
of clustering propagation on indoor MIMO performance ob-tained using the hybrid channel model. The conclusions are
drawn inSection 6.
2. INDOOR CLUSTERING PROPAGATION AND RAY TRACING MODELLING
The propagation of RF waves in indoor environments is com-plex and has been studied extensively for applications of conventional indoor single-input single-output (SISO)
wire-less communications [25,26]. The clustering of multipath
waves in indoor propagation was first observed by Saleh and
Valenzuela [16] during their RF indoor channel
measure-ment campaign. For a specified transmitter and receiver pair in a given indoor environment, the receive antenna receives a finite number of multipath clusters which arrive from cer-tain directions. The individual signal cluster may consist of a large number of signal components caused by the scattering from local scatterers in the vicinity of both the transmitter and receiver. Spencer et al. [17] proposed a statistical indoor SISO channel model by including the angular characteristics of signal clusters using measured data. In this model, the an-gles of arrival (AOA) of signal clusters were assigned to be uniformly distributed in the range of [0, 2π); and the Lapla-cian probability density function (PDF) with varying angle spreads was utilized to fit the AOAs of the multipath compo-nents (MPCs) within individual clusters. A clustering SISO model based on geometric ray bouncing in elliptical
subre-gions was proposed in [27], in which the scatterers were
as-sumed to be uniformly distributed within the scatter region, and the Gaussian distribution was used to characterize the angular property of signal rays within each cluster. A
statis-tical wideband cluster model is proposed in [19] which
con-firms the suitability of using Laplacian PDF for representing signal clusters.
a group of signal rays, using the geometry. The angular in-formation of effective signal clusters can be determined by the relative positions and orientations of the transmitter and receiver as well as the physical features of an indoor environ-ment. Comparisons between existing ray tracing predictions and measurements on the angular information of signal clus-ters, as reported in [29,31], show consistent agreement be-tween both approaches. These support the use of ray tracing in the prediction of angular information of propagating clus-ters in specified indoor environments.
3. MIMO SYSTEM MODEL
We consider a point-to-point narrowband indoor
commu-nication link withPtransmit andMreceive antennas. A flat
fading channel is assumed here. This is valid if the coher-ence bandwidth of the channel is larger than the transmis-sion bandwidth. The complex baseband input-output signal relationship of the narrowband MIMO system is represented as
r =Hs+n, (1)
wherer is the received signal vector,s is the transmit sig-nal vector, and the entryhi jof the channel transfer matrix,
H = [hi j]M×P, is the complex transfer function between
the jth transmit antenna and the ith receive antenna, for
i = 1, 2,. . .,M and j = 1, 2,. . .,P. The signal is assumed
to be corrupted by white Gaussian noisen, which is a
vec-tor composed of independent complex Gaussian-distributed
elements with a zero-mean and varianceσ2.
The consideration of quasistationary flat fading channels
allowsHto be constant during one or more communication
bursts, as is usually the case in indoor wireless communi-cation implementations, where both the transmitter and re-ceiver are of limited mobility. The Shannon channel capacity of an MIMO link is calculated as [3,4]
CEqualpower=log2
det
I+ρSNR
P HH
∗, (2)
where det (·) denotes the determinant,ρSNRis the desired av-erage received signal-to-noise ratio,Iis an identity matrix,P
is the number of transmit antennas, H∗ denotes the
com-plex conjugate transpose of the normalized channel matrix
H, andC, in bits/s/Hz, is the mutual information. In this
case, the channel state information is assumed to be avail-able at the receiver side only, and the transmitted power is equally allocated to each transmit element.
Using singular value decomposition (SVD), the channel matrix can be decomposed as
H=UΛV∗=Udia
λ1,
λ2,. . .,
λm, 0,. . ., 0
V∗, (3)
where U and V are unitary matrices whose elements are
the corresponding singular vectors of the diagonal matrixΛ.
The elements ofΛare the square roots of the eigenvalues,λi,
i ∈ [1,. . .,m],m ≤ min(M,P), of the channel covariance
matrix,RH, andRH =HH∗forM≤PorH∗HforP < M.
The capacity for the equal power allocation scheme in (2) can be rewritten as [32]
CEqualpower= m
i=1
log21 +ρSNRλi
P
. (4)
Effectively, the MIMO channel is decomposed intom
paral-lel spatial SISO subchannels, each one of which has a corre-sponding channel gainλi.
When the channel state information is available at both the transmitter and receiver, the capacity can then be opti-mized by applying the waterfilling solution with a transmit power constraint. The result in capacity is given as
CWaterfilling= m
i=1
log2det1 +Piλi
σ2
, (5)
wherePT =
Piis the total transmit power,Pi=(u−1/λi)+ is the transmitted power in theith subchannel, (·)+indicates taking only those terms which are positive, andµis called the water level.
4. A HYBRID INDOOR MIMO CHANNEL MODEL The aim in modelling the MIMO channel is to obtain the
channel transfer matrix H that characterizes the fading of
correlated multipath which couples the transmitter and the receiver. In this section, we present a hybrid indoor MIMO channel model, where a 2D ray tracing method is used to obtain the angular features of signal clusters for realistic in-door environments, that will be combined with the statistical properties of signal clusters to construct the MIMO chan-nel matrix. The MIMO chanchan-nel matrix is formed using the Kronecker method, which is based on the covariance matri-ces at the transmitter and receiver, so as to ensure that the channel matrices inherit the spatial fading correlation of a given channel. In order to obtain the correlation coefficients at both the sides, the angular information, namely, angles of departure (AOD) and angles of arrival of signal clusters, is necessary and is calculated in this paper by using an image-based deterministic ray tracing approach. Our aim is to
un-derstand the fading caused by the spatial effect rather than
the effect of temporal dispersion. Therefore, throughout our work, narrowband flat fading channels are assumed.
4.1. The spatial correlation between antennas in clustering channels
Rayleigh channels is well known [33], where multipath is
as-sumed to arrive uniformly within 360◦around the antennas.
We denote this scenario as the unclustered case. The correla-tion for this classic case is given by [33]
ρ(d)=J0
k0d
, (6)
whereJ0is the Bessel function of the zeroth order,k0=2π/λ
is the wave number, anddis the separation between two
an-tennas. However, it is well-established that uniform distribu-tion does not properly represent the angular characteristics of multipath in indoor propagation channels where
propa-gating waves tend to be clustered [16,17, 19]. The
physi-cal features of indoor environments cause the rays to scat-ter nonisotropically. Since a clusscat-ter is an accumulation of in-dividual rays with similar angular characteristics, it is pos-sible for rays to form clusters nonuniformly in the angu-lar domain. In this paper, we make use of the determinis-tic ray tracing only to find the number of dominant clusters, and their angular characteristics. However, to represent the nonuniform statistics of the individual rays within each clus-ter, we have used the Laplacian distribution.
Now, to derive the spatial correlation between two an-tenna elements due to signal clusters in indoor clustering channels, we first derive the spatial correlation between two adjacent antenna elements due to finite signal clusters in a non-line-of-sight (NLOS) Rayleigh scenario. The correla-tion for Ricean channels is later obtained by accounting for
the RiceanK factor. For an indoor channel where
cluster-ing propagation occurs, the assumption of local plane waves (far-field approximation) is realistic when the separation be-tween the sources of the clustering waves and the antenna arrays are larger than the array aperture. Therefore, the di-rection of propagation can be approximated to be the same at each array element and the array elements are assumed to be within the same small-scale fading area and receive identi-cal clusters. To simplify the problem, we further assume that the effective clusters are confined within the horizontal plane. Based on these assumptions, we proceed to derive the spatial correlation of received signals at two adjacent antenna ele-ments due to an incident reference cluster.
Letr1(t) andr2(t) denote the complex envelopes of the received signals at any two adjacent antennas, and the corre-lation coefficient is defined as [34]
ρ(d)= E
r1(t)r2∗(t)
Er1(t)2
Er2(t)2
, (7)
whereE{·}denotes the expectation operator,∗denotes the
complex conjugate transpose operation, dis the separation
between the two antennas. Since the difference between the received signals at the two adjacent elements induced by an incident plane wave is mostly a phase factor, the correlation between two identical antennas due to a single wave arriving
from an angleθcan be approximated as
ρ(d)=e−jk0dcosθ, (8)
d θi
Figure1: A reference cluster impinging on a two-element array.
wherek0is the wave number. Now assume the reference
clus-ter to arrive from the direction ofθi, as depicted inFigure 1. Since the number of rays within a cluster can be very large, the resultant correlation,ρ(d,θi), due to the reference cluster can be obtained as
ρd,θi
=Ee−jk0dcos(θi+θ) =
θe
−jk0dcos(θi+θ)p(θ)dθ, (9)
where θis the AOA of an individual ray within the cluster
with respect to the mean,θi, of the reference cluster;p(θ) is the probability density function that characterizes the angles of arrival of individual rays with respect toθi.
Knowing the distribution p(θ) of the AOAs of all the
multipath components within each cluster, one can obtain the spatial correlation using (9). Based on the evidence that the Laplacian distribution fits the measured signal cluster data well in typical indoor environments as reported in
[17,19], here we adopt a zero-mean Laplacian distribution
to represent the angular features of multipath components within each cluster.
With the angular information on hand, the spatial
cor-relation between two receiving antenna elements,ρNLOS(d),
due to all effective signal clusters in a Rayleigh scenario, can be calculated using
ρNLOS(d)=E
ρd,θi
. (10)
Equation (10) is suitable when there is no direct line-of-sight path between transmit and receive antennas. If a dominant LOS component exists between them as in Ricean channels, the total spatial correlationρ(d) needs to include the Ricean factor,K, which is given by [12]
ρ(d)= K
K+ 1ρLOS(d) + 1
K+ 1ρNLOS(d), (11)
whereρLOS(d) denotes the spatial correlation due to the LOS cluster in Ricean channels, which can be calculated using (8),
4.2. Use of ray tracing to obtain AOAs and AODs of signal clusters
The accuracy of ray tracing predictions of multipath in in-door radio channels has been well-established [28,30,31]. The results of angles of arrival of multipath components cal-culated using an image-based 3D ray tracing tool were val-idated with the “measured AOA” obtained by applying the spatially smoothed MUSIC algorithm on measurement data by Wang et al. [29]. The authors in [31] also reported a good agreement between the ray tracing predictions and measure-ments on the angular distribution of multipath waves in in-door channels. Thus the consistency with which the ray trac-ing predictions were validated with measurements forms the prime motivation for us to make use of ray tracing to obtain the angular characteristics of signal clusters in this paper.
When antenna arrays are used in an indoor environment at both the transmitter and receiver, the assumption of small
array aperture is valid as long asBa/c1 holds, whereBis
the signal bandwidth,ais the size of the antenna array, and
cis the speed of light. Therefore, it can be approximated that all the elements of the antenna array are located within the same small-scale area with respect to the reference element of the array within which the small-scale channel properties are assumed to be identical. Accordingly, the channel trans-fer functions of the MIMO connection can be viewed as a realization of a random process with the same statistics, in-cluding the average power, the temporal and angular features of signal clusters. For the sake of convenience, the transmit-ter and receiver are assumed to be located at the same height and only the rays confined within a horizontal plane are con-sidered in this paper.
Following [29], based on the assumption that the
domi-nant paths are confined in the same horizontal plane as that containing the transmitter and receiver, we have developed a 2D image-based ray tracing simulation tool to calculate the
angular information of signal clusters, as shown inFigure 2.
The antenna elements are modelled in the ray tracing sim-ulations as vertically polarized omnidirectional antennas. In the ray tracing program, the surfaces of most of the walls of the modelled rooms are assumed to be relatively smooth and all reflecting planes are assumed to be orthogonal. The 2D ray tracing model is set up using the building structure in-formation for a set of transmitter and receiver positions in a specified indoor environment. The positions of the reference transmitter and receiver elements are taken to approximately coincide with the locations of the actual transmit and re-ceive arrays. Multipath sources are established using the im-age principle. The ray paths are ordered by the number of the reflections they undergo. The line-of-sight ray is defined as the zeroth order ray and its AOA and AOD are calculated us-ing the geometrical positions of the receiver and transmitter. The rays that impinge on an object and get reflected directly to the receiver are denoted as the first-order rays. The rays from the transmitter which are reflected twice before they reach the receiver are denoted as second-order rays, and so forth. The reflected rays are traced by imaging the transmit-ter with respect to the walls.Figure 2shows the image sources
x y
TaI Walla
T Wallb
θAOD
LOS P
θAOA
R TbI
TbII
Figure2: A 2D image-based ray tracing model.
due to the walls lying in horizontal plane, where TbI, TbII,. . .
and so forth represent the first, second, and-higher order
im-ages of the source.Figure 2shows one zero-order, two
first-order and one second-first-order rays in a rectangular room with conducting walls, in which the dotted lines from the images to the receiver denote the virtual paths of the reflected rays.
In this method, both AOD and AOA are traced at the transmitter and receiver sides in the horizontal plane for all reflected rays. For each ray, the AOA is determined from the last reflecting point of the ray before it impinges on the re-ceiver; and the AOD is determined from the first reflecting point after leaving the transmitter. As shown inFigure 2, the AOA and AOD of the first-order ray “TPR” are obtained as
θAOA=arctan
yP−yR
xR−xP
, θAOD=arctan
yP−yT
xP−xT
,
(12)
whereθAOAandθAODare the AOA and AOD of the ray with
respect to thex-axis, (xT,yT) is the position of the transmit-ter, (xR,yR)is the position of the receiver, and (xP,yP)is the position of the reflection pointP.
The amplitude of thelth ray impinging on the receiver is given by
βl=β0
GT
GRL
dl j
Γξjl k
Tξkl
, (13)
whereGTandGRare the gains of transmit and receive anten-nas, respectively,β0 is the free space electric field at 1 meter away from the transmitter,L(dl) is the path loss for thelth
component having path lengthdl,
jΓ(ξjl) and
Door Corridor Door 14.95 m
Height 3.62 m Concrete wall with glass window
T2 5 m T1 4.98 m R2
R1
2.5 m 7.46
m
1
.
23
m
2
.
5m
Figure3: A specified classroom environment.
and obtain their mean AOAs and AODs. Once the mean AOAs and AODs of signal clusters are obtained, the rays within each cluster are assumed to follow the Laplacian dis-tribution [17] with certain angle spreads. We will later show how the angle spread influences signal correlation.
4.3. The MIMO channel matrix
Although it is possible to use ray tracing to directly calcu-late the channel transfer function, the computational load even for a simple indoor scenario can be very high. Hence, in the present case, we use ray tracing only for obtaining the numbers and their corresponding angular details of effective
signal clusters. Now using the method given in [10], we
con-struct the channel matrix so that the intrinsic correlation fea-tures at both ends of the MIMO channel are preserved.
Using the angular detail of signal clusters available at both the transmitter and receiver, we can obtain covariance matri-ces as
Rx=
ρi j
forx=RorT,i,j=1,. . .,MorP, (14)
where the entries of the matrices are the spatial correlation
coefficients between any two antenna elements at either the
transmitter or receiver. For NLOS Rayleigh channels, the cor-relation coefficient between theith and jth antennas,ρi j is calculated using (9) and (10). For LOS Ricean channels,ρi jis calculated using (11) to account for LOS effect.
After the covariance matrices at both sides are obtained,
using the Kronecker method, the MIMO channel matrixH
with P transmit andM receive antennas can be formed as
[5,10,20]
H=RR 1/2
GRT 1/2T
, (15)
whereGis anM×Pmatrix with i.i.d. elements, (·)1/2 repre-sents any matrix square root such thatR1/2(R1/2)∗=R, (·)T
denotes matrix transposition,RRandRT are the covariance
matrices at the receiver and transmitter sides, respectively.
5. IMPACT OF SIGNAL CLUSTERING ON INDOOR MIMO PERFORMANCE
In this section, we use the proposed hybrid MIMO channel model to assess the effect of signal clustering in a typical in-door environment based on simulations and measurements. To use the model, we need information on the physical fea-tures of a specified indoor environment so that ray tracing can be utilized to detect the number of signal clusters and cal-culate their angular details. Using the above information, we can calculate the covariance matrices at both ends using (10), (11), and (14), taking into account the presence or absence of the line-of-sight component. The full MIMO channel matrix is then generated using (15).
First, we validate the proposed model by comparing sim-ulations with our own measurement. The practical indoor environment chosen for validation is a rectangular-shaped classroom located on the 23rd floor of a 28-storey tower building of the University of Technology, Sydney (UTS),
as depicted in Figure 3. The classroom has dimensions of
14.95×7.46 m2with a height of 3.62 m, containing a number of wooden desks and plastic chairs, and is enclosed on one side by a concrete wall incorporating a wide metal-framed glass window. The other three sides of the room have brick internal walls. The room has two entrances which are made of two wooden frames to which are fixed wooden doors that open into a closed concrete-walled corridor. It is assumed
that for simulations, an MIMO system with a P-element
transmit and an M-element receive antenna arrays is
de-ployed in the room. Without the loss of generality, the num-ber of transmit and receive array elements are assumed to be
the same (P =M) for the MIMO calculations. Both arrays
Table1: Dielectric properties of modelled building materials (taken from [28]).
Material Relative permittivity Conductivity (S/m) Complex relative permittivity
Brick 4 0.003 4−j0.05
Concrete 9 0.05 9−j0.92
Table2: AOA and AOD obtained from ray tracing simulations.
Tx locations T1 T2
Rx locations R1 R2 R1 R2
AOA AOD AOA AOD AOA AOD AOA AOD
NLOS cluster
129 51 0 0 148 32 0 0
184 176 124 56 185 175 143 37
353 7 236 304 221 319 217 323
240 300 — — 355 5 — —
LOS 194 14 180 0 187 7 180 0
is, the AOAs and AODs of multipath components. The re-flection coefficients for the walls are evaluated using the data
given inTable 1that was gleaned from measurement results
presented in [28] for the same building. The simulations
were performed for a carrier frequency of 5.2 GHz. Using
the same algorithm as in [17], we can obtain the mean AOAs
and AODs of the respective clusters via a computer program which displays a visual image of the processed data allowing the user to identify clusters by visual examination.
For comparing measurements with simulations made in-side the room, two representative scenarios are conin-sidered in terms of transmitter and receiver pairs, namely, transmit positions T1, T2 and receive positions R1, R2 as shown in Figure 3. Thus, a total of four reference transmitter-receiver (T-R) pairs, T1R1, T1R2, T2R1, and T2R2, can be formed for making the comparison. Assuming that the transmit
ar-ray containsPantenna elements and the receive array
con-tainsMantenna elements, for each T-R pair, we get aP×M
MIMO connection. Using the ray tracing method, for each T-R pair, the mean AOAs and AODs of effective signal clus-ters are obtained and tabulated inTable 2.
5.1. Effect of signal clusters on spatial correlation Since the degree of the spatial correlation determines the achievable MIMO capacity gain, we first investigate the ef-fect of clustering propagation as well as the presence of the
LOS component on the spatial correlation. Figure 4shows
the plot of the spatial correlation coefficient between received signals at two adjacent antenna elements as a function of array interelement spacing for the four reference T-R pairs. The rays within clusters are assumed to follow Laplacian
dis-tribution with an angle spread (AS) of 22◦, a value that is
gleaned from the published measured data [17] for typical
indoor scenarios. The Ricean factor K is assumed to be 2
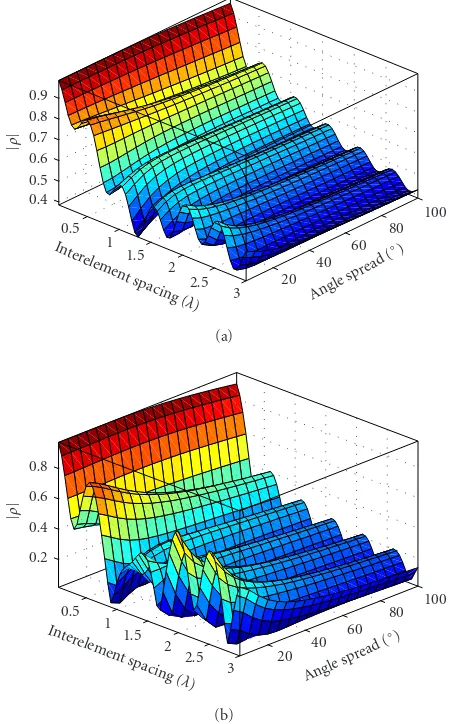
(3 dB) in these calculations. The correlation results are com-pared with those for the unclustered case calculated using (6) [33].Figure 4reveals that the unclustered case has lower val-ues of correlation coefficients. InFigure 5athe spatial corre-lation coefficient is plotted as a function of the angle spread
of clusters for the T-R pair T1R1 with a Ricean factorK=2.
Unclustered model T1R1
T1R2
T2R1 T2R2
0 0.5 1 1.5 2 2.5 3 3.5 4 4.5 5 Interelement spacing (λ)
0.1 0.2 0.3 0.4 0.5 0.6 0.7 0.8 0.9 1
|
ρ
|
Figure4: Correlation coefficients between two antenna elements.
Figure 5bprovides results to compare the impact of the an-gle spread of clusters with and without LOS condition. Here the NLOS results were obtained by artificially blocking the LOS ray for the same T1R1 pair. It is clear from the plot that the effect of the angle spread of clusters is more significant for NLOS scenarios as compared to LOS scenarios. A large differential can be seen between the results of the NLOS and LOS scenarios when the angle spread varies between 5◦– 45◦. This can be attributed to the absence or presence of the dom-inant LOS component. Without the domdom-inant LOS compo-nent, the correlation becomes smaller. This makes the inves-tigation of the effect of RiceanKfactor on the spatial tion for LOS channels very appropriate. The spatial
correla-tion between two antenna elements as a funccorrela-tion ofKfactor
for the T-R pair T1R1 for an angle spread of 22◦is presented
inFigure 6. It is clear from the figure that the RiceanKfactor has a significant impact on the signal correlation. The
cor-relation coefficient increases rapidly whenKincreases from
0.2 to 6. This result confirms that, for an indoor MIMO
0.5 1
1.5 2
2.5 3 Interelement
spacing (λ)
20 40
60 80
100
Angle
spread
(◦)
0.4 0.5 0.6 0.7 0.8 0.9
|
ρ
|
(a)
0.5 1
1.5 2
2.5 3 Intere
lement spac ing (λ)
20 40 60
80 100
Angle spread
(◦)
0.2 0.4 0.6 0.8
|
ρ
|
(b)
Figure5: Effect of the angle spread on spatial correlation. (a)
Cor-relation coefficient as a function of angle spread of clusters for LOS channel. (b) Correlation coefficient as a function of angle spread of clusters when LOS is blocked.
component can cause an increase in correlation which can be an impediment for achieving higher capacity.
5.2. Measurements and comparisons
Here we attempt to validate our channel model with
mea-surement data collected in the same classroom as inFigure 3
in terms of achievable MIMO capacity. In addition, we will show a comparison with the unclustered case to highlight the effect of signal clustering in indoor environments. The measurements were performed using a vector network
ana-lyzer (VNA) HP 8720A at a centre frequency of 2.45 GHz for
vertical polarization inside the same classroom as shown in Figure 3. Both the transmit and receive arrays were formed as synthetic arrays using commercially available sleeve dipole antennas in order to avoid mutual coupling and also to reduce the complexity and cost of the MIMO measure-ment. The measurements were conducted during weekends to avoid the movement of people so as to approximate a qua-sistatic channel condition. To obtain a virtual transmit ar-ray, a computer-controlled angular scanner moved a sleeve
0 1
2 3
4 5
Interelement spacin g (λ)
2 4 6
8
Ricean factor
K
0.2 0.4 0.6 0.8
|
ρ
|
Figure6: Correlation coefficient for LOS channel as a function of
Ricean factorK.
dipole antenna around a circle to form a virtual four-element uniform circular array (UCA) with a radius of half a wave-length. At the receiver side, a virtual receive array was ob-tained using a computer-controlled X-Y scanning system. A synthetic uniform rectangular array was formed by moving a dipole antenna over the horizontal plane. For each trans-mit and receive pair, 801 frequency response measurements were acquired within a bandwidth of 120 MHz. In the mea-surements, the transmit antenna was located at position T2
as indicated inFigure 3, whilst the receiver was moved
be-tween different positions. During all the measurements, the
heights of both transmit and receive antennas were fixed at 1.7 m above the floor level.
A plot of the cumulative distribution function (CDF) of the MIMO capacity obtained using both simulation and measurement for the reference T-R pairs T2R1 and T2R2 is
shown in Figures7aand7b, respectively. The MIMO
connec-tions were established between a virtual four-element uni-form circular transmit array with a radius of half a wave-length and a virtual four-element uniform linear receive ar-ray with half a wavelength interelement spacing at a centre
frequency of 2.45 GHz. With reference toFigure 3, the
re-ceive uniform linear array (ULA) was placed to lie paral-lel to the concrete wall and the corridor. For each receive
position, the measured 4×4 MIMO channel transfer
matri-ces were normalized to calculate the experimental channel
capacity using (2) under an equal power allocation scheme
with an average SNR=20 dB. Later, using ray tracing
simu-lations, the number of effective clusters and their AODs and
AOAs were calculated for the same scenarios as inFigure 3
at a centre frequency of 2.45 GHz. Using the Laplacian
dis-tribution with an angle spread of 22◦ to represent the rays
within each cluster, the correlation matrices at the trans-mitter and receiver were obtained via (9), (10), and (11), and then 15 000 random MIMO channel matrix realizations
were simulated using (15). We have assumed in the
simula-tions the same transmit and receive antenna array
configu-ration as used in the measurements. The Ricean K factors
for simulations were taken directly from experimental values
Thus,K=3.5 was obtained for the reference T-R pair T2R1 andK=3.6 for the reference T-R pair T2R2. The average re-ceive SNR was set to 20 dB in both the experiment and sim-ulations. The results in Figures7aand7bshow that there is a good agreement between the simulated and measured results for the two reference T-R pairs considered for comparison. While there is an agreement on both trend and median value of capacity, a discrepancy that is seen either for the very high capacity or very low capacity may be due to the inadequate
number of measurement data (801×4=3204 MIMO
mea-sured realizations for each link) as compared to 15 000 real-izations for the simulation. The simulation for unclustered case assumes all NLOS multipath components, except the
LOS component, to uniformly span the range of [0, 2π). The
correlation due to NLOS unclustered multipath components
was calculated using (6). As shown, the unclustered model
overestimates the capacity by 2 bits/s/Hz than that obtained by both the measurement and the simulation using the clus-ter model. The channel capacity calculated for the four
ref-erence T-R pairs withK =3.5, angle spread of 22◦as
com-pared with i.i.d. scenarios fixing the SNR at 20 dB for a centre
frequency of 2.45 GHz is shown inFigure 7c. The
compari-son with i.i.d. case is included here since the capacity of the i.i.d. uncorrelated channels can be considered as the
upper-bound on the achievable MIMO capacity. The 4×4 MIMO
connections for the four reference T-R pairs are assumed to be established between a four-element uniform circular ar-ray having a radius of half a wavelength at the transmitter and a four-element uniform linear array with half a wave-length interelement spacing at the receiver. Although, as seen inFigure 7c, the results for all four reference T-R pairs show similar trends, due to the presence of LOS component, the capacities obtained are smaller than that of the i.i.d. chan-nels. The relatively higher values of capacity obtained for the pair T1R1 could be due to the effect of angular orientation of the ULA which will be investigated in the next section.
5.3. Effect of array topologies in clustering indoor environments
As we have seen in previous section, the clustering of mul-tipath signals affects the signal correlation between array el-ements which in turn has bearing on the achievable MIMO capacity. Due to the use of multiple-element antennas to ex-ploit multipath fading, the correlation between antenna ele-ments can be sensitive to the array topology and subsequent changes in the angular characteristics of multipath waves
[5, 9, 36]. As the propagation of multipath waves is
ran-dom, even within the same physical indoor environment, for a given link pair, with, say, transmitter end fixed, the prop-agation characteristics such as AOA, AOD, and so forth, can vary with the change at the receive end. Thus, the choice of array topology to exploit the signal clustering in indoor en-vironments assumes practical significance for indoor MIMO applications.
To gain insights on these issues, we investigate and com-pare the performances of five- and six-element antenna ar-rays operating in a specified indoor environment. The
con-sidered arrays are arranged in different topologies as shown
Experimental Proposed model Unclustered model
10 12 14 16 18 20 22 24 26 28 Capacity (bits/s/Hz)
0.1 0.2 0.3 0.4 0.5 0.6 0.7 0.8 0.9 1
CDF
(a)
Experimental Proposed model Unclustered model
10 12 14 16 18 20 22 24 26 Capacity (bits/s/Hz)
0.1 0.2 0.3 0.4 0.5 0.6 0.7 0.8 0.9 1
CDF
(b)
T1R1 T1R2 T2R1
T2R2 i.i.d. channel 8 10 12 14 16 18 20 22 24 26 28
Capacity (bits/s/Hz) 0.1
0.2 0.3 0.4 0.5 0.6 0.7 0.8 0.9 1
CDF
(c)
Figure7: Comparison of capacity for 4×4 MIMO channels. (a) Capacity comparison for T-R pair T2R1 (angle spread=22◦,K=
d
d
√
2d d
d
d
d d
Figure8: Antenna array topologies considered.
inFigure 8. The five-element array topologies considered
in-clude a ULA, a UCA with a radius of 0.85d, and a
modi-fied square array (MSA) in which four elements are arranged as a square planar array with the fifth element located at its centre. The six-element array topologies considered include
a ULA, a UCA with a radius ofd, and a 2×3 planar
uni-form rectangular array to be denoted as URA. The
interele-ment spacing “d” is assumed to be half a wavelength. Our
aim here is to find out an array topology that performs better in indoor clustering environments, from the point of view of achievable MIMO capacity.
Here we keep a uniform linear array at the transmit side fixed to maintain the same fading correlation condition, and at the receive side, different array topologies as shown in Figure 8are considered, thereby obtaining either a 5×5 or
6×6 MIMO connection. The receive arrays are rotated to
simulate various orientations of the receiver. The mean ca-pacity is calculated when the receive array is rotated in the
horizontal plane by an angle of 3◦with respect to array
cen-tre. The variance of the channel capacity can be used as a parameter that measures the angle sensitivity of the receive array topology. Since the variance of the capacity is due to the rotation of the array, we would like to denote this vari-ance as the angular capacity variation (ACV) of a given array.
For an MIMO system employing different array topologies in
the same propagation scenario, a smaller value for the ACV parameter reflects lower sensitivity with respect to the
angu-lar characteristics of signal clusters. Tables3and4provide
the calculated data on ACV, mean, maximum and minimum capacities for ULA, UCA, MSA, URA topologies for the four
reference T-R pairs inside the same classroom as inFigure 3.
In addition, results for an i.i.d. case are also included for the sake of comparison. For the i.i.d. case, no angle effect is con-sidered and hence ACV values are always less than 0.1.
All simulations use the same parameters:K = 3.5,
an-gle spread = 22◦, and an average SNR of 20 dB at a centre
frequency of 5.2 GHz. A comparison of the mean MIMO
ca-pacity for 5×5 and 6×6 MIMO for only one reference T-R
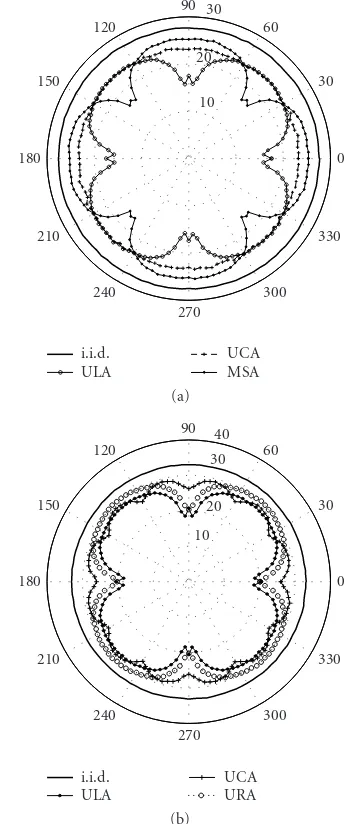
pair T2R1 is shown inFigure 9which demonstrates the
ef-fects of array topology. It must be mentioned that the shapes of the plots for the other reference T-R pairs appear similar toFigure 9and hence are not repeated here. The capacity pa-rameters obtained for an i.i.d. channel are also included in the same figure for comparison.
0 30 60 90
120 150
180
210 240
270
300 330 10
20 30
i.i.d. ULA
UCA MSA (a)
0 30 60 90
120 150
180
210
240
270
300 330 10
20 30
40
i.i.d. ULA
UCA URA (b)
Figure9: Angular performance for different receive array
topolo-gies. (a) 5×5 MIMO for T-R pair T2R1. (b) 6×6 MIMO for T-R pair T2R1.
The results given in Tables3and4indicate that amongst
all the topologies considered, the uniform circular array per-forms best, that is, UCA has the smallest angular capacity variations and the largest values of mean capacity within each group. However, differences in results for five- and six-element arrays are also observed. Among the five-six-element ar-rays, the MSA, for all the scenarios considered, has achieved the highest maximum capacity with a mean capacity similar to the corresponding UCA. However, the ACV obtained for MSA is also the largest of the three arrays considered. This
is evident fromFigure 9afor T-R pair T2R1. For six-element
arrays, for the reference T-R pairs T1R1 and T1R2, the largest angular capacity variation equal to 2.92 for T1R1 and 3.05
for T1R2 is obtained for the URA as tabulated in Table 4.
However, for the T-R pairs T2R1 and T2R2, the largest vari-ations of angular capacity equal to 3.23 and 3.154 are
Table3: Angle sensitive parameters for different array topologies (T-R pairs T2R1 and T2R2).
T2 5×5 6×6
ULA UCA MSA i.i.d. ULA UCA URA i.i.d.
R1
ACV 2.58 0.29 2.71 0.06 3.23 1.01 2.97 0.07
Mean 21.17 23.11 23.01 27.59 25.02 27.75 27.58 33.04 Max 23.53 24.35 25.34 27.71 28.08 28.93 30.32 33.21 Min 15.25 22.64 16.35 27.44 17.73 25.78 19.94 32.9
R2
ACV 2.51 0.18 2.72 — 3.15 1.02 2.99 —
Mean 21.36 23.27 23.21 — 25.43 27.96 27.75 —
Max 23.83 23.67 25.52 — 28.34 29.32 30.64 —
Min 15.76 22.84 16.66 — 18.45 26.04 20.19 —
Table4: Angle sensitive parameters for different array topologies (T-R pairs T1R1 and T1R2).
T1 5×5 6×6
ULA UCA MSA i.i.d. ULA UCA URA i.i.d.
R1
ACV 2.16 0.32 2.58 0.06 2.71 0.92 2.92 0.07
Mean 22.23 23.81 24.24 27.59 26.53 29.3 29.24 33.04
Max 24.63 25.11 26.58 27.71 29.36 30.51 32.1 33.21
Min 18.31 22.94 18.44 27.44 21.7 27.84 22.45 32.9
R2
ACV 1.94 0.18 2.48 — 2.43 1.06 3.05 —
Mean 21.83 23.17 23.64 — 26.01 28.02 27.99 —
Max 23.9 23.65 25.85 — 28.57 29.29 30.99 —
Min 18.22 22.73 18.07 — 21.56 26.22 20.74 —
propagation of signal clusters appears to degrade the achiev-able capacity. All the above results favourably point towards the uniform circular array, among all the topologies consid-ered, as the possible choice for use in clustering indoor envi-ronments.
5.4. Efficiency of the clustering indoor channels In the design and development of indoor MIMO systems, the optimization of the performance-to-cost ratio requires finding an optimum number of antenna elements for a speci-fied indoor channel which can best exploit the intrinsic diver-sity. This topic has drawn much attention in terms of antenna selections for the MIMO technique [14,15]. The objective of the antenna selection is to achieve the best performance-to-cost ratio so as to obtain the optimized capacity and reduce the expensive RF chains. As the achievable MIMO capacity is heavily reliant on the multipath fading channels, the antenna selection criteria for indoor MIMO systems must account for the characteristics of clustering propagation. In this section, rather than concentrating on antenna selection schemes, we wish to focus on the channel efficiency of indoor MIMO sys-tems in a specified clustering indoor environment in order to gain insights that may aid in the design of antenna selection criteria. The channel efficiency here refers to the achievable subchannel capacity per used antenna, denoted in terms of bits/s/Hz/element.
A finite number of incident clusters allows a particu-lar correlated channel to accommodate only a finite num-ber of spatial subchannels with sufficient subchannel gain for
T1R1 T1R2 T2R1
T2R2 i.i.d.
5 10 15 20 25 30
Number of antenna elements 3
3.2 3.4 3.6 3.8 4 4.2 4.4 4.6 4.8
Capacit
y
(bits/s/Hz/element)
Figure10: Subchannel efficiency when ULAs are used at both the
transmitter and receiver.
transmitting the signals. Therefore, the efficiency per element will decrease when the number of elements of the antenna array increases. This is evident from the simulations shown in Figure 10for the four reference T-R pairs: T1R1, T1R2,
T2R1, and T2R2 inside the classroom as shown inFigure 3.
T1R1 T1R2
T2R1 T2R2
0 1 2 3 4 5 6 7 8 9 10
Ricean factorK 14
15 16 17 18 19 20 21 22
Capacit
y
(bits/s/Hz)
Figure11: Effect of theKfactor in clustering channels.
at both the transmitter and receiver. Both the arrays are as-sumed to be located inside the classroom parallel to the cor-ridor and have the same number of elements. We restrict our attention only for ULA here, as our aim is to introduce the idea of channel efficiency for clustered indoor channels.
The simulation parameters are Ricean factor K = 3.5,
an-gle spread is 22◦, and the average SNR is 20 dB at a centre
frequency of 5.2 GHz. For the sake of comparison, the
chan-nel efficiency for an ideal i.i.d. chanchan-nel is also included in Figure 10, since the efficiency for i.i.d. channels can be con-sidered to be an upperbound. For all the pairs except for the
i.i.d. case, the efficiency per antenna element decreases with
the increase in the number of array elements. The subchan-nel efficiency for i.i.d. chansubchan-nels is almost a constant, but for the cluster case, the subchannel efficiency for all the four ref-erence T-R pairs decreases by 18% – 25% when the number of elements of ULA increases from 2–20. The subchannel ef-ficiency has a decreasing trend and the differences seen in the results for the same indoor environment can be attributed to the differing angular properties of clusters due to the dif-ferent receiver and transmitter locations. These results em-phasize that the antenna selection process for indoor MIMO
systems must incorporate the effect of propagating clusters
and their angular features.
5.5. Effect of Ricean factor in LOS clustering channels
We have already demonstrated the effect of Ricean factorK
on the spatial correlation of received signals in the
previ-ous section. Here, we investigate its effect on MIMO
perfor-mance. The effect of the Ricean factor on the equal power
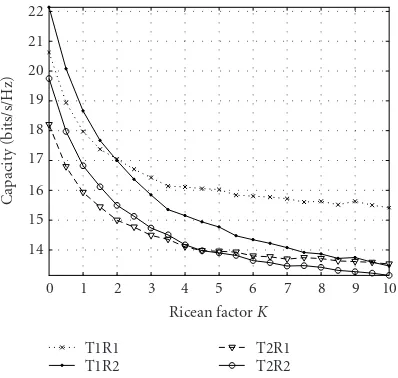
ca-pacity for the four reference T-R pairs is plotted inFigure 11.
The simulation results inFigure 11are based on 4×4 MIMO
connections with ULAs placed parallel to the corridor at each
end inside the classroom as shown inFigure 3. The
interele-ment spacing for the ULAs is half a wavelength. All
sim-ulations use the following parameters: angle spread is 22◦
and the SNR is 20 dB at a centre frequency of 5.2 GHz. The
Clustering-waterfilling Unclustered-waterfilling
Clustering-equal power Unclustered-equal power
0 1 2 3 4 5 6 7 8 9 10
Ricean factorK 5
6 7 8 9 10 11
Capacit
y
(bits/s/Hz)
Figure12: Comparison of the effect ofKfactor in clustering and unclustered scenarios for T2R1.
capacity shows a decreasing trend with increasing values of theKfactor and is consistent for all the four T-R pairs. Due to differing angular characteristics of clusters and angular sensitivities of ULAs, the effect of theKfactor varies for dif-ferent links. For the communication pairs T1R2 and T2R2 for which the LOS component is parallel to the corridor as well as to the axis of ULA, the effect is more significant than the other two T-R links. Further, the effect of the Ricean fac-tor on the two power allocation schemes (equal power and waterfilling) in both clustering and unclustered scenarios are compared. For the all four T-R pairs, similar trends can be
seen to occur. Figure 12shows the comparison of the two
MIMO power allocation schemes for the T-R pair T2R1 in both clustering and unclustered scenarios as a function of the
Ricean factor K with the following fixed parameters: angle
spread is 22◦ for clustering scenarios and the SNR is 10 dB
at a centre frequency of 5.2 GHz. The 4×4 MIMO uses
ULAs with half a wavelength interelement spacing at both ends. The equal power and waterfilling capacities were re-spectively obtained using (4) and (5). The correlation caused
by unclustered NLOS components is obtained using (6)
as-suming NLOS rays to be uniformly distributed over [0, 2π).
As can be seen, in all the cases, the obtainable capacity
de-creases with increasing values of theKfactor. For the equal
power allocation scheme, the effect of Ricean factor K on
both clustering and unclustered scenarios is similar.
How-ever, for waterfilling power allocation scheme, some diff
er-ences are observed between clustering and unclustered
sce-narios. When the value ofKfactor increases from 0 – 6, the
waterfilling and equal power capacities for unclustered
sce-nario decrease by about 28.7% and 34.3%; and for the
clus-tering scenario, both capacities decrease by about 26.5% and
From the above discussion, we conclude that the effect
of the Ricean factorKis negative for the two MIMO power
allocation schemes, namely, equal power and waterfilling al-gorithms, in both clustering and unclustered LOS scenarios.
6. CONCLUSIONS
In this paper, we have proposed a hybrid MIMO channel model for indoor propagation environments, which is uti-lized to investigate the effect of signal clusters on the per-formance of indoor MIMO systems. Our studies reveal that the clustering of multipath waves affects the MIMO chan-nel capacity by influencing the spatial correlation among MIMO subchannels. Due to the clustering of multipath waves, the achievable MIMO capacity in indoor environ-ments was found to be always lower than that of the ideal i.i.d. scenarios. Comparisons with measurement results also indicate that the unclustered uniform model will overesti-mate the actual MIMO performance. The simulations in a specified indoor environment show that the impact of the angle spread of clusters on spatial correlation is more sig-nificant for Rayleigh channels than for Ricean channels. In Ricean clustering channels, an increase in the value of the Ricean factor degrades MIMO capacity since the dominance of the LOS component tends to increase the spatial corre-lation. The investigations on angle sensitivity for five- and six-element array topologies indicate that uniform circular arrays have the best angular performance and achieve the highest mean capacity in clustering indoor channels when compared with other types of array topologies. The
subchan-nel efficiency in clustering indoor environments is also
in-vestigated to gain insights for the design of antenna selection criteria for indoor MIMO systems. The results predicted us-ing the proposed hybrid model compare well with measure-ment results thus emphasizing its usefulness as an efficient and accurate means to evaluate practical indoor MIMO per-formance.
ACKNOWLEDGMENT
The project is funded by the Australian Research Council through a linkage grant program with Singtel Optus Pty Lim-ited as the industry partner.
REFERENCES
[1] D. Gesbert, M. Shafi, D.-S. Shiu, P. J. Smith, and A. Naguib, “From theory to practice: an overview of MIMO space-time coded wireless systems,”IEEE J. Select. Areas Commun., vol. 21, no. 3, pp. 281–302, 2003.
[2] A. J. Paulraj, D. A. Gore, R. U. Nabar, and H. B¨olcskei, “An overview of MIMO communications—A key to Gigabit Wire-less,”Proc. IEEE, vol. 92, no. 2, pp. 198–218, 2004.
[3] G. J. Foschini and M. J. Gans, “On limits of wireless commu-nications in a fading environment when using multiple anten-nas,”Wireless Personal Communications, vol. 6, no. 3, pp. 311– 335, 1998.
[4] I. E. Telatar, “Capacity of multi-antenna Gaussian channels,” European Transactions on Telecommunications, vol. 10, no. 6, pp. 585–595, 1999.
[5] D.-S. Shiu, G. J. Foschini, M. J. Gans, and J. M. Kahn, “Fading correlation and its effect on the capacity of multielement an-tenna systems,”IEEE Trans. Commun., vol. 48, no. 3, pp. 502– 513, 2000.
[6] J. P. Kermoal, L. Schumacher, K. I. Pedersen, P. E. Mogensen, and F. Frederiksen, “A stochastic MIMO radio channel model with experimental validation,”IEEE J. Select. Areas Commun., vol. 20, no. 6, pp. 1211–1226, 2002.
[7] P. Kyritsi and D. C. Cox, “Correlation properties of MIMO radio channels for indoor scenarios,” inProc. 35th Asilomar Conference on Signals, Systems and Computers (ACSSC ’01), vol. 2, pp. 994–998, Pacific Grove, Calif, USA, November 2001.
[8] M. T. Ivrlac, W. Utschick, and J. A. Nossek, “Fading corre-lations in wireless MIMO communication systems,”IEEE J. Select. Areas Commun., vol. 21, no. 5, pp. 819–828, 2003. [9] P. Kyritsi, D. C. Cox, R. A. Valenzuela, and P. W. Wolniansky,
“Effect of antenna polarization on the capacity of a multiple element system in an indoor environment,”IEEE J. Select. Ar-eas Commun., vol. 20, no. 6, pp. 1227–1239, 2002.
[10] D. Chizhik, F. Rashid-Farrokhi, J. Ling, and A. Lozano, “Effect of antenna separation on the capacity of BLAST in correlated channels,”IEEE Commun. Lett., vol. 4, no. 11, pp. 337–339, 2000.
[11] D. Hampicke, M. Landmann, C. Schneider, et al., “MIMO ca-pacities for different antenna array structures based on double directional wide-band channel measurements,” inProc. IEEE 56th Vehicular Technology Conference (VTC ’02), vol. 1, pp. 180–184, Vancouver, British Columbia, Canada, September 2002.
[12] A. Abdi and M. Kaveh, “A space-time correlation model for multielement antenna systems in mobile fading channels,” IEEE J. Select. Areas Commun., vol. 20, no. 3, pp. 550–560, 2002.
[13] P. F. Driessen and G. J. Foschini, “On the capacity formula for multiple input-multiple output wireless channels: a geometric interpretation,”IEEE Trans. Commun., vol. 47, no. 2, pp. 173– 176, 1999.
[14] A. F. Molisch, “MIMO systems with antenna selection—an overview,” inProc. Radio and Wireless Conference (RAWCON ’03), pp. 167–170, Boston, Mass, USA, August 2003.
[15] A. Gorokhov, D. A. Gore, and A. J. Paulraj, “Receive an-tenna selection for MIMO spatial multiplexing: theory and algorithms,”IEEE Trans. Signal Processing, vol. 51, no. 11, pp. 2796–2807, 2003.
[16] A. A. M. Saleh and R. A. Valenzuela, “A statistical model for indoor multipath propagation,” IEEE J. Select. Areas Com-mun., vol. 5, no. 2, pp. 128–137, 1987.
[17] Q. H. Spencer, B. D. Jeffs, M. A. Jensen, and A. L. Swindle-hurst, “Modeling the statistical time and angle of arrival char-acteristics of an indoor multipath channel,”IEEE J. Select. Ar-eas Commun., vol. 18, no. 3, pp. 347–360, 2000.
[18] J.-H. Jo, M. A. Ingram, and N. Jayant, “Angle clustering in in-door space-time channels based on ray tracing,” inProc. IEEE 54th Vehicular Technology Conference (VTC ’01), vol. 4, pp. 2067–2071, Atlantic City, NJ, USA, October 2001.
[19] C.-C. Chong, C.-M. Tan, D. I. Laurenson, S. McLaughlin, M. A. Beach, and A. R. Nix, “A new statistical wideband spatio-temporal channel model for 5-GHz band WLAN systems,” IEEE J. Select. Areas Commun., vol. 21, no. 2, pp. 139–150, 2003.
[21] K.-H. Li, M. A. Ingram, and A. Van Nguyen, “Impact of clus-tering in statistical indoor propagation models on link capac-ity,”IEEE Trans. Commun., vol. 50, no. 4, pp. 521–523, 2002. [22] K. Yu, M. Bengtsson, B. Ottersten, D. McNamara, P.
Karls-son, and M. A. Beach, “Second order statistics of NLOS in-door MIMO channels based on 5.2 GHz measurements,” in Proc. IEEE Global Telecommunications Conference (GLOBE-COM ’01), vol. 1, pp. 156–160, San Antonio, Tex, USA, November 2001.
[23] J. W. Wallace and M. A. Jensen, “Modeling the indoor MIMO wireless channel,”IEEE Trans. Antennas Propagat., vol. 50, no. 5, pp. 591–599, 2002.
[24] A. Burr, “Evaluation of capacity of indoor wireless MIMO channel using ray tracing,” inProc. International Zurich Semi-nar on Broadband Communications, Access, Transmission, Net-working (IZS ’02), pp. 28-1–28-6, Zurich, Switzerland, Febru-ary 2002.
[25] H. Hashemi, “The indoor radio propagation channel,”Proc. IEEE, vol. 81, no. 7, pp. 943–968, 1993.
[26] H. Nikookar and H. Hashemi, “Phase modeling of indoor ra-dio propagation channels,”IEEE Trans. Veh. Technol., vol. 49, no. 2, pp. 594–606, 2000.
[27] M. Lu, T. Lo, and J. Litva, “A physical spatio-temporal model of multipath propagation channels,” inProc. IEEE 47th Ve-hicular Technology Conference (VTC ’97), vol. 2, pp. 810–814, Phoenix, Ariz, USA, May 1997.
[28] H. Suzuki and A. S. Mohan, “Measurement and prediction of high spatial resolution indoor radio channel characteristic map,”IEEE Trans. Veh. Technol., vol. 49, no. 4, pp. 1321–1333, 2000.
[29] J.-G. Wang, A. S. Mohan, and T. A. Aubrey, “Analysis of AOA of multipath signals inside buildings: A comparison between MUSIC and Ray Tracing,” inProc. International Symposium on Antennas and Propagation (IASP ’96), vol. 1, pp. 189–192, Chiba, Japan, September 1996.
[30] S. Y. Seidel and T. S. Rappaport, “Site-specific propagation prediction for wireless in-building personal communication system design,” IEEE Trans. Veh. Technol., vol. 43, no. 4, pp. 879–891, 1994.
[31] G. German, Q. H. Spencer, A. L. Swindlehurst, and R. A. Valenzuela, “Wireless indoor channel modeling: statistical agreement of ray tracing simulations and channel sounding measurements,” inProc. IEEE Int. Conf. Acoustics, Speech, Sig-nal Processing (ICASSP ’01), vol. 4, pp. 2501–2504, Salt Lake City, Utah, USA, May 2001.
[32] R. Vaughan and J. B. Andersen,Channels, Propagation and Antennas for Mobile Communications, Institution of Electrical Engineers, London, UK, 2003.
[33] W. C. Jakes,Microwave Mobile Communications, IEEE Press, Piscataway, NJ, USA, 1994.
[34] H. Xu, M. J. Gans, D. Chizhik, J. Ling, P. W. Wolniansky, and R. A. Valenzuela, “Spatial and temporal variations of MIMO channels and impacts on capacity,” inProc. IEEE International Conference on Communications (ICC ’02), vol. 1, pp. 262–266, New York, NY, USA, April–May 2002.
[35] L. J. Greenstein, D. G. Michelson, and V. Erceg, “Moment-method estimation of the Ricean K-factor,”IEEE Commun. Lett., vol. 3, no. 6, pp. 175–176, 1999.
[36] A. F. Molisch, M. Steinbauer, M. Toeltsch, E. Bonek, and R. S. Thoma, “Capacity of MIMO systems based on measured wireless channels,” IEEE J. Select. Areas Commun., vol. 20, no. 3, pp. 561–569, 2002.
Zhongwei Tang received the M.E. degree in information and telecommunication en-gineering from the Southeast University (SEU), China, in 1999. He is currently with the Microwave and Wireless Technology Re-search Laboratory (MWTRL), Information and Communication Group, Faculty of En-gineering, University of Technology, Sydney (UTS), Australia, where he has been work-ing towards his Ph.D. degree since 2002.
His current research interests include indoor propagation, MIMO channel measurements, characterization and modelling, smart an-tennas, MIMO systems, and array signal processing.
Ananda Sanagavarapu Mohanis currently a member of the Faculty of Engineering, University of Technology, Sydney (UTS), Australia, where he leads research on an-tennas, microwaves, wave propagation, and wireless technology. He received a Ph.D. de-gree in electrical communication engineer-ing from the Indian Institute of Technology, Kharagpur, India, and was a Scientist and Senior Scientist at the Research and
![Table 1: Dielectric properties of modelled building materials (taken from [28]).](https://thumb-us.123doks.com/thumbv2/123dok_us/1137795.1142722/7.600.55.551.89.127/table-dielectric-properties-modelled-building-materials-taken.webp)