Volume 2009, Article ID 619805,20pages doi:10.1155/2009/619805
Research Article
The Acoustic and Peceptual Effects of Series and
Parallel Processing
Melinda C. Anderson,
1Kathryn H. Arehart,
1and James M. Kates
1, 21SLHS-Speech, Department of Speech, Language, and Hearing Science, University of Colorado at Boulder,
409 UCB, Boulder, CO 80309, USA
2GN Resound 2601 Patriot Blvd., Glenview, IL 60026, USA
Correspondence should be addressed to Melinda C. Anderson,[email protected]
Received 8 December 2008; Revised 5 June 2009; Accepted 5 August 2009
Recommended by Torsten Dau
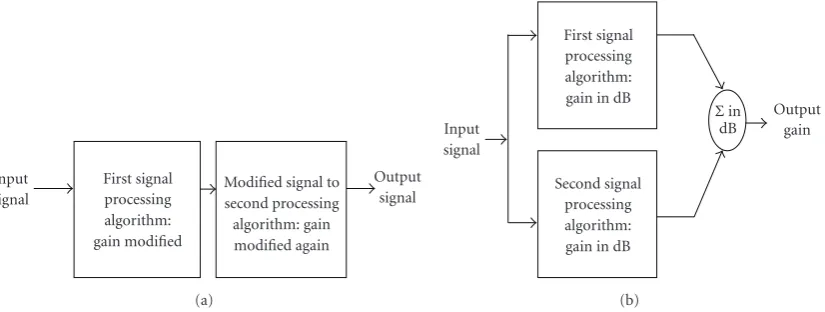
Temporal envelope (TE) cues provide a great deal of speech information. This paper explores how spectral subtraction and dynamic-range compression gain modifications affect TE fluctuations for parallel and series configurations. In parallel processing, algorithms compute gains based on the same input signal, and the gains in dB are summed. In series processing, output from the first algorithm forms the input to the second algorithm. Acoustic measurements show that the parallel arrangement produces more gain fluctuations, introducing more changes to the TE than the series configurations. Intelligibility tests for normal-hearing (NH) and hearing-impaired (HI) listeners show (1) parallel processing gives significantly poorer speech understanding than an unprocessed (UNP) signal and the series arrangement and (2) series processing and UNP yield similar results. Speech quality tests show that UNP is preferred to both parallel and series arrangements, although spectral subtraction is the most preferred. No significant differences exist in sound quality between the series and parallel arrangements, or between the NH group and the HI group. These results indicate that gain modifications affect intelligibility and sound quality differently. Listeners appear to have a higher tolerance for gain modifications with regard to intelligibility, while judgments for sound quality appear to be more affected by smaller amounts of gain modification.
Copyright © 2009 Melinda C. Anderson et al. This is an open access article distributed under the Creative Commons Attribution License, which permits unrestricted use, distribution, and reproduction in any medium, provided the original work is properly cited.
1. Introduction
Many of the 31.5 million Americans with hearing loss are candidates for hearing aids [1]. While recent clinical trials document the benefit of hearing aids (e.g., [2]), only 20– 40% of individuals who are candidates actually own them [1,3]. Approximately 65–75% of those who wear hearing aids are satisfied with their instruments [1,3]. Results of Kochkin [1,4] indicate that much of the potential market for hearing aids is not being reached, and that those who are users of hearing aids are not completely satisfied with their instruments.
Numerous factors contribute to the lack of satisfaction, some related to speech intelligibility and sound quality. Of the several factors that Kochkin [4] identified as being strongly correlated to overall customer satisfaction, three are related to sound quality: “clarity of sound,” “natural sound-ing,” and “richness or fidelity of sound.” Four others are
related to speech intelligibility, including “overall benefit,” “ability to hear in small groups,” “one-on-one conversation,” and “listening to TV.” Many of these factors relate to listening in the presence of background noise. Hearing aid signal processing algorithms attempt to improve intelligibility and/ or quality in noisy speech by reducing the amount of noise or increasing the audibility of low level speech sounds through modifications to the temporal envelope. Often, however, listeners fail to benefit from these signal processing algorithms when compared to simple linear processing, where the only signal modification is amplification (e.g., [2,5–8]).
Modified signal to second processing algorithm: gain modified again First signal
processing algorithm: gain modified Input
signal
Output signal
(a)
First signal processing algorithm: gain in dB
Second signal processing algorithm: gain in dB Input
signal
Output gain Σin
dB
(b)
Figure1: Block diagrams depicting (a) series and (b) parallel processing.
or undesirable background noise. Unexpected modifications to the temporal envelope may result from interactions of multiple concurrent nonlinear signal processing algorithms, and may have unintended perceptual consequences. These interactions may play a determining role in an individual’s satisfaction with hearing aids. When implementing different signal processing algorithms in commercial hearing aids, manufacturers strive to provide the best speech intelli-gibility and sound quality. Although there is conflicting evidence regarding the benefit of many of these signal processing algorithms, they are often included in commer-cial hearing aids because they appear to benefit at least some listeners with hearing loss in some environments (e.g., [5,8–13]).
Dynamic range compression is used in most commercial hearing aids in an attempt to restore the audibility to a range of sounds by providing more amplification for low-level portions of the signal than high-low-level portions, and to normalize the loudness for hearing-impaired listeners [9]. Compression, however, does not always result in benefit for speech intelligibility or for speech quality (e.g., [2, 6, 7, 13]). In a review of the compression literature, Souza [9] cites evidence showing that dynamic range compression algorithms improve intelligibility for low-level speech sounds in quiet, but intelligibility is similar to a linear system in the presence of background noise. For example, Shi and Doherty [12] found compression improved speech intelligibility for soft levels (60 dB SPL) in quiet and in reverberation although judgments of clarity were similar between compressed and linear speech. The compression advantage appears to be found when audibility is a factor for low-level speech sounds. When in background noise, both low-level speech signals, as well as low-level noise, are affected by the compression algorithm. The lack of benefit in background noise may be due to a limited effective compression ratio and an increase in signal-to-noise ratio (SNR) when background noise is present [14].
In contrast to compression, spectral subtraction has the goal of decreasing the amplitude of low-level portions of the signal that are presumably noise in an attempt to provide a cleaner speech signal. Spectral subtraction involves
estimation of the power spectrum of the assumed noise, followed by the removal of the noise spectrum from the noisy speech. This process is implemented in multiple channels and will adaptively reduce the gain in each channel in response to the noise estimate.
Both of these signal processing routines operate by altering the temporal envelope in an attempt to enhance audibility of the speech signal and improve speech intel-ligibility and quality. The temporal envelope is important for speech understanding because it carries cues for voicing, manner of articulation, and prosody [15]. A consequence of dynamic range compression is a reduction of the peak-to-valley ratio of the temporal envelope, which may result in a degradation of speech cues due to smoothing of the envelope. Spectral subtraction, in contrast, may reduce the amplitude of low-level speech sounds, which also has the potential to disrupt speech identification cues by reducing audibility of the low-level portions of speech that may be contained in the valleys of the signal. In addition to envelope manipulations, the processing may also introduce unintended distortion and spectral modifications (e.g., [14,16–18]). These signal manipulations, which are intended to improve audibility, may actually reduce or alter the speech information available to the listener.
Parallel processing is expected to produce greater gain fluctuations than series processing when dynamic range compression and spectral subtraction are implemented together. These fluctuations would have an increased effect on the slowly varying portion of the temporal envelope. In series processing, the spectral subtraction routine reduces gain in noisy bands, providing an input to the compression routine that has been significantly reduced. This, in turn, causes the compression routine to increase the amount of gain given to the signal. The increased gain given by the compression algorithm can neutralize the spectral subtraction routine and provide minimal gain modification to the final output. By comparison, parallel processing for the same input will allow for greater gain modifications because the compression routine is acting on the more intense bands of the original signal that have not been affected by spectral subtraction. As a result, there are smaller gain increases from the compression algorithm, allowing the spectral subtraction algorithm to have more influence. The increased effects of the noise reduction would cause greater fluctuations in the gain prescription for parallel processing. Although the algorithms used to calculate gain modifications are the same for both arrangements, the combinations may differ in their final acoustic characteristics and perceptual consequences. This paper focuses on the differences in gain variation over the short-time spectrum of the signal, controlling for possible differences in the long-term spectrum caused by the signal processing algorithms and their interactions.
Given the potential for differences between parallel and series arrangements, there is surprisingly little published literature regarding this topic. Franck et al. [19] reported results from a study that investigated signal processing interactions using two types of signal processing strategies, dynamic range compression and spectral enhancement. When used by itself, the spectral enhancement scheme was found to improve vowel perception, but not consonant perception. The addition of single-channel compression did not alter speech intelligibility. When multichannel com-pression was combined with spectral enhancement, speech intelligibility decreased significantly. The authors speculated that this may be because the addition of multichannel compression alters the temporal components beyond a level that is beneficial for the listeners. A threshold may exist where signal processing modifications to the acoustic signal are minimal enough to not degrade the signal and still provide benefit, but that point is likely to differ for each individual. The authors point to the fact that different results may be found if multichannel compression was implemented before spectral enhancement, as this order difference would alter the acoustic content at the output.
Chung [20] compared the acoustic and perceptual dif-ferences between series and parallel algorithm construction in commercial hearing aids using measures of noise reduc-tion effectiveness, speech intelligibility, and sound quality. Manufacturer-specific forms of dynamic range compression and noise reduction were used in the experiments, although the noise reduction schemes were all based on analysis of the modulation of the signal. Even though Chung did not control for the type of compression and noise reduction
used, the results showed perceptual and acoustic effects for different algorithm arrangements. The acoustic differences were evaluated by recording the outputs of the hearing aids on KEMAR at SNRs of 10, 5, 0, and −5 dB using lists from the Hearing-In-Noise Test (HINT) [21] with speech spectrum noise and white noise. The aids were set to linear or 3:1 compression, both with and without noise reduction. The noise reduction algorithms were set using the fitting software associated with each hearing aid manufacturer. Noise levels were measured with the noise reduction on and the noise reduction off at predetermined points between sentences after gain modifications were thought to have settled. The metric of noise reduction effectiveness was then quantified in terms of the difference in the level of the noise between the noise reduction off condition and the noise reduction on conditions. Analyses of the acoustic measures for the series constructions indicate that when compression was activated after noise reduction, the effects of noise reduction were reduced. The parallel constructions were found to have equivalent or increased noise reduction when the compression scheme was activated. Because Chung used manufacturer-specific forms of signal processing, some of the algorithm arrangements were speculated to be either serial or parallel, but were not definitely known. Even with this limitation, the acoustic measures were consistent with the idea that series and parallel constructions will result in different acoustical outcomes.
In addition to acoustic measures, Chung also performed perceptual measures of speech intelligibility and sound quality for two different hearing aids. The hearing aids were from different manufacturers and one utilized a parallel construction, while the second utilized a series construction. The stimuli were recorded on KEMAR using HINT lists in four conditions: linear with noise reduction on and noise reduction off, and 3:1 compression with noise reduction on and noise reduction off. The prerecorded stimuli were played monaurally to normal-hearing listeners. Intelligibility was measured in terms of percent of words correctly identified in one sentence list for each of the eight conditions (2 hearing aids x 4 conditions). Sound quality was measured by a paired comparison task of nine conditions using six sentences from the intelligibility experiment. The conditions included comparisons of compression, noise reduction, and combi-nations of compression and noise reduction. No significant differences in intelligibility were observed between parallel and series constructions. In contrast, listeners gave higher sound quality ratings to the parallel construction when both noise reduction and compression were implemented. It remains unclear, however, if the perceptual differences are due to the order of implementation (parallel or series) or because different brands of hearing aids were used.
This paper considers the gain fluctuations, and their sub-sequent envelope effects, for dynamic range compression and spectral subtraction in both parallel and series constructions. These algorithms were chosen because of their potential for divergent gain modifications, especially for low-level portions of the signal. It is known a priori that the parallel construction will have greater effects on the envelope of the signal, due to greater fluctuations in the gain prescriptions. In order to ensure maximum differences in the resulting gains, the compression and spectral subtraction parameters were the same in both parallel and series implementation. In addition, the long-term average speech spectrum was matched between the unprocessed signal and the processed signals, ensuring that the only audible difference between the configurations is the short-time envelope fluctuations due to gain functions. Differences between the two constructions were quantified using both acoustic and perceptual measures for listeners with normal hearing and listeners with hearing loss. The purpose of the study is to focus on one specific ele-ment of the differences between parallel and series (envelope effects resulting from gain fluctuations), which represents an initial step in examining the implementations currently used in hearing aid processing.
2. General Methods
2.1. Warped Filter Bank. Frequency warping has two key characteristics: it provides a frequency resolution very similar to that of the human auditory system and it reduces overall time delay compared to a fast Fourier transform (FFT) or linear-phase filter bank having comparable frequency resolution. Increasing the frequency resolution of the output requires a longer time to process the signal. Frequency warp-ing has a frequency-dependent variable delay, with lower frequencies having longer delays. These across-frequency differences in time delay have been shown to be inaudible for most listeners [22]. Each processing condition was implemented using the same system design. The sampling rate was 22.05 kHz. The filter bank was an extension of the warped compression filter bank [22]. This design utilized an FFT-based side-branch system for the frequency analysis, after which the desired gain versus frequency response was transferred to an equivalent warped FIR filter. The input signal was then convolved with the filter to produce the output. The resolution of the frequency analysis performed in the side branch is limited by the size of the warped FFT and its associated buffer. In this study, the warped filter cascade had 33 first-order all-pass filter sections, and a 34-point FFT was used to give 18 frequency analysis bands from 0 to 22.05 kHz. The compression gains were determined in the frequency domain, transformed into an equivalent warped time-domain filter, and the input signal was then convolved with the time-varying gain. The gain filter was updated every 24 samples (1.09 ms). Forcing the filter coefficients to have even symmetry yields a fixed frequency-dependent group delay, in which the filter delay is independent of the coefficients as long as the symmetry is preserved. The warped filter coefficient symmetry works just like the symmetry in a linear-phase FIR filter. A linear-phase filter has a
constant time delay at all frequencies no matter what filter coefficients are chosen. The symmetric warped filter has a group delay that is invariant with the selection of symmetric filter coefficients. The phase relationship between the filter output and its input at every frequency remains constant over time no matter how the magnitude frequency response varies, and ensures that no phase modulation occurs as the gain changes in response to the incoming signal. The warped frequency scale provides frequency resolution similar to that of the human auditory system, with each warped FFT bin approximately 1.33 critical bands wide. The center frequencies of the eighteen frequency bands are 0, 140, 282, 429, 583, 748, 929, 1129, 1358, 1625, 1946, 2345, 2860, 3555, 4541, 6001, 8168, and 11025 Hz.
2.2. Dynamic Range Compression. This study employs a dynamic range compression system using the frequency warping filter bank described earlier [22]. The specific characteristics of the compression algorithm include a compression ration of 2:1 in all bands, a lower compression kneepoint set at 45 dB SPL, infinite compression for sounds over 100 dB SPL, attack times of 5 ms, and release times of 70 ms [23]. The choice of compression ratio and kneepoint results in a maximum of 12 dB of compression gain. The compressor has a fast response to increases in signal level, due to the need to limit the intensity of the signal. The slower response to a decrease in signal level is an attempt to smooth gain perturbations. An envelope detector determines the intensity of the signal and forms the input to the compressor [24]. The envelope detector, in this case a peak detector, uses the fast attack time (5 ms) for tracking increases in signal level and the slower release time (70 ms) for tracking decreases in signal level. When the signal level increases above the previous peak detector output, the new peak detector output mixes in a large amount of the input absolute value and rises rapidly toward the new level. When the input is smaller then the previous peak detector output the new peak detector output decays at a constant rate in dB/sec.
NAL-R for HI group
Spectrum equalization
Spectral subtraction Compression Unprocessed (UNP)
Compression
Parallel
Series Spectral subtraction
Input to warp
filter bank
Input to warp
filter bank
Input to warp
filter bank
Input to warp
filter bank
Input to warp
filter bank Compression
Spectral subtraction
Spectral subtraction
gain in dB
Compression
gain in dB
Spectrum equalization
Spectrum equalization dB gain
summed
Spectrum equalization NAL-R
for HI group
NAL-R for HI group
NAL-R for HI group
NAL-R for HI group
Figure2: Block diagrams depicting the five processing conditions showing each stage of processing.
the spectral subtraction algorithm, the noise estimate was computed from the noise signal alone before the speech and noise were combined.
The spectral subtraction algorithm used here was chosen because it is less likely to introduce unwanted distortions, such as musical noise and gain-modulation effects because it only affects perceptually audible portions of the spectrum, rather then the entire signal. Furthermore, the gain remains constant at poor SNRs, rather than continuously decreasing. Signals that are judged to be noise will receive a constant attenuation, with little fluctuation. Tsoukalas et al. [25] showed improved speech intelligibility and sound quality for normal-hearing listeners in stationary noise. Employing a similar algorithm, Arehart et al. [10] reported significant intelligibility benefit in communication-channel noise, and sound quality benefit in both communication-channel noise and highway noise for listeners with normal hearing and listeners with hearing loss.
2.4. Experimental Configurations. This study included five processing conditions. (An additional condition, series backward was included in the data collection. In this condition, the compression output formed the input to the spectral subtraction routine. This condition would be unlikely to be used in a real-world setting because the use of compression prior to spectral subtraction will alter the physical waveform of the input and decrease the effectiveness of the noise estimation. Because of this
the course of the signal. The compression and spectral subtraction algorithms were not individually optimized for each experimental condition, but were rather kept constant so direct comparisons between the processing conditions would be possible.
All signals were amplified for the listeners with hearing loss to compensate for reduced audibility of the signal. Cus-tom linear amplification using NAL-R [27] took place after all other signal processing was completed. The use of a linear amplification scheme allowed avoidance of signal distortion that can result from nonlinear amplification schemes, while still allowing for frequency-specific amplification.
2.5. Stimuli. Two different corpora were used in this study: two concatenated sentences from the HINT [21] were used in the acoustical analysis (Section 3) and the speech quality experiment (Section 4), and IEEE sentences [28] were used in the speech intelligibility experiment (Section 5). (The two HINT sentences were “The yellow pears taste good. The boy got into trouble.”)All stimuli were digitized at 44.1 kHz and were downsampled to 22.05 kHz to reduce computation time. The background noise was a speech-shaped stationary noise, presented at SNRs ranging from 6 to−6 dB. Since the overall intensity of the noisy speech was kept at a constant level, the speech intensity was incrementally reduced as the noise level increased.
3. Acoustic Analysis
The purpose of this section is to describe and understand the acoustic differences among the four processing conditions used for the gain modifications. We were primarily interested in the changes to the temporal envelope caused by the amount of gain fluctuation in each condition. We used three measures to do this: an audibility analysis, difference spectrograms, and gain versus time analysis.
Given the potential for the spectral subtraction routine to decrease the signal level below the level of audibility for listeners with hearing loss, an audibility analysis was conducted. Each of the four processing conditions with gain modifications was analyzed to look for differences in audibility. Figure 3 displays the total output at 6 dB SNR for each of the four processing conditions from all stages of processing (seeFigure 2), including the original signal level, gain modifications from the signal processing algorithms, long-term spectrum equalization, and NAL-R amplification. The hearing loss depicted is the average threshold for that frequency for all listeners in the HI group. Three bands were included in this analysis, a low frequency (band 5 with center frequency 583 Hz), a middle frequency (band 10 with center frequency 1625 Hz), and a high frequency (band 15 with a center frequency of 4541 Hz). The graphs in the left panels illustrate that compression has the most audibility, consistent with its intent. Also consistent with expectations, spectral subtraction has the least audibility, reducing the low-level portions of the signal. The right panels of Figure 3, depicting the series and parallel implementations, show very little difference in audibility. Some of the low-level sounds
in each condition were below the average impaired auditory threshold, especially in band 15, but are comparable between processing conditions.
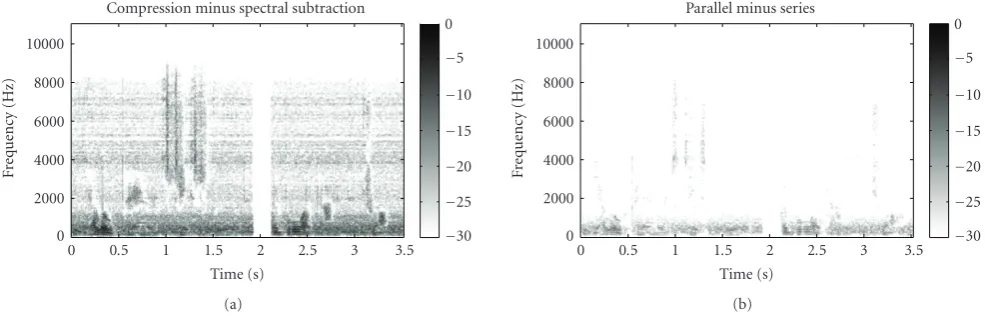
To explore the output variations among the processing conditions, difference spectrograms were derived to provide a visual representation of the changes caused by the signal processing conditions. Difference spectrograms, shown in Figure 4, subtract one processed condition from another, giving an absolute representation in dB of the difference between the outputs of the two processing conditions. In other words, the difference spectrograms depict the final envelope differences in the output that may be audible to a listener. The spectrograms were derived by normalizing the bin with the maximum difference to 0 dB (black shading) and then setting all smaller differences on a gray scale moving to −30 dB from maximum difference (white shading). The left panel in Figure 4 shows compression minus spectral subtraction, while the right panel shows parallel minus series, all at 6 dB SNR. The primary energy difference in both panels is below 2000 Hz, which is consistent with both the speech and the noise having a low-frequency concentration. The difference between the compression minus spectral subtraction spectrogram is due to the compression algorithm, since compression adds gain and spectral subtraction reduces gain. The difference in energy seen in the parallel minus series spectrogram may also be due to differences in the influence of the compression routine. The series condition has a less intense input to the compression algorithm because the signal has been reduced by the spectral subtraction algorithm. This less-intense signal input means that more gain would be applied from the compression algorithm, effectively neutralizing the impact of the spectral subtraction algorithm in the series condition.
Gain versus time functions were used to quantify the disparities in energy in the processed signals. The stimuli used in the audibility and spectrogram analysis were further scrutinized in order to determine the total amount of gain produced by each signal processing routine at 6 dB SNR. Figure 5shows the final amount of gain prescribed, including the long-term spectrum equalization gain and NAL-R for the listeners with hearing loss. Again, the fifth band, the tenth band, and the fifteenth band for compression, spectral subtraction, series, and parallel arrangements were analyzed.
0 1 2 3 Time (s)
0 20 40 60 80 100
Output
(dB
S
PL)
Audibility:
compression and spectral subtraction
Band 5, 6 dB SNR
(a)
0 1 2 3
Time (s) 0
20 40 60 80 100
Output
(dB
S
PL)
Audibility: series and parallel
Band 5, 6 dB SNR
(b)
0 1 2 3
Time (s) 0
20 40 60 80 100
Output
(dB
S
PL)
Band 10, 6 dB SNR
(c)
0 1 2 3
Time (s) 0
20 40 60 80 100
Output
(dB
S
PL)
Band 10, 6 dB SNR
(d)
0 1 2 3
Time (s) 0
20 40 60 80 100
Output
(dB
S
PL)
Band 15, 6 dB SNR
Compression output Spectral subtraction output Average HI threshold (dB SPL)
(e)
0 1 2 3
Time (s) 0
20 40 60 80 100
Output
(dB
S
PL)
Band 15, 6 dB SNR
Parallel output Series output
Average HI threshold (dB SPL)
(f)
0 0.5 1 1.5 2 2.5 3 3.5 Time (s)
0 2000 4000 6000 8000 10000
Fre
q
u
en
cy
(H
z)
Compression minus spectral subtraction
−30
−25
−20
−15
−10
−5 0
(a)
0 0.5 1 1.5 2 2.5 3 3.5
Time (s) 0
2000 4000 6000 8000 10000
Fre
q
u
en
cy
(H
z)
Parallel minus series
−30
−25
−20
−15
−10
−5 0
(b)
Figure 4: Difference spectrograms: (a) shows compression-spectral subtraction, and (b) shows series-parallel. Spectrograms depict difference in energy between the two contrasted processing conditions. For both (a) and (b), the primary region of difference is in the low frequencies, consistent with the fact that both the speech and noise have a low-frequency concentration. The spectrograms were derived by normalizing the bin with the maximum difference to 0 dB (black shading) and then setting all smaller differences on a gray scale moving to−30 dB from maximum difference (white shading).
4. Speech Intelligibility
The effects on speech intelligibility of different signal pro-cessing arrangements were quantified in both a group of listeners with normal hearing and a group of listeners with hearing loss.
4.1. Subjects. The speech intelligibility experiment included 14 listeners with normal hearing (NH) with an age range of 23–72 years old (average=45 years old) and 14 listeners with hearing loss (HI) with an age range of 55–79 years old (average=66 years old). All listeners underwent an audiometric evaluation at their initial visit. Listeners in the NH group had air conduction thresholds of 20 dB HL or better at octave frequencies from 250 to 8000 Hz, inclusive [29]. The listeners in the HI group had audiologic test results consistent with cochlear impairment: normal tympanometry, acoustic reflexes consistent with level of cochlear loss, and absence of air-bone gap exceeding 10 dB at any frequency. Listeners with hearing loss were required to have at least a mild loss. Some of the listeners in the HI group were hearing aid users, although there was no requirement that they be so.Table 1shows audiometric air conduction thresholds for the listeners in the HI group. All participants were recruited from the Boulder/Denver metro area and were native speakers of American English. For the perceptual listening tasks, subjects were tested monaurally and individually in a double-walled sound-treated booth. Listeners were compensated $10/hour for their participation.
4.2. Experimental Protocol. IEEE sentences (cf. section 2) were mixed with background noise at 5 levels (6, 3, 0,−3, and −6 dB SNR). The same five conditions presented in Figure 2, as well as a clean speech token (UNP speech with no background noise), were tested. Listeners participated in one hour of intelligibility testing. Each listener heard a random selection of 156 sentences of the possible 720
sentences that are included in the IEEE corpus. (Listeners were tested on an additional 30 sentences in the experimental intelligibility session. These sentences were processed using the series backward condition described in footnote 1. This condition was not included in the final data analysis.) Instructions given to listeners are included in the appendix.
The 156 sentences were divided into four blocks. The first block of sentences was a practice block consisting of one token from each condition, plus a clean speech token. Each subject then listened to the test sentences divided into three blocks. The processing conditions and SNRs were randomized and each block of trials contained all conditions of signal processing and SNRs. No feedback was given during testing. Percent correct scores were calculated by dividing the number of words correctly repeated by the total number of target words presented (25, 5 words per sentence x 5 repetitions).
The average playout level was 70 dB SPL, plus the additional linear amplification (NAL-R) for the listeners with hearing loss. The digitally stored speech stimuli were processed through a digital-to-analog converter (TDT RX8), an attenuator (TDT PA5), a headphone buffer amplifier (TDT HB7), and then presented monaurally to the listener’s test ear through a Sennheiser HD 25-1 earphone.
0 1 2 3 Time (s)
0 10 20 30
To
ta
l
ga
in
(d
B
)
Total gain:
compression and spectral subtraction
Band 5, 6 dB SNR
(a)
0 1 2 3
Time (s) 0
10 20 30
To
ta
l
ga
in
(d
B
)
Total gain: series and parallel
Band 5, 6 dB SNR
(b)
0 1 2 3
Time (s) 0
10 20 30
To
ta
l
ga
in
(d
B
)
Band 10, 6 dB SNR
(c)
0 1 2 3
Time (s) 0
10 20 30
To
ta
l
ga
in
(d
B
)
Band 10, 6 dB SNR
(d)
0 1 2 3
Time (s) 0
10 20 30
To
ta
l
ga
in
(d
B
)
Band 15, 6 dB SNR
Compression gain Spectral subtraction gain
(e)
0 1 2 3
Time (s) 0
10 20 30
To
ta
l
ga
in
(d
B
)
Band 15, 6 dB SNR
Parallel gain Series gain
(f)
Table1: Listener thresholds. Test ear is marked with an asterisk. I=intelligibility participant, Q=quality participant.
Subject Ear Sex Age 250 500 1000 2000 3000 4000 6000 8000 Experiment
HI 1 R F 79 35 40 50 45 45 55 50 60 I, Q
L∗ 30 40 45 45 45 45 45 75
HI 2 R∗ F 63 25 30 25 40 40 45 65 65 I, Q
L 25 30 25 35 30 45 60 60
HI 3 R∗ M 66 40 25 20 40 75 90 85 75 I, Q
L 35 25 15 25 70 85 80 75
HI 4 R F 69 20 25 30 35 40 50 40 35 I, Q
L∗ 20 30 30 35 35 50 40 50
HI 5 R∗ F 53 15 10 10 40 45 60 50 30 I, Q
L 15 5 15 45 — 35 30 25
HI 6 R∗ F 62 30 35 40 40 — 40 — 30 I
L 20 30 20 15 — 20 — 25
HI 7 R F 74 50 60 70 65 60 65 70 70 I
L∗ 50 55 55 55 55 60 65 70
HI 8 R F 70 50 35 30 35 40 35 40 45 I
L∗ 55 45 35 35 40 40 45 50
HI 9 R∗ F 55 20 30 50 60 70 75 — 65 I
L 20 25 60 70 65 70 — 55
HI 10 R∗ F 72 25 25 30 40 — 45 60 65 I
L 20 25 25 45 — 40 — 35
HI 11 R M 64 25 30 45 45 40 45 40 35 I
L∗ 15 25 40 45 40 50 50 45
HI 12 R∗ M 62 20 15 20 30 30 45 45 50 I
L NR NR NR NR NR NR NR NR
HI 13 R∗ M 60 15 20 35 50 50 50 30 10 I
L 30 15 20 40 55 50 40 20
HI 14 R∗ F 65 45 35 40 55 65 70 65 65 I
L 25 35 35 50 60 65 70 80
HI 15 R M 78 30 25 15 25 45 45 55 75 Q
L∗ 35 30 15 35 45 60 65 70
HI 16 R∗ F 75 25 25 35 40 25 45 65 60 Q
L 30 15 20 20 65 65 60 90
HI 17 R F 68 10 10 20 30 35 30 15 15 Q
L∗ 10 15 20 35 40 45 25 25
HI 18 R∗ M 74 30 35 75 85 75 80 75 70 Q
L 25 30 80 NR NR 110 NR NR
HI 19 R∗ F 57 10 15 20 20 35 50 55 60 Q
L 15 15 15 29 25 40 45 55
HI 20 R F 36 30 45 50 60 — 70 80 85 Q
L∗ 45 45 60 65 — 75 80 85
HI 21 R M 57 15 10 5 30 60 65 55 55 Q
L∗ 10 10 10 40 55 55 50 65
HI 22 R∗ F 82 45 35 30 25 30 45 50 55 Q
35 25 25 20 35 40 50 55
HI 23 R M 79 20 20 25 50 70 90 90 80 Q
−6 −3 0 3 6 SNR (dB) 0 20 40 60 80 100 P erce n t co rre ct (% ) Unprocessed (a)
−6 −3 0 3 6
SNR (dB) 0 20 40 60 80 100 P erce n t co rre ct (% ) Compression (b)
−6 −3 0 3 6
SNR (dB) 0 20 40 60 80 100 P erce n t co rre ct (% ) Spectral subtraction (c)
−6 −3 0 3 6
SNR (dB) 0 20 40 60 80 100 P erce n t co rre ct (% ) Parallel (d)
−6 −3 0 3 6
SNR (dB) 0 20 40 60 80 100 P erce n t co rre ct (% ) Series (e)
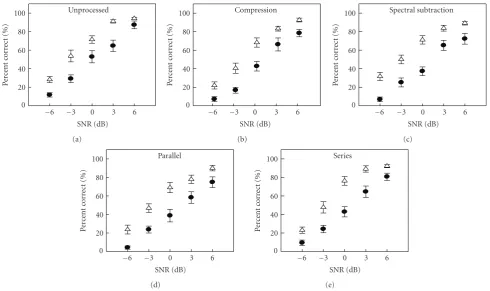
Figure6: Intelligibility scores (in percent correct) for listeners with normal hearing (open triangles) and listeners with hearing loss (closed circles) grouped by processing condition. Error bars represent the standard error.
For statistical analysis, the percent correct scores were subjected to an arcsine transform [30] and then submitted to a repeated measures analysis of variance (ANOVA) (Table 2). This analysis revealed that the factors of processing condition, SNR, and group were all statistically significant. None of the interaction terms were significant.
In order to explore more fully the data, post-hoc t -tests were completed using Bonferroni correction (P < .01). Thet-tests made individual comparisons between the UNP condition and each of the other four conditions. In addition, the series versus parallel data were compared to each other to see if the differences seen in the acoustic analysis resulted in differences in speech intelligibility. Examination of the raw data indicates that both groups of listeners showed the best performance in the UNP condition. Table 2 displays the results of the t-tests for UNP x compression, UNP x spectral subtraction, UNP x parallel, and UNP x series. All tests were significant for the factors of SNR and group, with the NH group outperforming the HI group and all scores improving as SNR improved. The t-tests showed that the factor of processing condition was significant in three of the four comparisons, with intelligibility significantly better in the UNP condition than in the compression, spectral subtraction, and parallel conditions. Interestingly, the factor of processing condition in the UNP x series comparison was not significant, indicating that there was no diff er-ence in intelligibility scores between these two processing conditions.
Finally, the parallel x series comparison was also found to be significant for the factors of processing condition, SNR, and group. In this case, listeners had better speech intelligibility with series processing. Consistent with the other comparisons, scores were better overall in the NH group and improved as SNR improved.
4.4. Discussion. The results from the intelligibility experi-ment show that speech understanding significantly differed based on processing condition. The UNP condition provided the best intelligibility, although series was not significantly worse than UNP. The listeners in the NH group consistently outperformed listeners in the HI group, although the performance trend for processing conditions is similar for both groups.
UNP comp ss par ser Processing condition 0
20 40 60 80 100
P
erce
n
t
co
rre
ct
(%
)
−6 dB SNR
(a)
UNP comp ss par ser Processing condition 0
20 40 60 80 100
P
erce
n
t
co
rre
ct
(%
)
−3 dB SNR
(b)
UNP comp ss par ser Processing condition 0
20 40 60 80 100
P
erce
n
t
co
rre
ct
(%
)
0 dB SNR
(c)
UNP comp ss par ser Processing condition 0
20 40 60 80 100
P
erce
n
t
co
rre
ct
(%
)
3 dB SNR
HI group NH group
(d)
UNP comp ss par ser Processing condition 0
20 40 60 80 100
P
erce
n
t
co
rre
ct
(%
)
6 dB SNR
HI group NH group
(e)
Figure7: Intelligibility scores (in percent correct) for listeners with normal hearing (open triangles) and listeners with hearing loss (closed circles) grouped by SNR. Error bars represent standard error. Conditions are UNP: unprocessed, comp: dynamic range compression, ss: spectral subtraction, par: parallel, and ser: series.
The decrease in speech intelligibility seen in the spectral subtraction condition may be due to decreased audibility. The acoustic analysis revealed that the spectral subtraction condition, while having a relatively flat amount of gain fluctuation, reduced the gain of the signal significantly. This gain reduction may have placed some speech information out of reach of the listeners, to the detriment of speech understanding.
Results from earlier research regarding the benefit of multiple algorithm implementations have been inconclusive. Franck et al. [19] showed improvements in vowel identifi-cation with spectral enhancement only, but that benefit was removed when multi-channel compression was added to the signal processing. The authors concluded that the increase in envelope distortion that occurred with the addition of com-pression may have negated any speech intelligibility benefit. Our findings are similar in that listeners’ intelligibility scores were degraded compared to the unprocessed signal when multiple algorithms were implemented in parallel. However, intelligibility scores were also degraded when each algorithm was implemented in isolation. When compared to the series condition, an increased amount of gain fluctuation for both compression and parallel processing may be responsible for the reduced intelligibility scores. It is possible that the amount of manipulation present in series is below
a threshold of performance degradation, while the other processing conditions are above that threshold. Chung [20] did not find significant differences for intelligibility between the parallel and series constructions, although the fact that the signal processing algorithms were not controlled limits the comparisons that can be made.
In examination of the spectral subtraction routine, the present findings differ from those of Arehart et al. [10], who showed that listeners with normal hearing and listeners with hearing loss had improved speech intelligibility with spectral subtraction for nonsense syllable stimuli in a communication-channel background noise. In contrast, we found that sentence understanding decreased with a similar spectral subtraction algorithm. The lack of benefit seen in the current study may be due to the fact that a different form of spectral subtraction was implemented, along with differences in the speech materials for the speech in noise test.
Table2: Results of repeated measures ANOVA for intelligibility scores. Statistical significance (marked with an∗) isP<.01 due to Bonferroni correction.
Intelligibility statistics
Factor F Df P
Processing condition (pc): omnibus 9.079 4, 104 <.000∗
SNR 382.139 4, 104 <.000∗
group 24.821 1, 26 <.000∗
pc×SNR 1.489 16, 416 .15
pc×group .758 4, 104 .545
SNR×group 3.903 4, 104 .018
pc×SNR×group 1.315 16, 416 .227
pc: UNP×compression 22.4 1, 26 <.000∗
SNR 229.752 4, 104 <.000∗
group 22.152 1, 26 <.000∗
pc×SNR .523 4, 104 .719
pc×group .001 1, 26 .973
SNR×group 1.758 4, 104 .172
pc x SNR×group 2.469 4, 104 .061
pc: UNP×spectral subtraction 27.440 1, 26 <.000∗
SNR 194.649 4, 104 <.000∗
group 23.276 1, 26 <.000∗
pc×SNR 3.073 4, 104 .039
pc×group 2.148 1, 26 .155
SNR×group 2 4, 104 .113
pc×SNR×group 2.595 4, 104 .066
pc: UNP×parallel 29.453 1, 26 <.000∗
SNR 173.615 4, 104 <.000∗
group 19.224 1, 26 <.000∗
pc×SNR 1.119 4, 104 .346
pc×group .320 1, 26 .576
SNR×group 1.72 4, 104 .165
pc×SNR×group 2.246 4, 104 .091
pc: UNP×series 3.595 1, 26 .069
SNR 205.037 4, 104 <.000∗
group 25.121 1, 26 <.000∗
pc×SNR .431 4, 104 .751
pc×group 1.493 1, 26 .233
SNR×group 4.714 4, 104 .003∗
pc×SNR×group 1.393 4, 104 .248
pc: parallel×series 7.974 1, 26 .009∗
SNR 207.505 4, 104 <.000∗
group 22.096 1, 26 <.000∗
pc×SNR 1.402 4, 104 .245
pc×group .476 1, 26 .496
SNR×group 3.827 4, 104 .013
pc×SNR×group .778 4, 104 .522
Dynamic range compression has a history of reducing intelligibility (e.g., [9]), and our findings are no different. The most beneficial environment for compression is soft speech with no background noise, where there is an increase in audibility of the low-level portions of speech. Our results are consistent with other studies that show that compression
envelopes become more similar due common gain fluctua-tions, and results in Across Source Modulation Correlation (ASMC). The ASMC makes it more difficult for a listener to perceptually segregate the two auditory objects, especially for listeners who rely on envelope cues for speech intelligibility.
A second factor, alterations to the temporal envelope through gain fluctuations, may have also contributed to the decrease in speech intelligibility. In the acoustic analysis, it was found that the compression algorithm and parameters used here caused the gain to fluctuate over time. This fluctuation may have altered the speech envelope beyond a threshold of benefit, and instead caused a decrease in speech intelligibility.
An important acknowledgement is that while the intel-ligibility scores between series and parallel processing are significantly different, the magnitude of the difference is small, on average 5 percentage points (range: 0–11 per-centage points). This experiment was designed to maximize the potential benefit of the spectral subtraction routine by performing the noise estimate of the noise signal before the speech was added, ensuring an optimized noise estimate. In addition, the use of a stationary speech-shaped noise is most suited to a spectral subtraction scheme because the statistics of the noise do not change over time. By controlling these parameters, we were in the best possible situation for determining the differences between series and parallel processing. In a real-world environment, where there is an imperfect noise estimate and fluctuating background, it is possible that these differences would be smaller.
5. Speech Quality
The effects on sound quality of different signal processing arrangements were quantified in both an NH group and an HI group.
5.1. Subjects. The participants in the speech quality exper-iment included 12 listeners with normal hearing (average age=33 years old; range=19–64 years old) and 14 listeners with hearing loss (average age=66 years old; range=36–79 years old). Of these, five were participants in the intelligibility testing. Not all participants in the intelligibility study were available for participation in the quality experiment, so additional subjects were recruited. Audiometric thresholds for the HI group are displayed in Table 1. The same audiometric standards required for participation in the intelligibility experiment were required for enrollment in the quality experiment, and some, but not all, of the HI listeners were hearing aid users. All subjects were tested monaurally and individually in a double-walled sound-treated booth. Listeners were compensated $10/hour for their participation.
5.2. Experimental Procedures. Sound quality judgments were made using a paired comparison task. Instructions for the listeners are included in Appendix. Two HINT sentences (cf. Section 2) were mixed with the background noise at 6, 3, and 0 dB SNR. Because poor intelligibility can dominate sound quality judgments, the SNR was restricted to regions where
intelligibility was expected to be above 75% for listeners with normal hearing and above 40% for listeners with hearing loss [32]. Listeners judged 225 pairs of stimuli from the final processing conditions over two one-hour visits. Fifteen conditions (3 SNRs X 5 processing conditions) were all paired together (15 x 15 matrix). (Listeners were tested on an additional 99 trials in the experimental quality sessions. These sentences were processed using the series backward condition described in footnote 1. This condition was not included in the final data analysis.) Listeners heard each possible combination twice. Each visit entailed four blocks of paired comparison testing. The first block was 30 practice trials, not scored. The 255 final test trials were divided over 6 blocks, 3 each visit. Each trial was randomized with regard to conditions tested, but no limitation was placed on order of presentation. Play-out method was the same as for intelligibility.
5.3. Results. The paired comparison judgments were reduced to a preference score [33–35] ranging from 0 to 1. Preference scores were calculated by summing the total number of times a given condition was preferred to the other seventeen conditions, and then dividing by the total number of comparisons for the given condition. Table 3 presents the number of times each condition was preferred, with the NH group displayed in the top panel and the HI group displayed in the bottom panel. The number of comparisons for the preference score calculations was 360 for the NH group (12 subjects x 15 conditions x 2 repetitions) and 420 for the HI group (14 subjects x 15 conditions x 2 repetitions). The preference scores are listed in the bottom rows of the two panels ofTable 3.
Figure 8displays the results of the preference scores, with each panel representing a different processing condition. As with intelligibility, as SNR improves the preference scores increased.Figure 9shows preference scores with each panel showing a different SNR. Spectral subtraction is the most preferred processing condition, with compression the least preferred.
The preference scores were arcsine transformed [30] and analyzed using repeated measures ANOVA (Table 4). The factors of processing condition and SNR were significant. The interaction between processing condition and SNR was also significant, indicating the change in preference for a given processing condition was dependent on SNR. No significant difference was found between listener groups.
Table3: Preferences for processing conditions. The NH group is represented in the top panel, with the HI group represented in the bottom panel. UNP=unprocessed, com=compression, ss=spectral subtraction, par=parallel, and ser=series.
(a)
NH Grp UNP 6 com 6 ss 6 par 6 ser 6 UNP 3 com 3 ss 3 par 3 ser 3 UNP 0 com 0 ss 0 par 0 ser 0
UNP 6 12 4 18 11 10 1 1 9 2 1 0 0 0 1 0
com 6 20 12 21 18 22 14 3 18 10 13 5 2 2 2 1
ss 6 6 3 12 2 1 3 2 4 0 0 1 2 0 1 1
par 6 13 6 22 12 11 6 1 7 4 4 3 0 1 2 0
ser 6 14 2 23 13 12 4 3 12 2 0 2 0 1 0 2
UNP 3 23 10 21 18 20 12 3 16 8 9 5 0 6 2 5
com 3 23 21 22 23 21 21 12 20 17 17 15 6 13 11 8
ss 3 15 6 20 17 12 8 4 12 9 4 3 2 4 1 1
par 3 22 14 24 20 22 16 7 15 12 12 7 4 4 3 3
ser 3 23 11 24 20 24 15 7 20 12 12 3 3 6 0 4
UNP 0 24 19 23 21 22 19 9 21 17 21 12 3 16 8 8
com 0 24 22 22 24 24 24 18 22 20 21 21 12 20 17 19
ss 0 24 22 24 23 23 18 11 20 20 18 8 4 12 7 10
par 0 23 22 23 22 24 22 13 23 21 24 16 7 17 12 16
ser 0 24 23 23 24 22 19 16 23 21 20 16 5 14 8 12
total 290 197 322 268 270 202 110 242 175 176 117 50 116 75 90
pref 0.806 0.547 0.894 0.744 0.750 0.561 0.306 0.672 0.486 0.489 0.325 0.139 0.322 0.208 0.250
(b)
HI Grp UNP 6 com 6 ss 6 par 6 ser 6 UNP 3 com 3 ss 3 par 3 ser 3 UNP 0 com 0 ss 0 par 0 ser 0
UNP 6 14 5 22 17 17 7 3 10 3 0 3 3 4 2 1
com 6 23 14 24 21 24 17 6 16 12 7 3 1 4 2 4
ss 6 6 4 14 9 8 1 2 3 3 2 2 1 1 0 1
par 6 11 7 19 14 12 7 2 13 6 5 3 3 6 1 2
ser 6 11 4 20 16 14 10 3 8 0 5 4 4 2 1 3
UNP 3 21 11 27 21 18 14 2 19 7 13 7 3 5 4 3
com 3 25 22 26 26 25 26 14 24 21 20 10 3 16 7 8
ss 3 18 12 25 15 20 9 4 14 7 4 2 2 3 0 3
par 3 25 16 25 22 28 21 7 21 14 14 7 2 7 1 1
ser 3 28 21 26 23 23 15 8 24 14 14 4 1 5 3 4
UNP 0 25 25 26 25 24 21 18 26 21 24 14 6 22 11 8
com 0 25 27 27 25 24 25 25 26 26 27 22 14 22 20 17
ss 0 24 24 27 22 26 23 12 25 21 23 6 6 14 7 9
par 0 26 26 28 27 27 24 21 28 27 25 17 8 21 14 17
ser 0 27 24 27 26 25 25 20 25 27 24 20 11 19 11 14
total 309 242 363 309 315 245 147 282 209 207 124 68 151 84 95
pref 0.736 0.576 0.864 0.736 0.750 0.583 0.350 0.671 0.498 0.493 0.295 0.162 0.360 0.200 0.226
preference for spectral subtraction processing increased as SNR decreased. For each of the other post-hoc comparisons, the UNP condition was the significantly preferred condition. In the analysis comparing parallel to series processing, there was no significant difference in processing condition. No between-group differences were found for any of the post-hoc comparisons, indicating that both the NH and HI group gave similar paired comparison judgments.
5.4. Discussion. In contrast to the intelligibility results, the sound quality results show listeners have a definite preference for spectral subtraction when listening in noise,
with UNP ranked second. For all processing conditions, preference scores decreased monotonically as SNR decreased. There was no between-group difference, indicating that both the normal-hearing group and the hearing-impaired group showed similar preference judgments.
0 3 6 SNR (dB) 0 0.2 0.4 0.6 0.8 1 P refer enc e sc or e Unprocessed (a)
0 3 6
SNR (dB) 0 0.2 0.4 0.6 0.8 1 P refer enc e sc or e Compression (b)
0 3 6
SNR (dB) 0 0.2 0.4 0.6 0.8 1 P refer enc e sc or e Spectral subtraction (c)
0 3 6
SNR (dB) 0 0.2 0.4 0.6 0.8 1 P refer enc e sc or e Parallel HI group NH group (d)
0 3 6
SNR (dB) 0 0.2 0.4 0.6 0.8 1 P refer enc e sc or e Series HI group NH group (e)
Figure8: Subject preference scores (proportion of times a processing condition was preferred to all other processing conditions) for listeners with normal hearing (open triangles) and listeners with hearing loss (closed circles) grouped by processing condition. Error bars show the standard error of the preference scores for each group and condition. Symbols and error bars are offset slightly for clarity.
UNP comp ss par ser Processing condition 0 0.2 0.4 0.6 0.8 1 P refer enc e sc or e
0 dB SNR
HI group NH group
(a)
UNP comp ss par ser Processing condition 0 0.2 0.4 0.6 0.8 1 P refer enc e sc or e
3 dB SNR
HI group NH group
(b)
UNP comp ss par ser Processing condition 0 0.2 0.4 0.6 0.8 1 P refer enc e sc or e
6 dB SNR
HI group NH group
(c)
Figure9: Subject preference scores for sound quality judgments grouped by SNR for listeners with normal hearing (closed triangles) and listeners with hearing loss (open circles). Error bars show the standard error of the preference scores for each group and condition. Symbols and error bars are offset slightly for clarity. Conditions are UNP: unprocessed, comp: dynamic range compression, ss: spectral subtraction, par: parallel, and ser: series.
Although it is likely that intelligibility is a primary factor in the sound quality judgments [32], the fact that both groups of listeners preferred the spectral subtraction routine may indicate that intelligibility is not the only factor. The sound
Table4: Results of repeated measures ANOVA for quality scores. Statistical significance (marked with an∗) isP<.01 due to Bonferroni correction.
Quality statistics
Factor F df P
processing condition (pc): omnibus 58.653 4, 96 <.000∗
snr 274.568 2, 48 <.000∗
group .571 1, 24 .457
pc×snr 12.211 8, 192 <.000∗
pc×group .380 4, 96 .669
snr×group .343 2, 48 .586
pc×snr×group .955 8, 192 .459
pc: UNP×compression 161.218 1, 24 <.000∗
snr 195.952 2, 48 <.000∗
group .012 1, 24 .914
pc×snr 5,448 2, 48 .008∗
pc×group 2.492 1, 24 .128
snr×group .562 2, 48 .574
pc×snr×group .828 2, 48 .443
pc: UNP×spectral subtraction 13.105 1, 24 .001∗
snr 190.315 2, 48 <.000∗
group .497 1, 24 .488
pc×snr 21.895 2, 48 <.000∗
pc×group .241 1, 24 .628
snr×group 1.164 2, 48 .3
pc×snr×group .304 2, 48 .727
pc: UNP×parallel 13.137 1, 24 .001∗
snr 226.11 2, 48 <.000∗
group .711 1, 24 .408
pc×snr 2.733 2, 48 .077
pc×group .77 1, 24 .389
snr×group .608 2, 48 .489
pc×snr×group .764 2, 48 .467
pc: UNP×series 9.494 1, 24 .005∗
snr 214.211 2, 48 <.000∗
group 1.553 1, 24 .225
pc×snr 1.182 2, 48 .315
pc×group .437 1, 24 .515
snr×group .216 2, 48 .702
pc×snr×group 1.462 2, 48 .242
pc: parallel×series 4.294 1, 24 .049
snr 271.273 2, 48 <.000∗
group .010 1, 24 .922
pc×snr .433 2, 48 .635
pc×group .437 1, 24 .515
snr×group .036 2, 48 .89
pc×snr×group .347 2, 48 .691
of noise reduction that was seen when spectral subtraction was implemented by itself by introducing more noticeable effects on the speech itself, and removing the quality benefit seen when spectral subtraction is implemented by itself. This lack of benefit may be due to an increased amount of noise in the signal. Additionally, the mixing of the compression and
spectral subtraction algorithm may have altered important speech cues through spectral modifications (e.g., [14,16– 18]).
(e.g., [35, 36]). For example, Arehart et al. [35] found significant differences between a group of normal-hearing listeners and a group of hearing-impaired listeners for several different distortion conditions including additive noise, peak clipping, and center clipping. Generally, the listeners with hearing loss showed lower preference scores for additive noise and peak clipping, but increased preference for center clipping, which relates to noise reduction processing by removing low-intensity portions of the signal. The lack of difference between groups reported here may in part be due to the fact that background noise was present in each of our processing conditions, which may mask some of the degradations to the speech signal by the signal processing.
6. General Discussion and Summary
In these experiments, several different signal processing configurations were tested using both acoustic and percep-tual measures in order to quantify the impact that gain fluctuations due to different signal processing arrangements may have on a listener’s perception of speech intelligibility and speech quality. Of particular interest were possible differences between series and parallel algorithm arrange-ments. Both types of arrangements are used in commercially available hearing aids, but there is a lack of literature regarding the acoustic and perceptual differences between the arrangements. Given the increased complexity of sig-nal processing in today’s hearing aids, it is important to understand how these different arrangements may affect the acoustic output of a hearing aid, and subsequently a listener’s perception. A fundamental difference between the two algorithm arrangements is the difference in modification made to the signal. In order to isolate this factor, the parameters for compression and spectral subtraction were kept the same for both arrangements. In addition, the long-term spectrum of the processed signals was matched to that of the original speech to remove loudness as a potential confound. By controlling these factors, this study presents an initial step in identifying the acous-tic and perceptual consequences of series versus parallel processing.
The acoustic analyses showed that parallel processing has greater gain fluctuations than series processing, although audibility is comparable. This difference is due to the influence of the spectral subtraction algorithm, which has more of an effect in the parallel condition. The overall impact on the acoustic output by the signal processing constructions is to alter the amplitude of low-level portions of the signal and change the temporal envelope of the signal, with the parallel processing typically showing more gain reductions than series processing.
Speech understanding was best with no processing to the signal other than NAL-R, although series processing was not significantly worse. Speech intelligibility was signif-icantly poorer with parallel processing compared to series processing. The worst speech intelligibility scores were found with the compression condition. Listeners with normal hearing consistently had higher speech intelligibility scores
than listeners with hearing loss, although the pattern across processing conditions was similar. The acoustic changes resulting from the increased signal processing, and increased gain fluctuations, may alter important speech understanding cues [37], and thus decrease speech intelligibility.
Paired-comparison sound quality judgments revealed that listeners significantly preferred spectral subtraction processing to the unprocessed condition. Parallel and series processing were both significantly less preferred than the unprocessed signal. Compression was the least preferred signal processing condition, possibly due to the fact that the intensity of the background noise was also increased when low-level portions of the speech were amplified. There was no difference between listener groups, indicating that both listeners with normal hearing and listeners with hearing loss respond to these signal processing arrangements in similar ways.
The compression condition consistently yielded the lowest intelligibility scores and the lowest quality scores. The compression algorithm implemented here did not match the compression parameters to each subject’s audiogram. Such matching may have yielded different perceptual results. However, the trends observed here for the compression condition are consistent with other reports of the effects of compression on speech intelligibility and quality for noisy speech at average conversational levels (e.g., [5–9]). If a different number of bands were used for the compression and spectral subtraction algorithms, the potential remains that there would be different acoustic and perceptual consequences. Additionally, the compression and spectral subtraction algorithm parameters were the same for both series and parallel processing. In a real-world setting, the parameter settings would likely be optimized for the par-ticular algorithm arrangement chosen. The results from this study indicate that the optimization should take the form of reducing the amount of spectral modifications to the signal due to fluctuating gain.
Appendices
A. Intelligibility Instructions
Instructions read to the listener for the intelligibility task were as follows: “In this experiment you will be listening to sentences that have been digitally processed and are in the presence of background noise. To begin sentence playout please click on the button marked PLAY. When the speaker has finished talking, please repeat back as much of the sentence as you understood. If you did not understand any of the words please say “I understood nothing”. To begin the next speech sample click PLAY. You will be given a break at the end of each block of trials. If you would like a break before the end of the block, do not click PLAY.”
B. Quality Instructions
Instructions read to the listener at each sound quality visit were as follows: “In this experiment you will be comparing speech samples that have been digitally processed. Your task is to decide which sample you think sounds better. In each trial you will listen to Sample A and Sample B. After listening to both samples, you will select which sample you think sounds better. At times you may find it relatively easy to decide which sample sounds better. Other times you may find it more difficult. In all cases we encourage you to take your best guess at whether Sample A or Sample B sounds better. To begin speech playout click on the button marked “Click to Continue”. The first speech sample (Sample A) will play followed by the second speech sample (Sample B). After the second sample has finished please click ona the speech sample you feel has the better sound quality, either “Sample A sounds better” or Sample B sounds better”. When you have made your selection and are ready for the next set of speech samples please click on the button marked “Proceed”.”
Acknowledgments
The work was supported by a research grant from GN Resound Corporation. The recording of the male talker speaking the IEEE corpus was kindly provided by Dr. Peggy Nelson of the University of Minnesota. We sincerely thank Ramesh Kumar Muralimanohar for his assistance in development of the software used for the listener tests and for the data analyses and Naomi Croghan for her assistance in data collection.
References
[1] S. Kochkin, “Hearing loss population tops 31 million,”Hearing Review, vol. 12, pp. 16–29, 2005.
[2] V. D. Larson, D. W. Williams, W. G. Henderson, et al., “Efficacy of 3 commonly used hearing aid circuits: a crossover trial. NIDCD/VA Hearing Aid Clinical Trial Group,”The American Journal of Medicine, vol. 284, pp. 1806–1813, 2000.
[3] J. Dubno, L. Matthews, L. Fu-Shing, J. Ahlstrom, and A. Horwitz, “Predictors of hearing-aid ownership and success by older adults,” in Proceedings of the International Hearing Aid
Research Conference (IHCON ’08), Lake Tahoe, Calif, USA, August 2008.
[4] S. Kochkin, “Customer satisfaction with hearing instruments in the digital age,”Hearing Journal, vol. 58, pp. 30–37, 2005. [5] I. Nabelek, “Performance of hearing-impaired listeners under
various types of amplitude compression,” Journal of the Acoustical Society of America, vol. 74, pp. 776–791, 1983. [6] R. Lippmann, L. Braida, and N. Durlach, “Study of
mul-tichannel amplitude compression and linear amplification for persons with sensorineural hearing loss,” Journal of the Acoustical Society of America, vol. 69, pp. 524–534, 1981. [7] R. van Buuren, J. Festen, and T. Houtgast, “Compression
and expansion of the temporal envelope: evaluation of speech intelligibility and sound quality,” Journal of the Acoustical Society of America, vol. 105, pp. 2903–2913, 1999.
[8] E. Davies. Venn, P. Souza, and D. Fabry, “Speech and music quality ratings for linear and nonlinear hearing aid circuitry,”
Journal of the American Academy of Audiology, vol. 18, pp. 688– 699, 2007.
[9] P. Souza, “Effects of compression on speech acoustics, intelli-gibility, and sound quality,”Trends in Amplification, vol. 6, pp. 131–165, 2002.
[10] K. Arehart, J. Hansen, S. Gallant, and L. Kalstein, “Evaluation of an auditory masked threshold noise suppression algorithm in normal-hearing and hearing-impaired listeners,” Speech Communication, vol. 40, pp. 575–592, 2003.
[11] T. Ricketts and B. Hornsby, “Sound quality measures for speech in noise through a commercial hearing aid implement-ing “digital noise reduction”,”Journal of the American Academy of Audiology, vol. 16, no. 5, pp. 270–277, 2005.
[12] L.-F. Shi and K. Doherty, “Subjective and objective effects of fast and slow compression on the perception of reverberant speech in listeners with hearing loss,” Journal of Speech, Language, Hearing Research, vol. 51, pp. 1328–1340, 2008. [13] G. Walker, D. Byrne, and H. Dillon, “The effects of
multichan-nel compression/ expansion on the intelligibility of nonsense syllables in noise,”Journal of the Acoustical Society of America, vol. 76, pp. 746–757, 1984.
[14] P. Souza, L. Jenstad, and K. Boike, “Measuring the effects of compression and amplification on speech in noise (L),”
Journal of the Acoustical Society of America, vol. 119, pp. 41– 44, 2006.
[15] S. Rosen, “Temporal information in speech: acoustic, auditory, and linguistic aspects, Philosophical Transactions of the Royal Society,”Biological Sciences, vol. 336, pp. 367–373, 1992. [16] J. Kates, “Hearing-aid design criteria,” Journal of Speech
Language Pathology and Audiology Monograph, supplement 1, pp. 15–23, 1993.
[17] J. H. L. Hansen,Speech Enhancement, Encyclopedia of Electrical and Electronics Engineering, vol. 20, John Wiley & Sons, New York, NY, USA, 1999.
[18] P. G. Stelmachowicz, D. E. Lewis, B. Hoover, and D. H. Keefe, “Subjective effects of peak clipping and compression limiting in normal and hearing-impaired children and adults,”Journal of the Acoustical Society of America, vol. 105, pp. 412–422, 1999.
[19] B. Franck, C. van Kreveld-Bos, W. Dreschler, and H. Ver-schuure, “Evaluation of spectral enhancement in hearing aids, combined with phonemic compression,”Journal of the Acoustical Society of America, vol. 106, pp. 1452–1464, 1999. [20] K. Chung, “Effective compression and noise reduction
[21] M. Nilsson, S. Soli, and J. Sullivan, “Development of a hearing in noise test for the measurement of speech reception thresholds in quiet and in noise,” Journal of the Acoustical Society of America, vol. 95, pp. 1085–1109, 1994.
[22] J. Kates and K. Arehart, “Multichannel dynamic-range com-pression using digital frequency warping,”EURASIP Journal on Applied Signal Processing, vol. 2005, no. 18, pp. 3003–3014, 2005.
[23] ANSI S3.22,Specification of Hearing Aid Characteristics, Amer-ican National Standards Institute, New York, NY, USA, 1996. [24] J. Kates,Digital Hearing Aids, Plural, San Diego, Calif, USA,
2008.
[25] D. Tsoukalas, J. Mourjopoulos, and G. Kokkinakis, “Speech enhancement based on audible noise suppression,” IEEE Tranactions on Speech and Audio Processing, vol. 5, pp. 497– 513, 1997.
[26] ANSI S3.4,Procedure for the Computation of Loudness of Steady Sounds, American Nations Standards Institute, New York, NY, USA, 2007.
[27] D. Byrne and H. Dillon, “The National Acoustics Labo-ratories’(NAL). New procedure for selecting the gain and frequency response of a hearing aid,”Ear and Hearing, vol. 7, pp. 257–265, 1986.
[28] S. Rosenthal, “IEEE: recommended practices for speech quality measurements,” IEEE Transactions on Audio and Electroacoustics, vol. 17, pp. 227–246, 1969.
[29] ANSI S3.6,Specifications for Audiometers, American National Standards Institute, New York, NY, USA, 2004.
[30] G. Studebaker, “A “rationalized” arcsine transform,”Journal of Speech and Hearing Research, vol. 28, pp. 424–434, 1985. [31] M. Stone and B. C. J. Moore, “Effects of spectro-temporal
modulation changes produced by multi-channel compression on intelligibility in a competing-speech task,”Journal of the Acoustical Society of America, vol. 123, pp. 1063–1076, 2008. [32] J. Preminger and D. Van Tassell, “Quantifying the relation
between speech quality and speech intelligibility,”Journal of Speech and Hearing Research, vol. 38, pp. 714–725, 1995. [33] H. David, The Method of Paired Comparisons, Hafner, New
York, NY, USA, 1963.
[34] L. Rabiner, H. Levitt, and A. Rosenberg, “Investigation of stress patterns for speech synthesis by rule,”Journal of the Acoustical Society of America, vol. 45, pp. 92–101, 1969. [35] K. Arehart, J. Kates, M. Anderson, and L. Harvey, “Effects
of noise and distortion on speech quality judgments in normal-hearing and hearing -impaired listeners,”Journal of the Acoustical Society of America, vol. 122, pp. 1150–1164, 2007.
[36] K. Arehart, J. Kates, and M. Anderson, “Effects of linear, nonlinear, and combined linear and nonlinear distortion on perceived speech quality,” inProceedings of the International Hearing Aid Research Conference (IHCON ’08), Lake Tahoe, Calif, USA, August 2008.