P R O C E E D I N G S
Open Access
Family-based Bayesian collapsing method for
rare-variant association study
Liang He
1*, Janne M Pitkäniemi
1,2From
Genetic Analysis Workshop 18
Stevenson, WA, USA. 13-17 October 2012
Abstract
In this study, we analyze the Genetic Analysis Workshop 18 data to identify the genes and underlying single-nucleotide polymorphisms on 11 chromosomes that exhibit significant association with systolic blood pressure. We propose a novel family-based method for rare-variant association detection based on the hierarchical Bayesian framework. The method controls spurious associations caused by population stratification, and improves the statistical power to detect not only individual rare variants, but also genes with either continuous or binary outcomes. Our method utilizes nuclear family information, and takes into account the effects of all
single-nucleotide polymorphisms in a gene, using a hierarchical model. When we apply this method to the genome-wide Genetic Analysis Workshop 18 data, several genes and single-nucleotide polymorphisms are identified as potentially related to systolic blood pressure.
Background
Current studies suggest that a large number of common variants identified in genome-wide association studies (GWAS) as being associated with various complex diseases can account for only a small portion of pheno-type variation [1]. With the advent of next-generation sequencing, attention has focused on rare variants (RVs), such as single-nucleotide polymorphisms (SNPs) with a minor allele frequency (MAF) of less than 1%. Traditional single-marker methods lose statistical power for detecting RV association because of their rare occur-rence. In the last few years, however, a variety of meth-ods have been developed, including the combined multivariate and collapsing (CMC) method [2] and the weighted sum (WS) method [3]. More sophisticated methods that are robust to different variant effects include the kernel-based adaptive cluster (KBAC) method [4], the C-alpha test [5], and the sequence kernel association test (SKAT) [6].
These methods, however, all assume that individuals are independently sampled and are, therefore, vulnerable
to the influence of population stratification. Exploring marker transmission within a family avoids the issues of population stratification. More important, once anRV enters a family, it can segregate to other family members so that copies of the minor allele are enriched in the data. This could potentially increase the statistical power of family-based approaches.
Here we propose a novel family-based Bayesian collap-sing model (FBCM) capable of identifying associations of RVs and genes with quantitative phenotypes. The method builds on the hierarchical quantitative transmission dise-quilibrium test (HQTDT) [7]. Compared to classical statis-tical methods, the Bayesian framework incorporates prior information, thereby providing an alternative approach to situations in which factors affecting the power of the test, such as the MAF of the SNP, play an important role [8]. We combine HQTDT with the idea of collapsing under a Bayesian framework. Then we expand the model in a data-driven manner by utilizing random effects to model the signals of individual rare variants within a gene.
Methods
Family-based Bayesian collapsing model
Several statistical models based on the Bayesian frame-work, such as model selection [9] and multiple regression * Correspondence: [email protected]
1
University of Helsinki, Hjelt Institute, Department of Public Health, PO Box 41, FI-00014 Helsinki, Finland
Full list of author information is available at the end of the article
[10], have been proposed for RV association detection. Because of the large scale of model space and matrix cal-culation, these approaches suffer from impractical com-putational time if a full joint posterior distribution is required. Although most Bayesian methods endeavor to employ various optimization or approximation algo-rithms to obtain a point estimate, the loss of uncertainty information on the estimate means the significance of the estimate cannot be evaluated. In this paper, we pro-pose a Bayesian model that aims to efficiently generate a full posterior distribution without the loss of model space, and is viable for family-based genome-wide asso-ciation analysis. The central idea comes from collapsing RVs and modeling their effects using variant-specific ran-dom effects. In some cases, it is probable that an RV is enriched in certain pedigrees while being very rare in others. Thus, among a group of RVs, some can be both neutral and associated with the phenotype through popu-lation stratification. To solve this problem, the RVs are collapsed in 2 orthogonal components to adjust for the possible population stratification.
Consider a candidate gene that contains Κdiallelic loci (in this paper, a locus always refers to the location of a SNP) with MAF less than 1%. Given a set ofi= 1,...,
Mnuclear families, each of which contains nisiblings so
that the total number of offspring is M
i=1ni=N, we
define the coded genotypic scoreGijk for thejthchild in theithfamily as the number of minor alleles at thekth locus. It is assumed that both parents of each child are available, and, correspondingly, the genotypic scores of the parents at thekthlocus in the ithfamily are denoted by GMik and GFik, respectively, for the mother and father. Conditional on the parental genotypes, the expected score for the offspring in theithfamily at the
kth
locus under mendelian law is GEik=
GMik+GFik
2 .
Furthermore, the deviation of the genotypic score for the jthchild in the ithfamily at the kthlocus, which is denoted by Dijk, isGijk−GEik. For technical reasons, we
add a pseudolocus k = 0 and defineGEi0 =Dij0 = 0.
When at least 1of the parents carries the copies of minor alleles at a locus, it is then possible to observe deviation in offspring at this locus. However, given a moderate set of variants, it is very unlikely for an indi-vidual to harbor minor alleles at more than 2 causal variants. For instance, when MAF is 0.005 and there are 50 independent causal RVs, the probability of an individual having minor alleles at more than 2 loci is
1−0.9950−50 · 0.9949· 0.01−50.49
2 · 0.99
48· 0.012≈1.38%.
Thus, by taking advantage of the rare occurrence of copies of minor alleles, for each individual we consider at most 2 loci that have nonzero deviation in a
candidate gene. These are indexed by rij and sij, which
are defined below.
rij=
k,if individual j in family i has deviation at least at1locus
0,and the locus with the smallest MAF is indexed by k,otherwise.
sij=
k,if individual j in family i has deviation at more than1locus
0,and the locus with the second smallest MAF is indexed by k,otherwise.
This method dramatically shortens computational time by avoiding large-scale matrix computation in Gibbs sampling. If an individual has nonzero deviation at fewer than 2 loci, both or sijare 0. Those with the smallest MAFs are selected if an individual has more than 2 loci with nonzero deviation. Thus, more emphasis is placed on those with smaller MAFs because deleterious func-tional variants tend to have low frequencies [12]. Given that RVs often do not exhibit strong linkage disequili-brium (LD) with either rare or common SNPs [11], for a moderate number of RVs such approximation loses much less information than do naive collapsing methods. Moreover, including 2 loci enables the model to detect the additive effect combination of 2 RVs.
Let yij denote the quantitative phenotype for the jth child in the ith family. The relationship between the phenotype and the set of RVs in the candidate gene can be expressed by a hierarchical model
yij=μ+β1.(αrij.Dijrij+αsij.Dijsij) +β2.(γrij.GEirij+γsij.GEisij) +ϕi+ij (1)
φi∼N(0,σφ2)
ij∼N(0,σ2)
rij,sij0, 1,. . .,K
where µis the global intercept andεijis the random
error. The genotypic score is decomposed into within-family and between-within-family components, and the con-struction of formula (1) guarantees the orthogonality of those 2 components. Inference based onb1provides a stratification-resistant within-family test, whileb2 esti-mates the genetic effect resulting from stratification. As a result of the limitation of the sample size for the infer-ence and the fact that the variance components are not our major interest in this study, the family-level variable
iis modeled as a random effect. This enables us to
cap-ture the between-family variance that includes the influ-ence of the family-specific environmental factor.
The vectors of variant-specific random effects
˜
α= (α0,α1,· · ·,αk) and γ˜ = (γ0,γ1,· · ·,γk) modulate
the within-family and between-family global effects b1 and b2, respectively. rij and sijare individual-specific
jth
child in the ithfamily. It is possible that some of the RVs are neutral, but may be associated with the pheno-type through population stratification. Ignoring this pos-sibility will not only inflate the type I error rate, but also will introduce noise after collapsing. By modeling these 2 situations using α˜ and γ˜ separately, formula (1) (below) manages to detect the association, accounting for neutral RVs as well as population stratification.
Although it is less common to observe LD between RVs compared to common variants, only independent representative SNPs are selected and included in the analysis. Because 2 loci at most are taken into account for each individual, such selection improves the accuracy and efficiency of the model.
Prior distributions for random effects
The multiplicative relation in the 2 pairs (i.e.,b1 and α˜,
b2 and γ˜) may result in a nonidentifiable model. To ensure identifiability, α˜ and γ˜ –except for α0 and γ0, which are random effects of the pseudolocus and sampled fromBern(0)–are selected to be independently sampled from Bernoulli distributions with hyper-parameterspkand
qk. b1 andb2 are given a noninformative normal prior distribution with some variance σβ2, that is,
αk∼Bern(pk), pk∼Beta(1, 1)
γk∼Bern(qk), qk∼Beta(1, 1)
β1∼N(0,α2β), β2∼N(0,α2β)
(2)
Thekth variant is treated as associated whenak = 1;
otherwise it is neutral. The hyperparameter pk is the
predictor forak and can be regarded as the probability of the kth variant being associated. With such a prior distribution for ak, the model actually selects the opti-mal group of associated RVs in a data-driven way and then collapses them together.
Bayesian inference
To investigate the gene-level association, we wish to test the hypothesis b1 = 0. However, in a Bayesian frame-work, this hypothesis cannot be evaluated directly because the posterior distribution of b1 is continuous. Instead, we can conduct a composite hypothesis test:
H0:|β1| ≤ or
Where ∈ is a small positive number. Although in
principle the choice of ∈ is arbitrary, a too small ∈ might inflate the estimate error resulting from the numerical approximation. So we set ∈ as 0.2∗ ˆσ,
where σˆ is the estimated standard deviation for
random error. The Bayes factor (BF) is a good way to summarize the evidence provided by the data in favor of one statistical model over another while also taking into account the complexity of a model. Note that the BF can be expressed using the ratio of the odds of the pos-terior distribution, which can be obtained approximately by the Monte Carlo Markov chain (MCMC) method, to the prior odds. For the prior distribution described above, the prior odds are calculated as
P(|β1|> ∩ K
where erf (•) is the error function, defined as:
erf(x) = √2
the posterior distribution approximated by the outputs of the MCMC method. If the BF exceeds a certain threshold, which is selected through simulations, we conclude that β1 is significant. Once there is evidence
of a global association, we can further assess the under-lying RVs by investigating the marginal posterior distri-bution for ak, k1,..., Κ. Note that if we treat ak as a model indicator, one way to quantify and summarize the posterior probabilities is to calculate the marginal BF, which is the ratio of the posterior odds to the prior odds of the same variable, defined as:
BF(M1(αk= 0) :M0(αk= 0)) =
The model is implemented using WinBUGS with 50,000 iterations, and the convergence is checked by investigating the autocorrelations for all parameters. We also simulate several chains with different initial values simultaneously, and evaluate convergence with the Gelman-Rubin convergence diagnostic tool [13].
Results
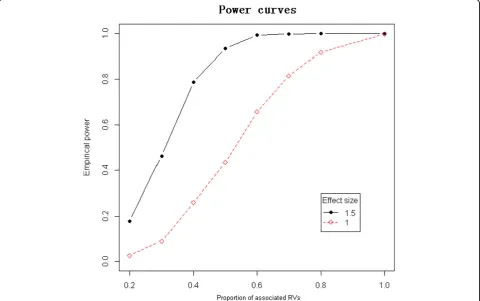
our analyses, owing to the large number of parents with missing genotype. Most causal SNPs with MAF less than 0.01 do not present minor alleles in these 275 trios, so they are not suitable data for testing our method. Conse-quently, we investigated the performance of FBCM by generating a variety of simulation scenarios involving dif-ferent effect sizes and proportions of associated RVs. In particular, we consider the settings in which 20% to 100% of RVs are associated. The total number of families, the offspring in each family, and the total number of RVs are fixed at 300, 2, and 50, respectively. To generate genotypic data for each family, a proportion of the RVs are randomly selected to be causal, represented by an indicator vectorr. Half the RVs are randomly selected to be neutral but are associated with the phenotype through population stratifi-cation, represented by an indicator vectors. The genotypic scores of the parents are independently sampled from
Bern(2 · MAF(k)) for thekthRV, where MAF(k) is fixed as 0.005 throughout all RVs. Then the genotypes of children are obtained from parental haplotypes by ran-dom transmission, denoted by a 2 × 50 matrixG. Gis divided into the expected genotypic score matrixE and the deviation matrix D for the offspring in a family.
The phenotypes of the 2 sibs in each family are gener-ated from N(b1 • (D ×r) + b2•(E ×s), Σ), where b1 is the effect size, b2= 0.5 reflects the effect of
popula-tion stratificapopula-tion, and =
2 1 1 2
is the covariance
matrix to reflect the family structure. We set the hyperparameter σβ2 as 104 and tuned the BF cutoff equal to 2 so that the type I error rate is controlled below 0.005. Figure 1 shows the power curves with
b1 = 1 and 1.5.
To evaluate FBCM using real data, the association ana-lyses are performed by fitting our method to the data that use the full pedigree structure provided, with the entry for each variant being the estimated number of minor alleles carried. Our aim is to identify the genes and underlying RVs related to systolic blood pressure (SBP) throughout those 11 chromosomes among the GAW18 type 2 diabetes families. To better reflect the association between predisposition to hypertension and the variants, the highest SBP measured at the 4 examina-tion points is selected as the phenotype for each indivi-dual. Log-transformation of the phenotype is performed
Figure 1Empirical power comparison between different vaules ofβ1. The red dashed line is the power curve forβ1 = 1. The black solid line is the
to fix the skewness of the phenotype distribution. The age corresponding to the highest measured SBP is included in our model as a covariate to account for the significant correlation between age and SBP. Individuals with any missing data or without parental information are excluded, leaving 275 trios remaining.
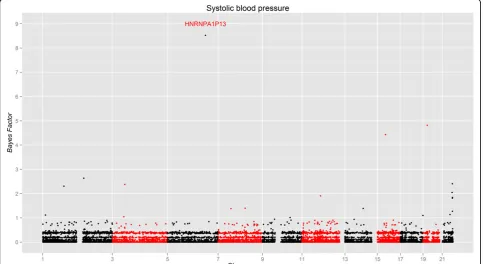
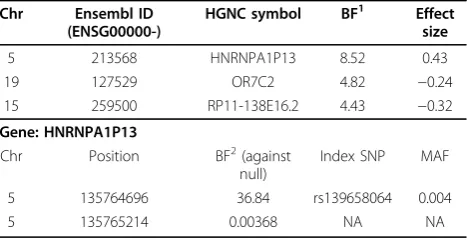
Using the gene information being obtained from Ensembl (http://www.ensembl.org/index.html), we inves-tigated the genes on all 11 chromosomes. For each gene, only variants with MAF of less than 1% within the boundary of the gene are included in the analyses. The MAFs are estimated using 959 individuals in the dosage genotype data. The results are summarized using a Manhattan plot in Figure 2, which shows the BFs (see formula (2)) for the 16,759 genes across these 11 chro-mosomes. Table 1 presents the most significantly asso-ciated genes, with their BFs, estimated effect sizes, HUGO Gene Nomenclature Committee (HGNC) sym-bols (http://www.genenames.org/), and Ensembl gene IDs. The effect size conveys the estimated magnitude of the relationship between SBP and the transmission deviation. Our results show that most genes have BFs of far less than 1, and given only 275 trios in the analyses such results are not surprising. However, we still identify several genes with a BF larger than 2, which is the cut-off obtained from the simulation. The evidence of the
association is substantial for those BFs between 3 and 10, based on Jeffery’s grade of evidence [14], which is relatively subjective because BFs can be sensitive to many factors such as priors and number of RVs. More precise threshold values can be determined by permutation within or between chains in MCMC method. Although the potential influence of RVs on SBP is elusive, previous studies have identified a handful of genes with common variants (MAF>1%) associated with SBP [15]. Our results indicate that several genes with underlying RVs are potentially related to SBP and deserve to be further scrutinized.
Next, we investigated the underlying SNPs among the most related gene, HNRNPA1P13. The most significant SNPs based on their BFs in formula (3) are listed at the bottom of Table 1. The MAF information on these SNPs comes from the 1000 Genomes Project (http:// www.1000genomes.org/). The larger BFs favor the evi-dence against the null hypothesis and indicate that positive deviation from the expected number of transmitted minor alleles drives the effect of the gene, while the BFs much lower than 1 suggest the effect of the deviation in the opposite direction. For example, given the effect size of gene HNRNPA1P13 is 0.43, SNP at position 135765214 with BF 0.00368 indicates that more transmitted copies of a minor allele from parents are likely to have a negative impact on the phenotype.
Discussion
The FBCM proposed here is a novel statistical method for analyzing the association of RVs in pedigree data. The new methodology accounts for potential nonasso-ciated variants by introducing random effects in a multi-plicative way to approximate and capture the variant effects. The FBCM also takes into account situations in which some pooled variants can be associated with a phenotype through population stratification. Although the between-family component in our model can be integrated into the family-level random effect φi, when
the RV under investigation shows a significant between-family effect, our model performs better by capturing this effect to reduce the residual error. The model is based on the HQTDT, but expands the HQTDT by incorporating the collapsing information of the deviation from the expected genotypic score for a group of SNPs and at the same time maintaining orthogonality. Unlike the model selection method [9], our model employs ran-dom effects to predict variant-specific effects based on data and succeeds in boosting the sensitivity for gene association detection by collapsing the random effects of RVs. By taking advantage of the rare occurrence of minor alleles in an individual, the algorithm considers at most 2 sites in order to reduce the number of predic-tors, circumventing the huge computational burden involved in obtaining the full posterior distribution.
In variant-level analysis, our method improves the power to detect RV effects. The improvement of statisti-cal power can be achieved by accounting for the random effects of all variants in a candidate gene through Gibbs sampling. Moreover, in the GAW18 data, it has been shown that the occurrence of a RV tends to be more common if a family member carries a minor allele. Thus, the family-based analysis is expected to have more power than the independent population-based analysis. The results show that our family-based method is able to identify both genes and individual SNPs significantly related to the phenotype, even in RV situations.
Our model can be further expanded in many ways. The appropriate link functions can be employed to han-dle other forms of phenotype, such as binary data. In this study, we focus on families without any missing data. However, for the trios with missing parental geno-type information, the genetic score can be decomposed into between-family and within-family components by using only sibs genotypes. For the random effect distri-bution, the Bernoulli distribution is assigned as the prior distribution for the random effects of individual variants. For better modeling of the effects of individual variants, more sophisticated distributions can be employed.
Conclusions
We have demonstrated that a novel FBCM can be applied to identify associations between RVs and quanti-tative traits for pedigree data. This method cannot only detect the gene effect, but can also pinpoint the underly-ing SNPs. Compared to other methods for handlunderly-ing RVs, our method based on family data improves statisti-cal power by collapsing and accounting for all possible RV effects in a gene with population stratification con-trolled. Because the method allows for computational efficiency in obtaining the full posterior distribution, it is applicable to large-scale association tests. The results of our genome-wide analyses provide insights into the potential role of RVs in SBP.
Competing interests
The authors declare that they have no competing interests.
Authors’contributions
Both authors participated in designing the methods. He L, conducted the simulation, analyzed the data, interpreted the results and wrote the paper. Pitkaniemi co-designed the analysis and revised the paper. Both authors read and approved the final manuscript.
Acknowledgements
The authors are grateful to the HjeltInstitute for providing facilities to complete this work. The GAW18 whole genome sequence data were provided by the T2D-GENES Consortium, which is supported by NIH grants U01 DK085524, U01 DK085584, U01 DK085501, U01 DK085526, and U01 DK085545. The other genetic and phenotypic data for GAW18 were provided by the San Antonio Family Heart Study and San Antonio Family Diabetes/Gallbladder Study, which are supported by NIH grants P01 HL045222, R01 DK047482, and R01 DK053889. The Genetic Analysis Workshop is supported by NIH grant R01 GM031575.
This article has been published as part ofBMC ProceedingsVolume 8 Supplement 1, 2014: Genetic Analysis Workshop 18. The full contents of the supplement are available online at http://www.biomedcentral.com/bmcproc/ supplements/8/S1. Publication charges for this supplement were funded by the Texas Biomedical Research Institute.
Authors’details
1University of Helsinki, Hjelt Institute, Department of Public Health, PO Box
41, FI-00014 Helsinki, Finland.2Finnish Cancer Finnish Cancer Registry, Institute for Statistical and Epidemiological Cancer Research, Pieni Roobertinkatu 9, FI-00130 Helsinki, Finland.
Published: 17 June 2014
Table 1 Most significant genes associated with SBP
Chr Ensembl ID (ENSG00000-)
HGNC symbol BF1 Effect size
5 213568 HNRNPA1P13 8.52 0.43
19 127529 OR7C2 4.82 −0.24
15 259500 RP11-138E16.2 4.43 −0.32
Gene: HNRNPA1P13
Chr Position BF2(against
null)
Index SNP MAF
5 135764696 36.84 rs139658064 0.004
5 135765214 0.00368 NA NA
1
BF in formula (2).
2
References
1. Hindorff L, MacArthur J, Wise A, Junkins H, Hall P, Klemm A, Manolio T:A Catalog of Published Genome-Wide Association Studies.[http://www. genome.gov/gwastudies].
2. Li B, Leal SM:Methods for detecting associations with rare variants for common diseases: application to analysis of sequence data.Am J Hum Genet2008,83:311-321.
3. Madsen BE, Browning SR:A groupwise association test for rare mutations using a weighted sum statistic.PLoS Genet2009,5:e1000384.
4. Liu DJ, Leal SM:A novel adaptive method for the analysis of next-generation sequencing data to detect complex trait associations with rare variants due to gene main effects and interactions.PLoS Genet2010, 6:e1001156.
5. Neale BM, Rivas MA, Voight BF, Altshuler D, Devlin B, Orho-Melander M, Kathiresan S, Purcell SM, Roeder K, Daly MJ:Testing for an unusual distribution of rare variants.PLoS Genet2011,7:e1001322. 6. Wu MC, Lee S, Cai T, Li Y, Boehnke M, Lin X:Rare-variant association
testing for sequencing data with the sequence kernel association test. Am J HumGenet2011,89:82-93.
7. Gauderman WJ:Candidate gene association analysis for a quantitative trait, using parent-offspring trios.Genet Epidemiol2003,25:327-338. 8. Stephens M, Balding DJ:Bayesian statistical methods for genetic
association studies.Nat Rev Genet2009,10:681-690.
9. Quintana MA, Berstein JL, Thomas DC, Conti DV:Incorporating model uncertainty in detecting rare variants: the Bayesian risk index.Genet Epidemiol2011,35:638-649.
10. Yi N, Zhi D:Bayesian analysis of rare variants in genetic association studies.Genet Epidemiol2011,35:57-69.
11. Pritchard JK, Cox NJ:The allelic architecture of human disease genes: common disease-common variant...or not?Hum Mol Genet2002, 11:2417-2423.
12. Nielsen R, Hellmann I, Hubisz M, Bustamante C, Clark AG:Recent and ongoing selection in the human genome.Nat RevGenet2007,8:857-868. 13. Gelman A, Rubin DB:Inference from iterative simulation using multiple
sequences.Stat Sci1992,7:457-472.
14. Jeffreys H:Theory of Probability.New York, Oxford University Press;, 3 1998.
15. Ehret G:Genome-wide association studies: contribution of genomics to understanding blood pressure and essential hypertension.Curr Hypertens Rep2010,12:17-25.
doi:10.1186/1753-6561-8-S1-S37
Cite this article as:He and Pitkäniemi:Family-based Bayesian collapsing method for rare-variant association study.BMC Proceedings2014 8(Suppl 1):S37.
Submit your next manuscript to BioMed Central and take full advantage of:
• Convenient online submission
• Thorough peer review
• No space constraints or color figure charges
• Immediate publication on acceptance
• Inclusion in PubMed, CAS, Scopus and Google Scholar
• Research which is freely available for redistribution