R E S E A R C H A R T I C L E
Open Access
Regional variation in caesarean deliveries
in Germany and its causes
Rafael T Mikolajczyk
1,2,3*, Niklas Schmedt
1, Jun Zhang
4, Christina Lindemann
1,5, Ingo Langner
1and Edeltraut Garbe
1Abstract
Background:Determinants of regional variation in caesarean sections can contribute explanations for the observed overall increasing trend of caesarean sections. We assessed which mechanism explains the higher rate of caesarean sections in the former West than East Germany: a more liberal use of caesarean sections in the case of relative indications or more common caesarean sections without indications.
Methods:We used a health insurance database from all regions of Germany with approximately 14 million insured individuals (about 17% of the total population in Germany). We selected women who gave birth in the years 2004 to 2006 and identified indications for caesarean section on the basis of hospital diagnoses in 30 days around birth. We classified pregnancies into three groups: those with strong indications for caesarean section (based on classification of absolute indications recommended by the Unmet Obstetrics Need network), those with moderate indications (other indications increasing the probability of caesarean section) and those with no indications. We investigated the percentage of caesarean sections among all births, presence of strong or moderate indications in all pregnancies, the probability of caesarean sections in the presence of indications and the fraction of caesarean sections attributable to strong, moderate and no indications.
Results:In total, 294,841 births from 2004–2006 were included in the analysis. In the former West Germany, 30% births occurred by caesarean section, while in the former East Germany the caesarean section rate was 22%. Proportions of pregnancies with strong and moderate indications for caesarean section were similar in both regions. For strong indications the probability of caesarean section was similar in East and West Germany, but the probability of caesarean section among women with moderate indications was substantially higher in the former West Germany. Caesarean sections were also more common among women with no indications in the former West (8%) than in the former East (4-5%). The higher probability of caesarean section in the case of strong or moderate indications in the former West than in the East explained 87% of the difference between section rates in these two regions, while caesarean sections without indications contributed to only 13% of the difference observed.
Conclusions:The observed difference between caesarean section rates in the former East and West Germany was most likely due to different medical practice in handling relative indications.
Keywords:Caesarean section, Regional differences, Absolute and relative indications, Time trends
* Correspondence:Rafael.mikolajczyk@helmholtz-hzi.de 1
Department of Clinical Epidemiology, Leibniz Institute for Prevention Research and Epidemiology-BIPS, Bremen, Germany
2
Department of Epidemiology, Helmholtz Centre for Infection Research, Inhoffenstr. 7, 38124, Braunschweig, Germany
Full list of author information is available at the end of the article
Background
Caesarean section rates are on the rise worldwide [1-4]. The causes of this increase remain often hidden and can differ across countries. In Germany, substantial differences in caesarean section rates between the former eastern and western parts have been observed [5]. Absolute indications for caesarean section, which are responsible only for a small share of caesarean sections in developed countries, are unlikely to explain the partly large differences. But it re-mains unclear whether the differences arise from different medical practice (in such case either relative indications can be diagnosed more frequently, or in case of relative in-dications there is a higher probability of caesarean section being performed) or from different preferences regarding caesarean sections without indications. If caesarean sec-tions are performed more commonly in the presence of relative indications, the difference may be attributable to medical practice. In contrast, if the difference arises from caesarean sections without indications, the woman’s or physician’s preference is likely to play a major role. We studied the components of East-West differences with re-gard to caesarean section by assessing: a) the prevalence of indications for caesarean section in all births, b) the risk for caesarean section in the presence of indications, c) the difference in caesarean section rates attributable to caesar-ean sections with and without indications.
Methods
Sample
We analysed data from the German Pharmacoepide-miological Research Database (GePaRD). The database has been described elsewhere [6-10]. In brief, GePaRD consists of claims data from four German statutory health insurances with more than 14 million people (around 17% of the total population) across Germany. The database contains in- and outpatient diagnoses, diagnostic and therapeutic procedures, and outpatient drug prescriptions. At the time of this analysis, data for 2004–2006 were available for all four health insurances included in GePaRD. The utilisation of health insurance data for scientific research is regulated by the Code of Social Law in Germany (SGB X). This study was conducted with permission from the Federal Ministry of Health, which is the responsible authority. Informed consent was not required, since the study was based on routinely collected anonymised data.
Ascertainment of diagnoses and procedures
All hospital births to women 12 to 54 years old between January 1st2004 and December 31st2006 were identified using coding of diagnoses according to the International Classification of Diseases, German Modification, 10th ver-sion (ICD-10 GM) and coding of operations and proce-dures (OPS). Births were classified as caesarean sections
based on ICD-10 GM and OPS codes. To assess potential indications, we screened all admission and discharge diag-noses from hospitalisations starting in the 30 days before birth. Additionally, we included hospitalisations after birth if they ended within 30 days after birth. For codes indicat-ing duration of pregnancy, we restricted the interval to 7 days before and after the delivery date, since ICD-10 codes indicating the duration of pregnancy (O09.-) can be used throughout the pregnancy i.e. also for admissions for rea-sons other than delivery.
The selection of diagnoses which can be potentially as-sociated with a higher risk of caesarean sections was based on a review of the literature and content know-ledge (the corresponding ICD-10 codes are provided in Table 1). Since the data does not contain the actual rea-son for caesarean section but only reimbursement diag-noses recorded around birth, the clinical classification of
Table 1 Diagnoses with an expected higher risk of caesarean section and the corresponding ICD-GM 10 codes
Diagnoses ICD-GM 10 codes
Twins and higher order pregnancies O30, Z37.2-3, Z37.5-6, Z38.3, Z38.6
Anomalies of the foetal presentation O32, O64
Intrauterine growth restriction O36.5
Post date pregnancy O09.7, O48
Preterm delivery O09.3-5, O60.1, O60.3
Maternal distress O75.0, O75.2, O75.3
Obstructed labour O66
Anomalies of maternal pelvis O34, O65
Intrapartal bleeding (excluded placenta previa) O67
Failed induction O61
Complications because of umbilical cord O69
Diabetes mellitus O24.0-3
Gestational diabetes mellitus O24.4
Uterine rupture O71.0-1
Premature rupture of foetal membranes (PROM) O42, O75.5-6
Abnorm contractions O62.0-2
absolute and relative indications can be only approxi-mated. Therefore the diagnoses were grouped into strong indications (corresponding to the classification proposed by the Unmet Obstetric Need network [11], but including also breech delivery among anomalies of foetal presenta-tion) and moderate indications (all other diagnoses thought to increase the probability of caesarean section).
Statistical analysis
We calculated the percentage of caesarean sections among all hospital deliveries stratified by year and federal state. To obtain representative numbers for Germany and regions of former West and East Germany (including Berlin), the proportion of caesarean sections per federal state was weighted by the total number of births in the correspond-ing federal state. Furthermore, we ascertained the preva-lence of indications for caesarean section among all births. We then estimated the risk of caesarean sections among those with a specific indication. We used logistic regression to test for time trends and regional differences (East vs. West Germany), simultaneously adjusting for both sources of variation. Finally, we calculated the percentage of caesar-ean sections resulting from strong indications, moderate indications and no indications by maternal age and region. We also calculated the attributable fraction of caesarean sections for strong, moderate or no indications in East and West Germany. All statistical analyses were conducted with SAS 9.2 (SAS Institute Inc., Cary, NC). We specified the significance level at p < 0.01.
Results
Variation in caesarean section rates across federal states In total, 294,841 births were included in the analysis (Table 2). Among them, 29% were caesarean sections. In 2004, the caesarean section rate in GePaRD was two per-cent points higher than in the hospital statistics for the whole of Germany, but the rates converged over time and in 2006 there was only one percent point difference. Across the federal states there were substantial regional differences, with caesarean section rates in the former West Germany at 30% and in the former East at 22%. In Berlin, the rate was close to those observed in the former East Germany despite the fact that territorially a larger part of Berlin belonged to the former West Germany. Within the former West and East Germany there was little variation across federal states (Figure 1).
There was an almost linear increase in caesarean section rates by maternal age, with a doubling of rates from 20% to 40% between the ages of 15 and 44 in the former West and from 15% to 30% in the former East (Figure 2).
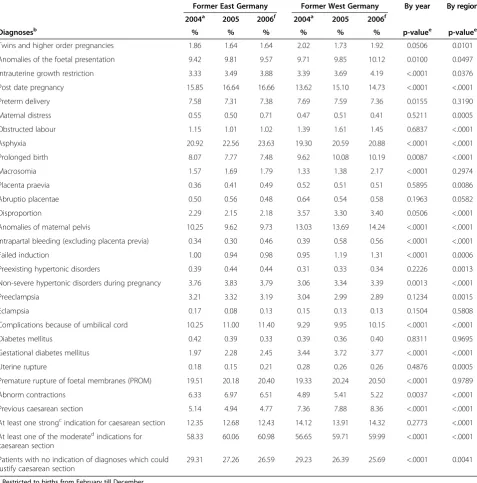
Prevalence of indications for caesarean section in all births Over the three years, there were no major changes in the prevalence of diagnoses providing indications for
caesarean section, with the exception of the diagnosis of asphyxia which increased from 21 to 24% of all births in former East Germany (Table 3). However, because of sev-eral minor changes, the fraction of women with at least one indication for caesarean section increased by 2–3 per-cent points in both regions and correspondingly, the frac-tion of pregnancies without any indicafrac-tions decreased. For strong indications, there was no change over the study period. There were some differences between both re-gions, but most of them were less than one percent point. The overall percentages of women with at least one strong, at least one moderate and no indications for cae-sarean section were very similar in both parts.
Risk of caesarean section in the presence of indications We also analysed how often caesarean sections were performed when specific conditions existed (Table 4). As expected, there was a large variation in the probability of caesarean section across different conditions. Indications classified as strong were associated with a probability of caesarean section of 75% or more. Additionally, the frac-tion of caesarean secfrac-tions was high (>50%) in the case of twins or higher order pregnancies, anomalies of foetal presentation, disproportion or anomalies of maternal pelvis, failed induction, eclampsia, and previous caesar-ean section. In contrast, for some of the moderate indi-cations the risk of caesarean sections was below 30%. For patients with no indications, the probability of a cae-sarean section was 4-5% in the East and 8% in the West.
Most of the changes over time in the risk of caesarean section given the presence of indications did not reach statistical significance (Table 4). The few exceptions were prolonged birth and anomalies of maternal pelvis, failed induction and previous caesarean section, for which the risk of caesarean section increased by seven percent points between 2004 and 2006 in former East Germany, and macrosomia for which the risk of caesarean section decreased in both East and West, but the change was more pronounced in the West.
In contrast to the limited changes over time, there were substantial regional differences in the risk of cae-sarean section in the presence of indications (Table 4). Overall, in the presence of strong indications, there was no regional difference with respect to the risk of caesar-ean section – in contrast, the risk of caesarean section was 20% for women with moderate indications in the former East and 28% in the former West.
Table 2 Percentage of caesarean sections among all hospital deliveries by year and federal states
GePaRD Hospital statistics
2004 2005 2006 2004 2005 2006
All Births [n] 100,160 99,195 95,486 682,767 664,597 652,642
Schleswig-Holstein 29.0 28.2 30.4 24.9 27.2 30.3
Hamburg 30.6 30.6 30.9 26.9 30.1 27.6
Lower Saxony 29.6 30.0 30.2 27.0 28.1 28.7
Bremen 27.8 26.4 26.3 28.8 26.1 29.5
North-Rhine Westphalia 30.6 31.4 32.1 27.9 28.6 29.6
Hesse 31.0 31.8 32.7 29.8 30.9 31.5
Rhineland-Palatinate 31.9 31.5 32.1 30.8 29.1 30.4
Baden-Württemberg 29.6 30.1 30.2 28.1 28.9 29.3
Bavaria 28.8 29.2 30.6 27.6 28.5 30.4
Saarland 33.2 31.4 34.4 33.6 32.1 33.2
Berlin 23.0 22.4 23.8 20.7 21.9 24.1
Brandenburg 22.4 23.3 25.0 20.6 21.3 23.6
Mecklenburg-Western Pomerania 25.6 26.4 24.8 23.0 23.4 24.7
Saxony 21.8 20.1 19.8 19.9 21.0 22.2
Saxony-Anhalt 23.0 22.7 23.1 20.6 22.2 22.5
Thuringia 22.7 21.0 23.7 24.7 23.2 23.9
Former West Germany* 30.0 30.4 31.2 28.1 28.8 29.8
Former East Germany*,+ 22.8 22.2 22.9 21.2 21.9 23.3
Total* 28.7 28.9 29.6 26.8 27.6 28.6
* Weighted estimate using crude birth rates per federal state. +
including Berlin.
Figure 1Variation in caesarean section rates across federal states in Germany (%).
Caesarean sections attributable to strong, moderate and no indications
The percentage of caesarean sections resulting from strong indications was slightly higher in the East than in the West (Figure 3). The percentages of of caesarean sections attributable to relative indications in the West and in the East were similar, while the percentage of
caesarean sections in the absence of indications was higher in the West. There were more caesarean sections without identifiable indications among young women.
Discussion
We found that the substantial difference in caesarean sec-tion rates between the former East and West Germany, 15
Table 3 Prevalence of complications of pregnancy and labour with a higher risk for caesarean section by region and year (all hospital births in the GePaRD) (% with a given diagnosis)
Former East Germany Former West Germany By year By region 2004a 2005 2006f 2004a 2005 2006f
Diagnosesb % % % % % % p-valuee p-valuee
Twins and higher order pregnancies 1.86 1.64 1.64 2.02 1.73 1.92 0.0506 0.0101
Anomalies of the foetal presentation 9.42 9.81 9.57 9.71 9.85 10.12 0.0100 0.0497
Intrauterine growth restriction 3.33 3.49 3.88 3.39 3.69 4.19 <.0001 0.0376
Post date pregnancy 15.85 16.64 16.66 13.62 15.10 14.73 <.0001 <.0001
Preterm delivery 7.58 7.31 7.38 7.69 7.59 7.36 0.0155 0.3190
Maternal distress 0.55 0.50 0.71 0.47 0.51 0.41 0.5211 0.0005
Obstructed labour 1.15 1.01 1.02 1.39 1.61 1.45 0.6837 <.0001
Asphyxia 20.92 22.56 23.63 19.30 20.59 20.88 <.0001 <.0001
Prolonged birth 8.07 7.77 7.48 9.62 10.08 10.19 0.0087 <.0001
Macrosomia 1.57 1.69 1.79 1.33 1.38 2.17 <.0001 0.2974
Placenta praevia 0.36 0.41 0.49 0.52 0.51 0.51 0.5895 0.0086
Abruptio placentae 0.50 0.56 0.48 0.64 0.54 0.58 0.1963 0.0582
Disproportion 2.29 2.15 2.18 3.57 3.30 3.40 0.0506 <.0001
Anomalies of maternal pelvis 10.25 9.62 9.73 13.03 13.69 14.24 <.0001 <.0001
Intrapartal bleeding (excluding placenta previa) 0.34 0.30 0.46 0.39 0.58 0.56 <.0001 <.0001
Failed induction 1.00 0.94 0.98 0.95 1.19 1.31 <.0001 0.0006
Preexisting hypertonic disorders 0.39 0.44 0.44 0.31 0.33 0.34 0.2226 0.0013
Non-severe hypertonic disorders during pregnancy 3.76 3.83 3.79 3.06 3.34 3.39 0.0013 <.0001
Preeclampsia 3.21 3.32 3.19 3.04 2.99 2.89 0.1234 0.0015
Eclampsia 0.17 0.08 0.13 0.15 0.13 0.13 0.1504 0.5808
Complications because of umbilical cord 10.25 11.00 11.40 9.29 9.95 10.15 <.0001 <.0001
Diabetes mellitus 0.42 0.39 0.33 0.39 0.36 0.40 0.8311 0.9695
Gestational diabetes mellitus 1.97 2.28 2.45 3.44 3.72 3.77 <.0001 <.0001
Uterine rupture 0.18 0.15 0.21 0.28 0.26 0.26 0.4876 0.0005
Premature rupture of foetal membranes (PROM) 19.51 20.18 20.40 19.33 20.24 20.50 <.0001 0.9789
Abnorm contractions 6.33 6.97 6.51 4.89 5.41 5.22 0.0037 <.0001
Previous caesarean section 5.14 4.94 4.77 7.36 7.88 8.36 <.0001 <.0001
At least one strongcindication for caesarean section 12.35 12.68 12.43 14.12 13.91 14.32 0.2773 <.0001
At least one of the moderatedindications for caesarean section
58.33 60.06 60.98 56.65 59.71 59.99 <.0001 <.0001
Patients with no indication of diagnoses which could justify caesarean section
29.31 27.26 26.59 29.23 26.39 25.69 <.0001 0.0041
a
Restricted to births from February till December. b
The same patient could have several of the listed diagnoses. c
As strong indications were classified:Placenta praevia,Abruptio placentae, Uterine rupture, anomalies of foetal presentation and disproportion [11]. d
All indications listed in the table and not classified as strong were classified as moderate. e
p-values obtained from logistic regression simultaneously adjusting for time trends and regional differences. f
years after the reunification of Germany had two compo-nents. For a long list of conditions (moderate indications), the probability of caesarean section was considerably higher in the former West than in the East. The preva-lence of these conditions did not substantially differ be-tween the two former parts of Germany, which excludes the over-coding of potential justifications for caesarean sections as a potential explanation of the difference.
Additionally, the probability of a caesarean section for women without any of the studied conditions was sub-stantially higher in the West, but most of the difference in caesarean section rates between both parts was explained by a higher probability of caesarean sections in case of in-dications in the western part of Germany.
Extreme variations in caesarean section rates exist across countries worldwide, but in this study we examined
Table 4 Probability of caesarean section given selected pregnancy and intrapartum conditions
Former East Germany Former West Germany By year By region 2004a 2005 2006f 2004a 2005 2006f
Diagnosesb % % % % % % p-valuee p-valuee
Twins and higher order pregnancies 71.85 71.38 68.28 75.30 74.42 74.34 0.3512 0.0118
Anomalies of the fetal presentation 76.72 74.41 75.83 79.15 79.56 78.83 0.4934 <.0001
Intrauterine growth restriction 47.96 44.55 42.88 52.91 51.58 50.67 0.0259 <.0001
Post date pregnancy 18.58 17.88 19.96 24.73 24.96 25.80 0.0303 <.0001
Preterm delivery 50.49 46.55 46.63 54.25 54.34 55.44 0.7540 <.0001
Maternal distress 46.67 39.33 45.22 57.63 60.29 55.81 0.6702 <.0001
Obstructed labour 54.01 52.51 49.40 53.54 54.39 54.73 0.8577 0.3510
Asphyxia 31.08 29.07 29.75 36.92 36.54 37.24 0.9664 <.0001
Prolonged birth 44.84 45.66 50.08 48.84 49.63 50.60 0.0030 0.0009
Macrosomia 48.82 45.97 46.58 54.38 57.74 48.67 0.0014 0.0011
Placenta praevia 93.22 82.19 82.50 87.95 86.68 87.47 0.3814 0.4586
Abruptio placentae 87.65 85.86 82.28 84.28 86.68 86.85 0.5091 0.8071
Disproportion 80.59 79.42 80.00 83.23 82.10 81.98 0.2338 0.0476
Anomalies of maternal pelvis 64.46 67.41 69.80 77.69 78.74 78.79 0.0023 <.0001
Intrapartal bleeding (excluding placenta praevia) 52.73 64.15 50.67 51.55 50.11 57.18 0.1732 0.5729
Failed induction 63.80 70.30 71.07 82.11 86.05 86.88 0.0029 <.0001
Preexisting hypertonic disorders 49.21 41.56 49.30 63.25 52.06 54.40 0.0932 0.0115
Non-severe hypertonic disorders during pregnancy 38.85 36.15 36.57 48.93 47.59 48.01 0.3590 <.0001
Preeclampsia 57.39 50.85 57.12 61.49 63.40 65.15 0.0278 <.0001
Eclampsia 67.86 57.14 57.14 68.75 77.14 69.15 0.8089 0.1219
Complications because of umbilical cord 16.06 15.25 17.48 18.79 18.78 20.04 0.0254 <.0001
Diabetes mellitus 50.00 55.07 58.49 60.21 56.70 59.79 0.7618 0.2409
Gestational diabetes mellitus 32.60 33.83 34.09 41.21 40.99 42.09 0.4453 <.0001
Uterine rupture 93.10 88.89 94.12 89.10 88.73 91.94 0.3597 0.5007
Premature rupture of foetal membranes (PROM) 21.98 19.04 19.66 24.97 25.03 25.21 0.6226 <.0001
Abnorm contractions 18.19 13.91 18.27 19.00 17.37 17.10 0.0618 0.1223
Previous caesarean section 68.94 71.18 76.32 80.64 81.15 82.45 0.0003 <.0001
At least one strongcindication for caesarean section 77.96 75.51 76.71 80.32 80.31 79.86 0.2480 <.0001
At least one of the moderatedindications for
caesarean section
20.78 19.62 20.77 28.40 28.63 29.28 0.0080 <.0001
Patients with no indication of diagnoses which could justify caesarean section
4.04 4.26 4.82 8.17 7.91 8.19 0.5343 <.0001
a
Restricted to data from February till December. b
The same patient could have several of the listed diagnoses. c
As strong indications were classified: Placenta praevia, Abruptio placaente, uterine rupture, anomalies of foetal presentation and disproportion [11]. d
All indications listed in the table and not classified as strong were classified as moderate. e
p-values obtained from logistic regression mutually adjusting for time trends and regional differences. f
the regional variation within one country. Substantial dif-ferences in caesarean rates between regions were also ob-served in other countries [12,13]. Our findings agree with the analyses of time trends in caesarean sections by dem-onstrating that the differences cannot be explained by clin-ical risk factors or maternal characteristics [14,15]. The interesting point about Germany is that while some vari-ation within both former parts was also observed, the major difference was between them, which most likely means, that there are different traditions originating from the historical division of Germany.
There was nearly no difference in the prevalence of indi-cations for caesarean section between the East and West. With most of the difference attributable to the higher probability of caesarean sections in the presence of indica-tions, the different medical practice provides a likely ex-planation for the observed phenomenon, consistent with other studies [12,13]. The coexistence of caesarean section rates varying by 50% across different regions is astonish-ing, given that both East and West Germany have the same language, media, and social system. The training of medical doctors is standardised across Germany and there is an exchange among staff between regions. Still, in some way, different traditions persist in both former parts. Add-itionally, there is some contribution of caesarean sections without identified indications to the East-West difference. This fact is likely to reflect different preferences of the women, but also possibly more liberal opinions regarding caesarean sections without indications held by the doctors in the West.
Given the high probability of caesarean section conduc-ted among women with a previous caesarean section (>70% in the East and >80% in West Germany), primary caesarean sections determine repeat caesarean sections in subsequent pregnancies. This mechanism is of concern as a potential cause of further increase in caesarean section rates [15]. Unfortunately, health insurance data in Germany does not contain information on parity. Given the lower fertility in the Eastern part in the 1990s [5], the fraction of primiparous women was likely higher in the
East than in the West in the studied period, which should increase caesarean section rates in the East part i.e. the dif-ference in parity-specific caesarean section rate would in reality be even larger. Although the average age at delivery is also lower in the East part [5], this variable does not ex-plain the regional difference as can be seen in Figures 2 and 3 which are stratified by age.
Our findings on the subdivision of caesarean sections in those with strong, moderate and no indications underline once more the fundamental paradox of the optimal section rate. Only 35-40% of caesarean sections were conducted due to strong indications and for a ma-jority of sections the indications were non-absolute. The non-absolute indications provide room for change. By linking different section rates with pregnancy outcomes it should be possible to address the question of the opti-mal section rate in further research.
Strengths and limitations
The strength of the analysis is the use of the large data-base. While this database might not be representative of the entire population in all regions of Germany, it is likely to include the same segment of the population with respect to social status across different regions, making direct regional comparisons possible. A further strength is that we were able to include not solely diag-noses from the hospital stay during which birth oc-curred, but also diagnoses from hospitalisations around delivery time. This should minimize the effects of in-complete coding of diagnoses during the hospital stay ending with birth.
This study also has several important limitations. The database consists of claims data i.e. diagnoses were recorded for the purpose of reimbursement rather than for complete clinical or epidemiological assessment. Nevertheless, several diagnoses included in this analysis were medically unequivocal and for those a correct cod-ing should be expected. German health insurance data does not contain information on body mass index which did not allow the inclusion of this risk factor in the
analysis. We also did not establish which caesarean sec-tions were conducted without the onset of labour (planned caesarean section) because a preliminary ana-lysis demonstrated that the necessary information was only available in a small fraction of the cases. Further-more, we did not assess absolute and relative indications for caesarean section as proposed by the guidelines, but only studied the presence of conditions which might in-crease the probability of caesarean sections and the oc-currence of caesarean sections in women with a record of these conditions. Particularly, we were not able to separate breech delivery from other anomalies of fetal presentation, which resulted in classification of breech presentation as strong indication for caesarean section. Also other codes provided some room for misclassifica-tion. Formally assessing absolute and relative indications and causes of caesarean section did not appear possible without a standardisation of indications and without fur-ther information from medical records. A furfur-ther limita-tion is that we only included indicalimita-tions related to obstetric outcomes and did not consider for example psychiatric codes. Failure to account for these cases might have increased the fraction of caesarean sections without indications, but this effect should be minor.
Conclusions
To conclude, the substantial difference in caesarean sec-tion rates between both former parts of Germany, fifteen years after reunification, was most likely due to different medical practice in handling of pregnancies with relative indications for caesarean sections. These differences pos-sibly originate from the past and persist despite a standardised training of the medical staff across Germany.
Competing interests
RTM received research funding from Sanofi Pasteur and Bayer Pharma. NS, CL and IL participated in projects funded by Bayer Pharma. JZ has no conflict of interests. EG is running a department that occasionally performs studies for pharmaceutical industries. The companies include Mundipharma, Bayer Pharma, Stada, SanofiAventis, SanofiPasteur, Novartis, Celgene and GSK. EG has been consultant to Bayer Pharma, Nycomed, Teva and Novartis in the past.
Authors’contributions
RTM designed the research question and drafted the manuscript. NS conducted the analysis. NS and CL contributed sections of the manuscript. IL conceptualised parts of the analysis. JZ, IL and EG provided comments on the manuscript which substantially improved its content. All authors read and approved the final version.
Acknowledgements
The authors would like to acknowledge support with data analysis by Denise Heuer. The authors are also grateful to all SHIs that provided data for this study: the Allgemeine Ortskrankenkasse (AOK) Bremen/Bremerhaven, the DAK Gesundheit-Unternehmen Leben, the Techniker Krankenkasse (TK) and the hkk
Funding
Parts of the analyses presented in this paper were conducted in a project focussing on the validation of birth information in GePaRD with funding from the Bayer Pharma AG.
Author details
1
Department of Clinical Epidemiology, Leibniz Institute for Prevention Research and Epidemiology-BIPS, Bremen, Germany.2Department of
Epidemiology, Helmholtz Centre for Infection Research, Inhoffenstr. 7, 38124, Braunschweig, Germany.3Department of Infectious Diseases Epidemiology,
Hannover Medical School, Hannover, Germany.4MOE-Shanghai Key Laboratory of Children’s Environmental Health, Xinhua Hospital, Shanghai Jiaotong University School of Medicine and School of Public Health, Shanghai, China.5Faculty of Public Health, HFH Hamburg Distance University
of Applied Sciences, Hamburg, Germany.
Received: 24 December 2012 Accepted: 24 April 2013 Published: 1 May 2013
References
1. Lumbiganon P, Laopaiboon M, Gulmezoglu AM, Souza JP, Taneepanichskul S, Ruyan P, Attygalle DE, Shrestha N, Mori R, Nguyen DH,et al:Method of delivery and pregnancy outcomes in Asia: the WHO global survey on maternal and perinatal health 2007–08.Lancet2010,375:490.
2. Howell S, Johnston T, Macleod SL:Trends and determinants of caesarean sections births in Queensland, 1997–2006.Aust N Z J Obstet Gynaecol 2009,49:606.
3. Bogg L, Huang K, Long Q, Shen Y, Hemminki E:Dramatic increase of Cesarean deliveries in the midst of health reforms in rural China.Soc Sci Med2010,70:1544.
4. MacDorman MF, Menacker F, Declercq E:Cesarean birth in the United States: epidemiology, trends, and outcomes.Clin Perinatol2008,35:293. 5. Federal Statistical Office: 2010.
6. Pigeot I, Ahrens W:Establishment of a pharmacoepidemiological database in Germany: methodological potential, scientific value and practical limitations.Pharmacoepidemiol Drug Saf2008,17:215–223. 7. Lindemann C, Langner I, Kraut AA, Banaschewski T, Schad-Hansjosten T,
Petermann U, Petermann F, Schreyer-Mehlhop I, Garbe E, Mikolajczyk RT: Age-specific prevalence, incidence of new diagnoses, and drug treatment of attention-deficit/hyperactivity disorder in Germany.J Child Adolesc Psychopharmacol2012,22:307–314.
8. Garbe E, Suling M, Kloss S, Lindemann C, Schmid U:Linkage of mother-baby pairs in the German Pharmacoepidemiological Research Database. Pharmacoepidemiol Drug Saf2011,20:258–264.
9. Kraut AA, Langner I, Lindemann C, Banaschewski T, Petermann U, Petermann F, Mikolajczyk RT, Garbe E:Comorbidities in ADHD children treated with methylphenidate: a database study.BMC Psychiatry2013,13:11. 10. Kraut AA, Schink T, Schulze-Rath R, Mikolajczyk RT, Garbe E:Incidence of
anogenital warts in Germany: a population-based cohort study.BMC Infect Dis2010,10:360.
11. The Unmet Obstetric Need network. Tackling Unmet Need for Major Obstetric Interventions Concepts, General Principles and International Network, http:// www.uonn.org/pdf/Guide1.pdf [accessed on March, 10th, 2013]. 12. Bragg F, Cromwell DA, Edozien LC, Gurol-Urganci I, Mahmood TA,
Templeton A, van der Meulen JH:Variation in rates of caesarean section among English NHS trusts after accounting for maternal and clinical risk: cross sectional study.BMJ2010,341:c5065.
13. Hanley GE, Janssen PA, Greyson D:Regional variation in the cesarean delivery and assisted vaginal delivery rates.Obstet Gynecol2010,115:1201. 14. O'Leary CM, de Klerk N, Keogh J, Pennell C, de Groot J, York L, Mulroy S,
Stanley FJ:Trends in mode of delivery during 1984–2003: can they be explained by pregnancy and delivery complications?BJOG2007,114:855. 15. Ford J, Grewal J, Mikolajczyk R, Meikle S, Zhang J:Primary cesarean
delivery among parous women in the United States, 1990–2003.Obstet Gynecol2008,112:1235–1241.
doi:10.1186/1471-2393-13-99