Open Access
Proceedings
Comparison of multipoint linkage analyses for quantitative traits in
the CEPH data: parametric LOD scores, variance components LOD
scores, and Bayes factors
Yun Ju Sung
1, Yanming Di
2, Audrey Q Fu
2, Joseph H Rothstein
1, Weiva Sieh
1,
Liping Tong
2, Elizabeth A Thompson
2and Ellen M Wijsman*
1,3Address: 1Division of Medical Genetics, Department of Medicine, University of Washington, Box 357720, Seattle, Washington 98195-7720, USA, 2Department of Statistics, University of Washington, Box 354322, Seattle, Washington 98195-4322, USA and 3Department of Biostatistics,
University of Washington, Box 357232, Seattle, Washington 98195-7232, USA
Email: Yun Ju Sung - [email protected]; Yanming Di - [email protected]; Audrey Q Fu - [email protected]; Joseph H Rothstein - [email protected]; Weiva Sieh - [email protected]; Liping Tong - [email protected]; Elizabeth A Thompson - [email protected]; Ellen M Wijsman* - [email protected]
* Corresponding author
Abstract
We performed multipoint linkage analyses with multiple programs and models for several gene expression traits in the Centre d'Etude du Polymorphisme Humain families. All analyses provided consistent results for both peak location and shape. Variance-components (VC) analysis gave wider peaks and Bayes factors gave fewer peaks. Among programs from the MORGAN package, lm_multiple performed better than lm_markers, resulting in less Markov-chain Monte Carlo (MCMC) variability between runs, and the program lm_twoqtl provided higher LOD scores by also including either a polygenic component or an additional quantitative trait locus.
Background
Our aims were 1) to compare results from several multipoint linkage analysis programs that are available for quantitative traits and 2) to investigate the perform-ance of MCMC-based programs on the GAW15 expres-sion data in 14 three-generation CEPH families genotyped for clustered SNP markers [1]. We used three recently developed programs in the MORGAN package [2]: lm_markers, lm_multiple, and lm_twoqtl. These pro-grams provide MCMC-based parametric LOD score anal-ysis, the first two with a one-QTL (1Q) model and the last
with more complex models, including a second linked (2Q) or unlinked (UQ) QTL and/or a polygenic compo-nent (P). In addition, we used Loki [3] for Bayesian oligo-genic analysis and Merlin [4] for VC analysis. These analyses cover most approaches that fully use quantitative trait data from three-generation pedigrees.
Methods
Phenotypes used
For 62 traits previously reported to show evidence of link-age [5,6], we performed genome-wide VC analysis and from Genetic Analysis Workshop 15
St. Pete Beach, Florida, USA. 11–15 November 2006
Published: 18 December 2007
BMC Proceedings 2007, 1(Suppl 1):S93
<supplement> <title> <p>Genetic Analysis Workshop 15: Gene Expression Analysis and Approaches to Detecting Multiple Functional Loci</p> </title> <editor>Heather J Cordell, Mariza de Andrade, Marie-Claude Babron, Christopher W Bartlett, Joseph Beyene, Heike Bickeböller, Robert Culverhouse, Adrienne Cupples, E Warwick Daw, Josée Dupuis, Catherine T Falk, Saurabh Ghosh, Katrina A Goddard, Ellen L Goode, Elizabeth R Hauser, Lisa J Martin, Maria Martinez, Kari E North, Nancy L Saccone, Silke Schmidt, William Tapper, Duncan Thomas, David Tritchler, Veronica J Vieland, Ellen M Wijsman, Marsha A Wilcox, John S Witte, Qiong Yang, Andreas Ziegler, Laura Almasy and Jean W MacCluer</editor> <note>Proceedings</note> <url>http://www.biomedcentral.com/content/pdf/1753-6561-1-S1-info.pdf</url> </supplement>
This article is available from: http://www.biomedcentral.com/1753-6561/1/S1/S93
© 2007 Sung et al; licensee BioMed Central Ltd.
obtained the maximum likelihood estimate (MLE) of her-itability (h2). We chose six traits that showed high VC LOD scores and h2 ≥ 0.31: CHI3L2, GSTM1, PSPH, VAMP8, PPAT, and TM7SF3. The first two of these had only a single peak with VC LOD > 3, representing poten-tially simple traits, and the latter four had multiple peaks, representing potentially complex traits. For these six traits, we performed Bayesian oligogenic joint segregation and linkage analyses using Loki and parametric LOD score analysis with a 1Q model using lm_markers and lm_multiple. For the first four traits only, we also per-formed parametric LOD score analysis with more com-plex models using lm_twoqtl.
Genetic map and marker data
We used the Rutgers map [7] for linkage analysis. We con-verted Kosambi map positions to Haldane map positions for analysis, although for ease of comparison with other GAW contributions we present all results on a Kosambi scale. We also constructed a jittered map by adding 0.01 cM between markers with identical positions on this map. We excluded sex chromosomes and used the sex-averaged jittered map for all our linkage analyses because neither MORGAN nor Loki allows multiple markers at the same position. For the VC analysis, we also used the nonjittered map as a comparison. We used Merlin to identify all Men-delian-inconsistent genotypes (69 marker-family combi-nations) and any obligate recombinations within each cluster (166 cluster-family, or 508 marker-family combi-nations), where a cluster is defined as a set of markers that have the same Rutgers map position. We coded these markers as missing genotypes in all members of the fami-lies with an apparent error.
Segregation and linkage analyses
For the 62 traits, we performed genome-wide VC linkage analysis with Merlin for both the jittered and original nonjittered maps. VC LOD scores were computed only at the marker positions. We also obtained MLEs of h2 for these 62 traits with a VC polygenic model [8]. Using Mer-lin, we obtained MLEs of marker allele frequencies, which we used in all linkage analyses.
For the six traits, we performed Bayesian oligogenic segre-gation analysis and oligogenic joint segresegre-gation and link-age analysis using Loki. For segregation analysis, we used every fourth iteration in a 50 k iteration run to estimate QTL models. For linkage analysis, we used every fourth iteration in a 999 k iteration run to compute Bayes factors for presence versus absence of a QTL in each 2-cM bin. We used QTL models estimated from Bayesian segregation analysis in all our LOD score analyses.
We recently developed three programs in MORGAN: lm_markers, lm_multiple, and lm_twoqtl. The first two
programs compute LOD scores for the 1Q model, and lm_twoqtl computes LOD scores for more complex mod-els [9]. In addition to its MCMC-based approach, lm_markers now can also provide exact computation of LOD scores for small pedigrees with many markers. No other programs provide parametric LOD scores for quan-titative traits with many markers. The program lm_multiple differs from lm_markers only in that, instead of updating only one meiosis at a time, it uses an improved sampler that simultaneously updates either a randomly chosen subset of up to eight meioses or a possi-bly larger subset of meioses in closely related individuals, such as siblings [10]. This multiple-meiosis updating can improve estimates of LOD scores, particularly for data with large sibships. Finally, lm_twoqtl provides LOD scores with models that include additional linked or unlinked QTLs and a polygenic component. Incorporat-ing better modelIncorporat-ing of complex traits into linkage analysis can provide higher LOD scores and better localization for complex traits [9].
Results
VC LOD scores and heritabilities for the 62 traits
Of the 62 traits, 24 had a VC LOD score ≥ 3, with h2 rang-ing from 0.13 to 0.86. Five traits had a maximum VC LOD score < 1, with h2 ranging from 0 to 0.11. Most traits had only a single peak in the genome with VC LOD ≥ 3, sug-gesting a simple mode of inheritance. Two traits (PSPH
and DDX17) had three peaks with VC LOD ≥ 3, and three traits (PPAT, HSD17B12, TUBG1) had two peaks with VC LOD ≥ 3. The jittered and nonjittered maps yielded virtu-ally identical VC LOD scores, except for VAMP8 on chr 2, where the largest peak was slightly narrower with the non-jittered map.
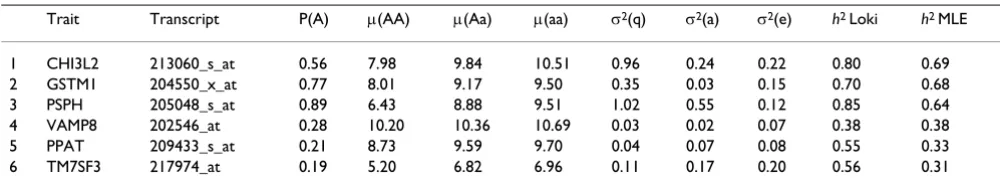
We chose the six traits CHI3L2, GSTM1, PPAT, PSPH,
TM7SF3, and VAMP8 for further analysis. The actual loca-tions of these genes were at the maximum VC LOD scores (CHI3L2, GSTM1, PSPH), 10 cM away (VAMP8), or 25 cM away (PPAT). Bayesian oligogenic segregation analysis for these traits provided posterior mean numbers of QTLs ranging from 2 to 3.5. Estimation of the primary QTL model was relatively straightforward (Table 1), whereas the secondary or weaker QTL models were less obvious. Heritabilities estimated from Bayesian oligogenic segrega-tion analysis were sometimes higher than MLEs of h2 obtained from a VC polygenic model. This is not surpris-ing because VC analysis with Merlin uses only additive genetic variance, thus providing only narrow-sense herita-bilities, whereas Loki allows for dominance effects, thus providing larger broad-sense heritabilities.
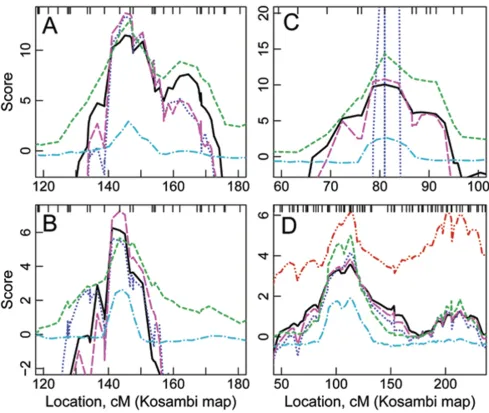
Bayes factors using an oligogenic model for the 6 traits Bayes factors generally matched the VC LOD scores in both peak location and general shape (Figure 1, Table 2), with two minor differences. First, Bayes factors provided much narrower peaks than did VC LOD scores. Second, Bayes factors did not provide several modest peaks that were obtained with VC analysis. For PSPH, Bayes factors did not provide evidence of linkage on chr 2, whereas VC LOD scores provided bimodal peaks with VC LODs of 2.6 and 2.8. Also, Bayes factors did not confirm a secondary peak obtained by VC analysis on chr 8 for PSPH and chr 2 for VAMP8. The primary QTL model estimated from
seg-regation analysis almost always appeared on the chromo-somes with the strongest linkage signals. The traits with support for linkage to more than one chr are: PSPH with a strong signal on chr 7 (Fig. 1C) and a modest signal on chr 8, TM7SF3 with moderate signals on both chr 2 and chr 12, and VAMP8 with a strong signal on chr 2 (Fig. 1D) and a weaker signal on chr 4.
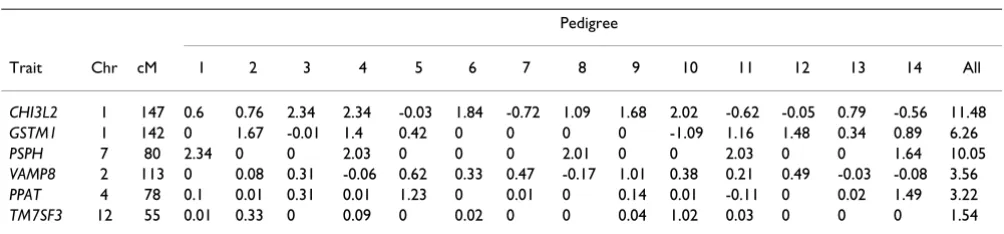
LOD scores using a one-QTL model for the six traits Model-based LOD scores matched VC LOD scores in both peak location and general shape (Fig. 1, Table 2). The only minor difference was that the model-based LOD score did not provide a third peak between the two peaks that the VC LOD score provided for TM7SF3 on chr 12. For most traits several of the 14 pedigrees were almost uninforma-tive for linkage, the model giving negligible probability that the QTL was segregating in the pedigree (Table 3). For
PSPH, the low trait allele frequency led to 9 of the 14 ped-igrees being uninformative.
For all six traits, lm_multiple runs with 3 k scans provided better results than lm_markers runs with 30 k scans. Com-putation time for 3 k scans with lm_multiple was about one-third that of 30 k scans with lm_markers (Table 2). In particular, for VAMP8, all 10 lm_multiple runs were an almost perfect match to the exact LOD scores, whereas lm_markers runs with 30 k scans showed moderate run-to-run variation (Fig. 2). For all six traits, lm_multiple showed the smallest run-to-run variation of the LOD scores at the peak (Table 2) as well as elsewhere on the chromosome. Runs of lm_markers with 3 k scans were not much different and showed only slightly more variability from runs with 30 k scans.
LOD scores using more complex models for the four traits More complex trait models lead to higher LOD scores than the 1Q model (Table 2). For GSTM1, the 1Q + P model provided the highest LOD scores (Fig. 1B), while for CHI3L2 and VAMP8, LOD scores for 1Q + UQ and 1Q + P models were almost identical (Fig. 1A, D). For
CHI3L2, the model labeled as 1Q + UQ in Table 2 actually included a polygenic component, i.e., 1Q + UQ + P, which increased the run time significantly. In contrast, for PSPH, Table 1: Oligogenic segregation analysis results
Trait Transcript P(A) μ(AA) μ(Aa) μ(aa) σ2(q) σ2(a) σ2(e) h2 Loki h2 MLE
1 CHI3L2 213060_s_at 0.56 7.98 9.84 10.51 0.96 0.24 0.22 0.80 0.69 2 GSTM1 204550_x_at 0.77 8.01 9.17 9.50 0.35 0.03 0.15 0.70 0.68 3 PSPH 205048_s_at 0.89 6.43 8.88 9.51 1.02 0.55 0.12 0.85 0.64 4 VAMP8 202546_at 0.28 10.20 10.36 10.69 0.03 0.02 0.07 0.38 0.38 5 PPAT 209433_s_at 0.21 8.73 9.59 9.70 0.04 0.07 0.08 0.55 0.33 6 TM7SF3 217974_at 0.19 5.20 6.82 6.96 0.11 0.17 0.20 0.56 0.31 P(A), frequency of allele A; μ(AA), phenotypic mean of genotype AA; σ2(q), variance due to the major QTL; σ2(a), polygenic variance; σ2(e),
the 1Q + UQ model provided strange results, with LOD scores ranging from less than -3000 to 40 (Fig. 1C). This may be due to inaccurate estimation of the secondary QTL model: the combined genetic variance from the two QTLs exceeded the total genetic variance obtained from segrega-tion analysis. For VAMP8, the 2Q model provided two peaks, of equal magnitude (Fig. 1D), resulting from the identical model for both QTLs.
Discussion
We performed several multipoint linkage analyses for quantitative traits: VC, Bayesian oligogenic, and paramet-ric LOD score linkage analysis with 1Q, 1Q + P, 1Q + UQ,
and 2Q models. We found that all of these analyses pro-vided similar inferences about peak location and shape, with some advantage to using the 1Q + P and 1Q + UQ models over the 1Q model. Use of parametric LOD scores also provided insights into genetic heterogeneity of the traits, which was considerable. However, models for QTLs other than the primary QTL were difficult to estimate with the Bayesian approach for these gene expression traits, suggesting the need for better segregation analysis tools for estimating parameters of complex trait models.
We were able to obtain reliable results for analysis with clustered SNPs with several newly-developed MCMC pro-Linkage analyses of 4 traits
Figure 1
grams in MORGAN. We found that lm_multiple provided better estimates of LOD scores than lm_markers with fewer scans in less time although, in general, both pro-grams performed well with only minor differences in the variability between runs. The MCMC performance obtained here is improved relative to our results for GAW14 [11]. Factors in this improvement likely include the use of sequential imputation to obtain starting config-urations [12], less missing data, and different SNP marker maps, in addition to improved algorithms and software. Finally, although our goal here was to compare our devel-oping MCMC-based methods, we advocate use of exact computation when this is practical. On small pedigrees, such as those used here, exact analysis with a 1Q model and lm_markers or with VC methods may be best initially since this is faster than MCMC analysis. Further analyses may use lm_twoqtl, if the evidence warrants it. However, on larger pedigrees, exact multipoint computation may not be possible, in which case these MCMC options are a viable and practical alternative.
Conclusion
We showed that MCMC-based programs from the MOR-GAN package provide accurate LOD scores for quantita-tive traits with SNP markers. The program lm_multiple gives more accurate results than lm_markers, and the
pro-gram lm_twoqtl expands the trait models to include two loci plus a possible polygenic component.
List of Abbreviations
1Q: One QTL
1Q + P: One QTL plus a polygenic component
1Q + UQ: One linked QTL plus one unlinked QTL
2Q: Two linked QTL
CEPH: Centre d'Etude du Polymorphisme Humain
chr: chromosome
GAW: Genetic Analysis Workshop
h2: heritability
MCMC: Markov chain Monte Carlo
MLE: Maximum likelihood estimate
QTL: Quantitative trait locus
Table 3: Exact LOD scores by family at chromosomal locations with the highest overall LOD score
Pedigree
Trait Chr cM 1 2 3 4 5 6 7 8 9 10 11 12 13 14 All
CHI3L2 1 147 0.6 0.76 2.34 2.34 -0.03 1.84 -0.72 1.09 1.68 2.02 -0.62 -0.05 0.79 -0.56 11.48
GSTM1 1 142 0 1.67 -0.01 1.4 0.42 0 0 0 0 -1.09 1.16 1.48 0.34 0.89 6.26
PSPH 7 80 2.34 0 0 2.03 0 0 0 2.01 0 0 2.03 0 0 1.64 10.05
VAMP8 2 113 0 0.08 0.31 -0.06 0.62 0.33 0.47 -0.17 1.01 0.38 0.21 0.49 -0.03 -0.08 3.56
PPAT 4 78 0.1 0.01 0.31 0.01 1.23 0 0.01 0 0.14 0.01 -0.11 0 0.02 1.49 3.22
TM7SF3 12 55 0.01 0.33 0 0.09 0 0.02 0 0 0.04 1.02 0.03 0 0 0 1.54
Table 2: Highest LOD score or log (Bayes factor) and run time (in minutes)
CHI3L2 147 cM (chr 1)a GSTM1 142 cM (chr 1) PSPH 80 cM (chr 7) VAMP8 113 cM (chr 2)
Model Program Scans Statb Time Stat Time Stat Time Stat Time
1Q Exact NA 11.5 1229 6.3 1234 10.1 470 3.6 1044 lm_multiple 3 k 11.3–11.5 44 6.2–6.3 45 9.9–10.1 33 3.6–3.6 43 lm_markers 3 k 10.7–11.6 21 5.7–6.3 21 8.1–10.3 13 3.5–3.6 20 lm_markers 30 k 10.6–11.6 177 5.7–6.3 168 8.1–10.1 110 3.2–3.6 153 1Q + P lm_twoqtl 30 k 13.7 563 7.2 604 10.8 401 3.8 535 1Q + UQ lm_twoqtl 3 k 13.4 3568 5.6 816 40.4 542 4.1 808 VC Merlin NA 13 2 5.7 2 14.3 1 5 2 Bayesian Loki 999 k 2.9 707 2.6 700 2.6 504 1.9 513
apeak position (± 1 cM) from all analyses and gene location except VAMP8 (120–123 cM).
bMORGAN and VC programs, the statistic (stat) is the LOD score with range (min and max) over 10 runs and time is the median of 10 runs for
Publish with BioMed Central and every scientist can read your work free of charge "BioMed Central will be the most significant development for disseminating the results of biomedical researc h in our lifetime."
Sir Paul Nurse, Cancer Research UK
Your research papers will be:
available free of charge to the entire biomedical community
peer reviewed and published immediately upon acceptance
cited in PubMed and archived on PubMed Central
yours — you keep the copyright
Submit your manuscript here:
http://www.biomedcentral.com/info/publishing_adv.asp
BioMedcentral SNP: Single-nucleotide polymorphism
VC: Variance components
Competing interests
The author(s) declare that they have no competing inter-ests.
Acknowledgements
Supported by NIH grants AG14382, AG05136, AG21544, AG11762, HL30086, GM46255, and HD35465.
This article has been published as part of BMC Proceedings Volume 1 Sup-plement 1, 2007: Genetic Analysis Workshop 15: Gene Expression Analysis and Approaches to Detecting Multiple Functional Loci. The full contents of the supplement are available online at http://www.biomedcentral.com/ 1753-6561/1?issue=S1.
References
1. Cheung VG, Spielman RS: Data for Genetic Analysis Workshop 15 (GAW15), Problem 1: genetics of gene expression in humans. BMC Proc 2007, 1(Suppl 1):S2.
2. MORGAN [http://www.stat.washington.edu/thompson/Genepi/ genepi.shtml]
3. Heath SC: Markov chain Monte Carlo segregation and linkage analysis for oligogenic models. Am J Hum Genet 1997, 61:748-760.
4. Abecasis GR, Cherny SS, Cookson WO, Cardon LR: Merlin-rapid analysis of dense genetic maps using sparse gene flow trees. Nat Genet 2002, 30:97-101.
5. Morley M, Molony CM, Weber TM, Devlin JL, Ewens KG, Spielman RS, Cheung VG: Genetic analysis of genome-wide variation in human gene expression. Nature 2004, 430:743-747.
6. Cheung VG, Spielman RS, Ewens KG, Weber TM, Morley M, Burdick JT: Mapping determinants of human gene expression by
regional and genome-wide association. Nature 2005, 437:1365-1369.
7. Rutgers map (build 35) [http://compgen.rutgers.edu/maps/ b35.shtml]
8. Sung YJ, Dawson G, Munson J, Estes A, Schellenberg GD, Wijsman EA: Genetic investigation of quantitative traits related to autism: use of multivariate polygenic models with ascertain-ment adjustascertain-ment. Am J Hum Genet 2005, 76:68-81.
9. Sung YJ, Thompson EA, Wijsman EM: MCMC-based linkage ysis for complex traits on general pedigrees: multipoint anal-ysis with a two-locus model and a polygenic component. Genet Epidemiol 2007, 31:103-114.
10. Tong L, Thompson EA: Multilocus LOD scores in large pedi-grees: combination of exact and approximate calculations. Hum Hered 2007 in press.
11. Sieh W, Basu S, Fu AQ, Rothstein JH, Scheet PA, Stewart WC, Sung YJ, Thompson EA, Wijsman EM: Comparison of marker types and map assumptions using Markov chain Monte Carlo-based linkage analysis of COGA data. BMC Genet 2005, 6(Suppl 1):S11.
12. Wijsman EM, Rothstein JH, Thompson EA: Multipoint linkage analysis with many multiallelic or dense diallelic markers: Markov chain-Monte Carlo provides practical approaches for genome scans on general pedigrees. Am J Hum Genet 2006, 79:846-858.
Linkage analyses of VAMP8 on chromosome 2 using 1Q model
Figure 2