P R O C E E D I N G S
Open Access
Linkage analysis merging replicate phenotypes:
an application to three quantitative phenotypes
in two African samples
Anthony L Hinrichs
1*, Robert C Culverhouse
2,3, Brian K Suarez
1,4From
Genetic Analysis Workshop 17
Boston, MA, USA. 13-16 October 2010
Abstract
We report two approaches for linkage analysis of data consisting of replicate phenotypes. The first approach is specifically designed for the unusual (in human data) replicate structure of the Genetic Analysis Workshop 17 pedigree data. The second approach consists of a standard linkage analysis that, although not specifically tailored to data consisting of replicate genotypes, was envisioned as providing a sounding board against which our novel approach could be assessed. Both approaches are applied to the analysis of three quantitative phenotypes (Q1, Q2, and Q4) in two sets of African families. All analyses were carried out blind to the generating model (i.e., the “answers”). Using both methods, we found numerous significant linkage signals for Q1, although population colocalization was absent for most of these signals. The linkage analysis of Q2 and Q4 failed to reveal any strong linkage signals.
Background
The simulated mini-exome data for Genetic Analysis Workshop 17 were derived from the pilot3 study of the 1000 Genomes Project (http://www.1000genomes.org). The data consist of information on 3,205 genes contain-ing 24,487 scontain-ingle-nucleotide polymorphisms (SNPs) on 697 unrelated individuals drawn from 7 population sam-ples. The family data consist of 8 extended pedigrees (varying in size from 73 to 128 individuals), also with a total of 697 individuals. The pedigrees were seeded with 202 founders, who were described as having been drawn at random from the 697 unrelated individuals. Two hundred replicates were provided for both the unrelated individuals data set and the family data set. A note-worthy feature of these data is that the SNP genotypes from replicate to replicate are identical. In other words, for any given individual over all replicates, each person is represented as though he or she is one of 200 mono-zygotic twins.
Because of the unusual nature of the data sets, we elected to explore an innovative approach that takes into account the data’s replicate structure. As a comple-ment to this approach, we also carried out an old-fash-ioned linkage analysis that does not take into account the fact that the families are not genetically independent from one replicate to another.
Because our analyses were blind to the generating model, we began our investigation by obtaining some descriptive statistics. We started with the genotypes of the N= 697 unrelated individuals and quickly discov-ered that a large proportion (38.5%) of the 24,487 SNPs have a frequency of 1/(2N); that is, only one copy of the variant exists in the entire set of unrelated individuals, and fully 87.2% have a minor allele frequency less than 5.0%. Under usual circumstances, this collection of SNPs would have such a low polymorphic information content as to render ordinary linkage analysis powerless to identify genes involved in the quantitative phenotypes of interest. Fortunately for the family data set, the data simulators provided fully informative identity-by-descent (IBD) matrices for each pair of individuals at each gene. These IBD scores were given as 0, 0.5, and 1, denoting
* Correspondence: [email protected]
1
Department of Psychiatry, Washington University School of Medicine, 660 South Euclid Ave., Campus Box 8134, St. Louis, MO 63110, USA
Full list of author information is available at the end of the article
the sharing of 0, 1, or both genes identical by descent. Both methodological approaches reported here used these IBD matrices exclusively for the linkage analyses.
We note that in the process of simulation, recombina-tion could occur only once per chromosome per meiosis and that this recombination could not occur within a gene. This allows us to refer to IBD at a particular gene. In real data, we would not have perfect information, although with extensive genotyping and sequencing we would be able to approach this. Recombination within a gene is also possible, although it is less likely than in the larger intergenic regions. Furthermore, a multipoint ana-lysis is unnecessary because the single point information is completely informative.
Before performing the linkage analyses, we began by making sure that the data had the properties we expected. We believe that this is an important but often neglected step for both real and simulated data. While attempting to identify the population origin of the 202 founders of the 8 pedigrees, we discovered to our sur-prise that 4,239 SNPs had been altered, although these alterations did not prevent the unambiguous identity and population origin of the founders. We were even more surprised to discover that the founders were not a random sample from the unrelated individuals data set. Instead, all but three of the founders were drawn from the two African samples. Moreover, three of the eight pedigrees were established by approximately equal num-bers of founders from the Yoruba and the Luhya popu-lation samples. The remaining five pedigrees were primarily founded by one ethnic group or the other. Under ordinary circumstances when using genetic mar-kers for a linkage analysis, it is more cumbersome to analyze families composed of individuals drawn from various ethnic groups because differences in allele fre-quencies need to be taken into account (see Suarez et al. [1] for an example of combining families of different ancestries in a linkage analysis). Using IBD matrices somewhat obviates this problem, although the possibility looms large that different ancestral populations may be segregating different causative genes.
Accordingly, we decided to concentrate our attention on two groups of kindreds: (A) pedigree 2 (deleting founder 2005 [a Tuscan] and all of her descendants), pedigree 3, and pedigree 4 (deleting founder 4021 [a Yoruba] and all of her descendants); and (B) pedigrees 5 and 6. Individuals in kindred group A are all sampled from the Luhya population, a Bantu ethnic group living primarily in Kenya. It is unclear whether the Luhya sam-ple from the 1000 Genomes Project was randomly sampled from all of the 16 tribes that make up the Luhya ethnic group or from a smaller subset. Individuals in kindred group B are all Yoruba, a large heterogeneous
group of about 30 million people from West Africa, predominantly Nigeria.
Methods
The unusual structure of the data replicates (varying covariates but a constant genetic structure) led us to generate a novel quantitative phenotype from the data as our target of analysis. For a typical variance compo-nents linkage analysis, we control for covariates by using the residual after linear regression as a quantitative phe-notype. In the linear regression, we model the trait as:
Y = +a βTx+γTg+e, (1)
where a is the global mean value of the trait, b is a vector representing the linear effect sizes of the covari-ates (x),gis a vector representing the linear effect sizes of true (but unknown) causative genetic variants (g), andεrepresents the sum of all other factors. Typically, we analyze:
Yresidual = −Y
(
aˆ+bˆTx)
=‡Tg+ = +e G e (2)as the quantitative phenotype, where aˆ and bˆ, the maximum-likelihood estimators (MLEs) of the para-meters a and b, are computed from the data andG represents the sum of the genetic contributions to the phenotype.
For our analysis, we treated the observations of an individual across multiple data replicates as repeated measures. To do this, we used the framework of a gen-eralized linear mixed model (GLMM) as implemented in PROC GLIMMIX in SAS 9.2 [2] to estimate the MLEs aˆ′ and bˆ′ that take the repeated measures into account. As a result, the derived phenotype we used for analysis had a single value for each individualigiven by:
′ = −
(
′ + ′)
= ′ +Yi Yi aˆ bˆTxi Gi ei. (3)
In this way, each unique genetic observation is counted only once in the analysis, but full information from the repeated measures is used.
Results
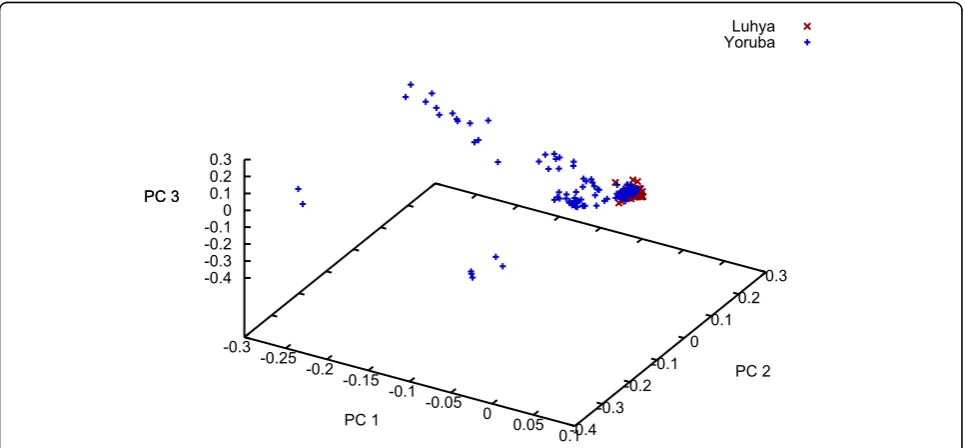
We carried out an Eigenstrat analysis [5] using all 24,487 SNPs from the unrelated individuals sample. We observed the expected separation between the broad geographic groups (data not shown). Given the debate surrounding Entine’s [6] controversial book that points out that virtually all the endurance marathon records are held by East Africans while virtually all the shorter speed records are held by West Africans, we were inter-ested to see the degree of clustering between just the Luhya sample and the Yoruba sample (Figure 1). As can be seen, the Luhya sample is tightly clustered for the first three principal components, whereas the Yoruba sample is much more spread out. (By comparison, the two Chinese samples and the Japanese sample are vir-tually identical [data not shown].)
We applied our two approaches to the first 50 repli-cates for which SOLAR obtained a convergent solution. The significant results (defined asp< 10−4 from either method) are reported in Table 1. After receiving the simulation parameters, we divided these into true posi-tives and false posiposi-tives. For the traditional linkage ana-lysis approach, we list the median p-value from the individual replicates, the range of p-values, and the p-value obtained by combining the data from the families across the 50 replicates (i.e., an analysis based on a sam-ple 50 times the size of a single replicate,N= 20,000). The novel repeated measures analysis (performed using the GLMM) is an analysis based on only the individuals from a single replicate (N= 400), but it uses the infor-mation from 50 repeated measures of each trait to
provide a more accurate estimate of the total genetic lia-bility for each individual.
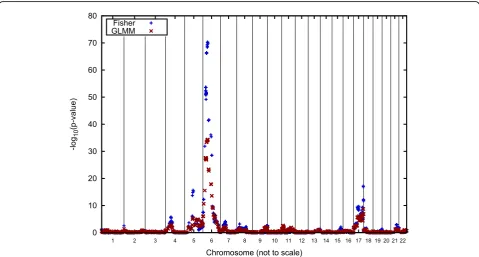
Figures 2 and 3 graphically report the linkage results for Q1 for the Luhya and Yoruba samples, respectively. Note that these analyses are based on 150 replicate ped-igrees for the Luhya sample and 100 replicate pedped-igrees for the Yoruba sample. Also, because we used the IBD matrices for our single-point analyses, no inference regarding the strength of a linkage signal is made for regions in between the actual genomic positions of the genes.
A striking result of our analyses is the lack of colocali-zation of linkage signals between the two African groups. Moreover, the maximum signal is often a pla-teau that occurs over a region of a number of contigu-ous genes. This appears to be an artifact of the simulation, which allowed only a single recombination per chromosome for each meiosis. Consequently, the position of the recombinations is constant for all of the replicates.
Figures 2 and 3 indicate that the linkage signals obtained with Fisher’s method tend to be higher than those obtained using the GLMM, which, we speculate, is due to the fact that Fisher’s method treats the identical genotypic structure of the 50 replicates as independent observations.
Discussion and conclusions
The most striking feature revealed by our linkage analy-sis of the quantitative trait Q1 is that, with one possible exception, none of the five signals seen in the Luhya
-0.3
sample colocalize with any of the four signals found in the Yoruba sample. The exception is the signal seen on chromosome 8 at CDCA2, although only the Yoruba signal is highly significant. Had we analyzed each of the
three Luhya pedigrees and each of the two Yoruba pedi-grees separately, we would have found family-specific signals, all of which would have been stronger than those reported in Table 1 because of our pooling of Table 1 True positives and false positives from Fisher’s method and GLMM analyses
Trait Gene Chromosome Position Families GLMM analysis, Fisher’s method,
−log10(p-value) −log10(p-value)
Combined Min–max Median
True positives
Q1 VEGFA 6 43,846,955 Luhya 34.30 70.23 0.78–4.95 2.33
Q1 FLT1 13 27,775,331 Yoruba 20.85 30.56 0.00–3.47 1.42
Q1 KDR 4 55,650,982 Luhya 2.91 5.39 0.00–3.36 0.65
Q1 VEGFC 4 177,845,572 Yoruba 3.50 4.43 0.00–3.28 0.58
Q2 PLAT 8 42,152,676 Luhya 5.39 4.12 0.00–1.88 0.65
Q2 SREBF1 17 17,658,674 Yoruba 4.65 2.44 0.00–2.87 0.45
False positives
Q1 LAMB3 1 207,855,310 Yoruba 1.69 5.07 0.00–2.62 0.67
Q1 VCAN 5 82,868,901 Luhya 5.25 15.64 0.00–5.64 1.03
Q1 UPP1 7 48,100,910 Luhya 2.12 4.12 0.00–3.53 0.43
Q1 LMTK2 7 97,660,051 Yoruba 2.76 4.88 0.00–3.98 0.55
Q1 CDCA2 8 24,830,588 Yoruba 5.41 12.10 0.00–3.52 0.73
Q1 WDR40A 9 34,097,504 Yoruba 3.40 4.88 0.00–3.40 0.49
Q1 PPP2R4 9 130,913,706 Yoruba 2.87 4.08 0.00–2.88 0.47
Q1 NPTX1 17 76,060,297 Luhya 8.71 17.20 0.00–3.81 1.11
Q4 LOC643659 20 20,004,221 Luhya 0.89 4.29 0.00–3.15 0.49
Q4 RNF145 5 159,708,779 Yoruba 4.52 0.65 0.00–2.51 0.00
0 10 20 30 40 50 60 70 80
1 2 3 4 5 6 7 8 9 10 11 12 13 14 15 16 17 18 19 20 21 22
-log
10
(p-value)
Chromosome (not to scale) Fisher
GLMM
pedigrees from the two ethnic groups. Clearly, for pri-vate polymorphisms or in cases of locus heterogeneity (see, e.g., Morton [7] for the first published example of locus heterogeneity documented by a linkage analysis), linkage analysis of individual families often is preferable to combining all families from a single ethnic group, as we originally did. Indeed, Culverhouse et al. [8], analyz-ing the unrelated individuals data set, also found that pooling populations could obscure a strong signal even when Population was included as a covariate.
Our Eigenstrat analysis of just the two African sam-ples from the unrelated individuals file (Figure 1) sug-gests much greater genetic similarity among the Luhya sample than among the Yoruba sample. One possible reason for the apparent heterogeneity of the Yoruba sample is their ancestors’involvement in the slave trade. Indeed, the Yoruba were one of the largest African groups enslaved and taken by Europeans to the New World, especially Cuba.
It would be naïve to expect any single method to pin-point all the genetic factors that were simulated, espe-cially for private polymorphisms (i.e., polymorphisms found only in a single family or ethnic group). For instance, Hill et al. [9] recently were able to localize a linkage signal for pleuropulmonary blastoma on the basis of a few small families. However, it took a different method (sequencing) to identify the lesions in the responsible gene (DICER1).
The linkage results for Q2 and Q4 (not shown in the fig-ures) did not produce any compelling evidence for the involvement of a well-demarked chromosomal region for these phenotypes. Fisher’s method identified a modest true positive for Q2 on chromosome 8 atPLATand a modest false positive for Q4 on chromosome 20 atLOC643659. Similarly, the GLMM identified modest true positives for Q2 at SREBF1on chromosome 17 and at PLATand a modest false positive for Q4 on chromosome 5 atRNF145. Other analyses by our group [8] indicate that the four covariates (Sex, Age, Smoking status, and Population) are highly significant for Q4 and explain a large propor-tion of the variance of Q4. (Over all 200 unrelated repli-cates, the mean R2 is 0.787 with a range of 0.759– 0.811.) We concluded that Q4 was primarily environ-mentally determined but that the generating model did include unlinked heritable factors.
Although we correctly located most of the simulated signals for Q1, we also found a number of false-positive signals (Table 1). Two of these (the regions on chromo-somes 7 and 9) attainedp-values of approximately 10−4, which normally would not be considered strong evi-dence of linkage. The other two signals (on chromo-somes 8 and 17), however, would be considered persuasive evidence of linkage if the families were independent.
We selected the best localized of the two stronger signals and conducted a post hoc analysis of the
0 5 10 15 20 25 30 35
1 2 3 4 5 6 7 8 9 10 11 12 13 14 15 16 17 18 19 20 21 22
-log
10
(p-value)
Chromosome (not to scale) Fisher
GLMM
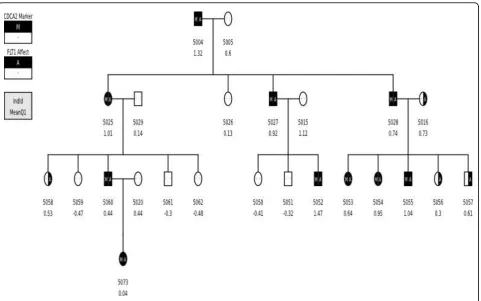
false-positive signal (i.e., the signal centered over CDCA2 on chromosome 8) to determine whether there was a reasonable explanation for this strong false-positive finding obtained in the SOLAR analysis. Briefly, we found that this false-positive signal resulted from a chance deviation from random segre-gation between the A SNP at C8S775 in CDCA2(the false-positive signal on chromosome 8) and the C SNP at C13S434 in FLT1 (a true signal on chromo-some 13). Eighteen informative meioses involving these two SNPs were observed in the Yoruba kindred (pedigree 5) responsible for this false-positive signal (Figure 4). Under the hypothesis of linkage between the SNPs at C8S775 and C13S434, these meioses give rise to 15 nonrecombinants (NR) and 3 recombinants (R). Although this deviation from the null expectation of 9NR:9R is marginally significant by a one-sided Fisher’s exact test (p = 0.0375), it is not persuasive evidence in a linkage setting. However, when 50 mar-ker-identical families are pooled, this minor nonran-dom segregation is telescoped into 750NR:150R, which is a highly significant deviation from the 450NR:450R expected under the hypothesis of no linkage. We believe this is the explanation of the false-positive signal at CDCA2.
Finally, we note that the present situation does not reflect any situation observed in human genetics. How-ever, these analyses are appropriate for plant and animal genetics. In particular, homozygous inbred strains and their F1 hybrids offer investigators the ability to observe the characteristics of hundreds of genetically identical organisms in a variety of contexts. Furthermore, the analyses of monozygotic twin data and longitudinal phe-notype data are also amenable to analysis with general-ized linear models.
Acknowledgments
The Genetic Analysis Workshops are supported by National Institutes of Health (NIH) grant R01 GM031575 from the National Institute of General Medical Sciences. Additional support was obtained from the Urological Research Foundation and from NIH grants K01 AA015572, K25 GM069590, R03 DA023166, and IRG-58-010-50 from the American Cancer Society. This article has been published as part ofBMC ProceedingsVolume 5 Supplement 9, 2011: Genetic Analysis Workshop 17. The full contents of the supplement are available online at http://www.biomedcentral.com/1753-6561/5?issue=S9.
Author details
1Department of Psychiatry, Washington University School of Medicine, 660
South Euclid Ave., Campus Box 8134, St. Louis, MO 63110, USA.2Department of Medicine, Washington University School of Medicine, 660 South Euclid Ave., St. Louis, MO 63110, USA.3Division of Biostatistics, Washington University School of Medicine, 660 South Euclid Ave., St. Louis, MO 63110,
USA.4Department of Genetics, Washington University School of Medicine,
660 South Euclid Ave., St. Louis, MO 63110, USA.
Authors’contributions
AH participated in the study design, carried out the analyses, and helped draft the manuscript. RC participated in the study design and helped draft the manuscript. BS participated in the study design and helped draft the manuscript. All authors read and approved the final manuscript.
Competing interests
The authors declare that there are no competing interests.
Published: 29 November 2011
References
1. Suarez BK, Duan J, Sanders AR, Hinrichs AL, Jin CH, Hou C, Buccola NG, Hale N, Weilbaecher AN, Nertney DA,et al:Genomewide linkage scan of 409 European-ancestry and African American families with
schizophrenia: suggestive evidence of linkage at 8p23.3–p21.2 and 11p13.1–q14.1 in the combined sample.Am J Hum Genet2006, 78:315-333.
2. SAS Institute Inc:SAS 9.2.SAS Institute Inc;Cary, NC 2008:.
3. Almasy L, Blangero J:Multipoint quantitative trait linkage analysis in general pedigrees.Am J Hum Genet1998,62:1198-1211.
4. Province MA:The significance of not finding a gene.Am J Hum Genet 2001,69:660-663.
5. Price AL, Patterson NJ, Plenge RM, Weinblatt ME, Shadick NA, Reich D: Principal components analysis corrects for stratification in genome-wide association studies.Nat Genet2006,38:904-909.
6. Entine J:Taboo: why black athletes dominate sports and why we are afraid to talk about it.New York, Public Affairs; 2000.
7. Morton NE:The detection and estimation of linkage between the genes for elliptocytosis and the Rh blood type.Am J Hum Genet1956,8:80-96. 8. Culverhouse R, Hinrichs AL, Suarez BK:Stratify or adjust? Dealing with
multiple populations when evaluating rare variants.BMC Proc2011, 5(suppl 9):S101.
9. Hill DA, Ivanovich J, Priest JR, Gurnett CA, Dehner LP, Desruisseau D, Jarzembowski JA, Wikenheiser-Brokamp KA, Suarez BK, Whelan AJ,et al:
DICER1mutations in familial pleuropulmonary blastoma.Science2009, 325:965.
doi:10.1186/1753-6561-5-S9-S81
Cite this article as:Hinrichset al.:Linkage analysis merging replicate phenotypes: an application to three quantitative phenotypes in two African samples.BMC Proceedings20115(Suppl 9):S81.
Submit your next manuscript to BioMed Central and take full advantage of:
• Convenient online submission
• Thorough peer review
• No space constraints or color figure charges
• Immediate publication on acceptance
• Inclusion in PubMed, CAS, Scopus and Google Scholar
• Research which is freely available for redistribution