R E S E A R C H
Open Access
Cluster tree topology construction method
based on PSO algorithm to prolong the
lifetime of ZigBee wireless sensor networks
Yang Yu
*, Bo Xue, Zhuyang Chen and Zhiwen Qian
Abstract
For wireless sensor networks (WSNs) based on ZigBee technology, the network topology plays an important role for improving the energy efficiency and the network lifetime. An appropriate construction method of network topology should be designed for saving the energy of the battery in each network node so as to prolong the lifetime of ZigBee WSNs. In this paper, a novel cluster tree topology construction method based on particle swarm optimization (PSO) algorithm is proposed. In order to transform the network topology construction problem into an energy consumption optimization problem, an evaluation function reflecting the network energy consumption is designed, and the network topology is mapped into a particle population individual suitable for the PSO algorithm. In order to prolong the network lifetime as long as possible, two network topology reconstruction methods with the PSO algorithm based on fixed and variable energy thresholds are further proposed, respectively. The simulation results show that the proposed methods can prolong the lifetime of ZigBee WSNs effectively.
Keywords:Cluster tree topology, PSO algorithm, ZigBee, Wireless sensor networks, Lifetime
1 Introduction
With the development of information industry, the appli-cation of information technology is more and more exten-sive. Especially with the arrival of the era of big data, the acquisition and processing of massive information has attracted more and more attention. Wireless sensor net-works (WSNs) are a self-organizing network composed of a large number of sensor nodes with functions of informa-tion collecinforma-tion, processing, and transmission. Each sensor node can collect, process, and transmit data in the sensing area, which can cooperate to collect massive information in the target area [1,2]. As one of the key technologies of WSNs, ZigBee technology based on the standard of IE802.15.4 has been widely used in smart home [3], intelli-gent agriculture [4], smart grid [5], health monitoring [6], industrial control [7], and other fields because of its low power consumption, low speed, low cost, and ad hoc net-work characteristics.
There are three types of nodes in ZigBee networks: co-ordinator, router, and end-device [8]. In addition to the
coordinator nodes powered by stable power supply, routers and end-devices are generally powered by dry batteries or storage batteries. The end-devices send data directly or through routers to the coordinator, and the low power characteristic allows it to turn off/turn on the transceiver periodically to save energy. The randomness of data forwarding makes routers have to turn on re-ceivers at all times. Moreover, in application scenarios of WSNs such as industrial and farm, data is collected and transmitted frequently, which causes the routing nodes to consume much energy and premature failure to work because the battery is exhausted. As a result, the net-work is divided into isolated parts which are difficult to connect, and the network life time is greatly reduced
[9, 10]. Therefore, how to use the limited energy to
make WSNs work as long as possible, and reduce the cost of battery has become a hot issue in the current research of WSNs based on the ZigBee technology.
For WSNs with limited energy, a good network top-ology construction method can save a lot of energy, reduce the energy consumption of nodes, and effectively prolong the network lifetime [11]. In recent years, the research on WSN topology control algorithm mainly
© The Author(s). 2019Open AccessThis article is distributed under the terms of the Creative Commons Attribution 4.0 International License (http://creativecommons.org/licenses/by/4.0/), which permits unrestricted use, distribution, and reproduction in any medium, provided you give appropriate credit to the original author(s) and the source, provide a link to the Creative Commons license, and indicate if changes were made.
* Correspondence:[email protected]
ing, such as the low-energy adaptive clustering hierarchy algorithm and hybrid energy-efficient distributed cluster-ing approach, etc. [16,17].
From these research results, it is known that the network topology construction that reduces the num-ber of routers as much as possible is considered to be an effective method for suppressing power con-sumption. In addition, in order to prolong the net-work lifetime, it is important to use the power of all nodes evenly. Currently, there are no good known methods for analyzing the network structure that minimizes the number of routers. Furthermore, it is not possible to study all possible network structures of large-scale networks during processing time. For problems that cannot be solved by graph theory or
combinatorial mathematical analysis, the particle
swarm optimization (PSO) algorithm can find sub-optimal solutions for these problems in real time [18,
19]. Therefore, in this paper, we use the PSO
algorithm to study the construction method of the cluster tree topology for ZigBee WSNs with low power consumption and long network lifetime.
The rest of this paper is organized as follows. The sys-tem model is given inSection 2. InSection 3, the principle
Fig. 1Cluster tree topology of WSNs. This figure shows the simple and typical cluster tree network topology for wireless
sensor networks
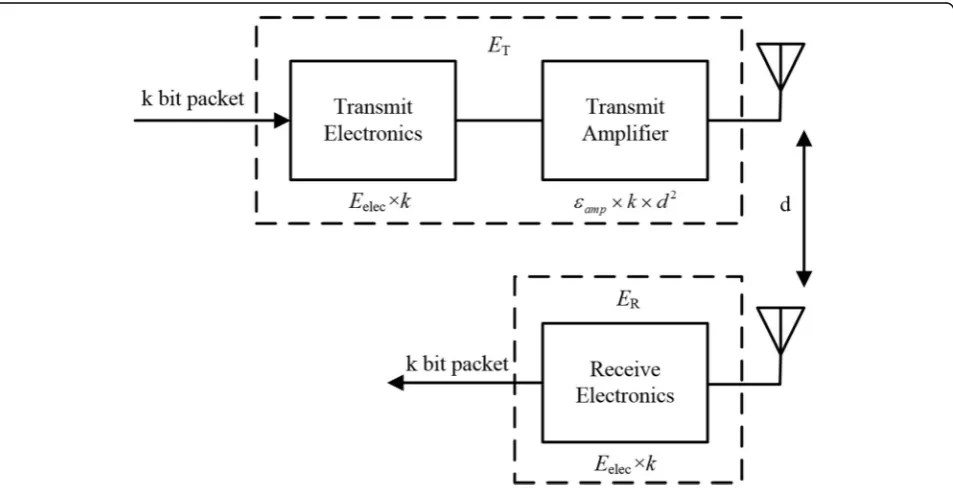
Fig. 2Energy consumption model. This figure shows the first order radio model which is used as the energy consumption model that is considered in this paper.Eelecis the amount of energy required to transmit and receive one bit message, andεampis the amount of energy
of the PSO algorithm is introduced first, and the proposed cluster tree topology construction method based on the PSO algorithm is described in detail. The effectiveness of
the proposed method is examined in Section 4by
com-puter simulation compared from multiple perspectives. Fi-nally,Section 5concludes the paper.
2 Methods
In this paper, the construction method of the network topology for ZigBee WSNs is based on the PSO algo-rithm which is a swarm intelligence algoalgo-rithm. The cost function reflecting the energy consumption of the net-work is fist designed. Then the real number sequence is designed to represent the possible solution of the net-work topology. Thus, the netnet-work topology construction problem studied in this paper is transformed into an
optimization problem that can be solved by PSO algo-rithm. To verify the effectiveness of the proposed scheme, we compare the performance of the proposed scheme with the traditional method in several aspects.
3 System model
3.1 Cluster tree topology
ZigBee-based WSNs have three network topologies: star topology, mesh topology, and cluster tree topology. In a star network since only the range from the central node to one hop can be communicated, the delay time of data transmission is short and collisions hardly occur. On the other hand, there is a disadvantage that the coverage of the network is relatively small and the communication reliability is low because only one-hop communication is possible. The merit of mesh network is that multi-hop
(a)
(b)
Fig. 3Time series of network operation. This figure shows the time series of the operation of WSNs, whereashows the time series of the operation of the end-device,bshows the time series of the operation of the router,Tsis the transmission time,PTis the transmission power,PRis
the reception power, andnis the number of child nodes of the router. Here, the end-device enters a sleep mode when no information is transmitted, while the router waits for a receivable state when no information is transmitted
(a)
(b)
communication can be performed beyond the one-hop limit. In addition, communication reliability can be im-proved by making communication routes redundant. Cluster tree network has strong expansion ability, and has the advantages of star network and mesh network.
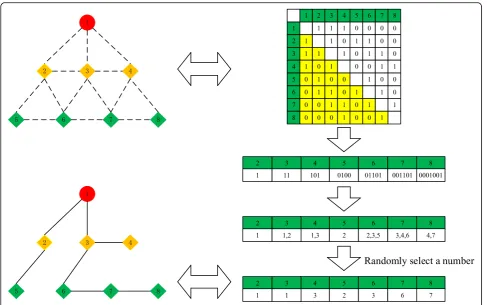
The cluster tree topology mainly used in WSNs is shown in Fig.1. The cluster tree topology differs from the mesh topology in that the relationship between nodes is Fig. 5Particle population initialization. We use the adjacency matrix to generate particles. As shown in Fig.5, nodes that can communicate with each other are first connected by dashed lines to create an adjacency matrix. Here, 1 indicates a connection state, and 0 indicates a non-connection state. Next, the lower left half of the adjacency matrix is taken out and rewritten as one line as shown in Fig.5. Finally, particles can be generated by randomly extracting a number from each part
10 20 30 40 50 60 70 80 90 100[m]
10
20
30
40
50
60
70
80
90
0
0
0
1[
m
]
Fig. 6100 nodes random ZigBee network. This figure shows that 100 nodes are placed in an observation area of 100 m × 100 m to collect information. Nodes are randomly distributed in the observation area, and the information of each node is managed by the coordinator
Table 1Parameters of simulation
Number of nodes 100
Observation area 100 m × 100 m
Node communication radius 30 m
Transmission power 35 mW
Received power 12.5 mW
Communication speed 250 kbps
Amount of information 1000 bits
Round time 30 s
battery capacity 100 J
c1,c2 2,2
population size 200
not equal, and there is a clear parent-child relationship, and it is a pyramidal tree structure. In this structure, the top nodes of the network are the coordinator, the other parent nodes are routers, and the terminal nodes are end-devices. The advantages of cluster tree topology are as follows.
1. Since the network is hierarchical, the delay time of data transmission can be predicted.
2. The router always keeps tracking the status of its own child nodes, and the connection status of the network is aggregated along the tree root. Therefore, the coordinator can easily understand the connection status of the entire network.
On the other hand, there are some disadvantages of cluster tree topology.
1. Since there is only one communication route, sometimes information may not reach the destination node when a communication failure occurs.
2. Because information is aggregated to the coordinator, traffic jams occur closer to the coordinator, and the balance of network resource utilization is not good.
3.2 Energy consumption model
The energy consumption model considered in this paper is the first-order radio model as shown in Fig.2.
Eelec is the amount of energy required to transmit
and receive one bit message, and εamp is the amount
of energy required to amplify the transmitter signal. The energy consumption of transmission and
recep-tion denoted as ET and ER are calculated using (1)
and (2), respectively [20].
ET ¼Eeleckþεampkd2 ð1Þ
ER¼Eeleck ð2Þ
where the amount of communication iskbits and the com-munication radius of the node isdmeters. When the com-munication time istseconds and the communication rate is v [bps], the transmission power PT and the reception powerPRare calculated using (3) and (4), respectively.
PT ¼
It is assumed that Eelec is 50 (nJ/bit), εamp is 100 (pJ/ bit/m2),d is 30 m, vis 250 kbps, and there is no delay due to radio wave collision or communication error. The
results of PTand PR can be calculated as 35 mW and
12.5 mW, respectively.
Figure 3 shows the time series of the operation of
WSNs, where Ts is the transmission time, PT is the
transmission power,PRis the reception power, and nis the number of child nodes of the router. Here, the end-device enters a sleep mode when no information is Fig. 8Network topology construction results based on PSO. This
figure shows an example of a network construction with the lowest power consumption obtained by the PSO algorithm. Here, the red node is the coordinator, the yellow node is the router, and the green node is the end-device. It can be observed that the number of routers is 8, and the number of end-devices is 91
0
transmitted, while the router waits for a receivable state when no information is transmitted.
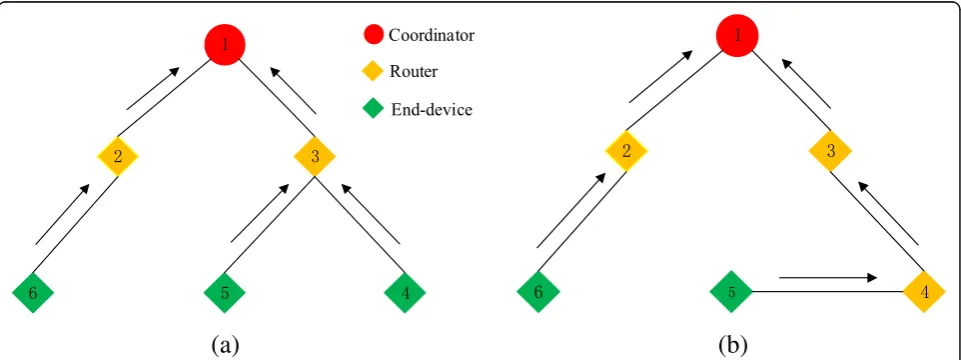
Figure 4 shows an example of two WSNs with the
same number of nodes but different cluster tree
top-ology networks. As shown in Fig. 4a, there are three
end-devices that only transmit information. From
Fig. 3a, the total energy consumption of end-devices
can be calculated as shown in (5). The second and
third node acts as routers to transmit information and also receives information, that is combining the data it owns with the data received from them child
nodes and sends it to the coordinator. From Fig. 3b,
the amount of energy consumption of routers can be
calculated based on (6) in a similar way. Therefore,
the power consumption of a network round is the sum of the power consumption of each node, and is calculated using (7).
Eed¼3TtPT ð5Þ
Er ¼2TtPTþ3TtPT
þ½2T−ð2þ3Þ Tt PR ð6Þ
PWSN1¼
EedþEr T
¼8TtPTþ½2T−5Tt PR
T ð7Þ
As shown in Fig. 4b, it has one more routing node
than Fig.4a, and the power consumed can be calculated
by the same method as described in (8).
PWSN2¼
EedþEr T
¼9TtPTþ½3T−6Tt PR
T ð8Þ
Substituting the values of PTand PR calculated in (3)
and (4), it can be found that the value of PWSN2 is
greater than that of PWSN1. This indicates that different
network topologies affect the power consumption of the network due to the difference in the number of routes, thereby affecting the lifetime of the network.
Fig. 9Comparison of network lifetime. This figure shows the comparison of the performance in term of the network lifetime. It can be seen that there is little difference in the lifetime of the network, although the network constructed by the PSO algorithm consumes less energy in one round than traditional method
4 Cluster tree topology construction method based on particle swarm optimization algorithm
4.1 Particle swarm optimization algorithm
Particle swarm optimization (PSO) algorithm was first proposed for solving the continuous optimization
problem in 1995 by Kennedy and Eberhart [19]. Its
basic concept stems from the study of predation be-havior of birds. On this basis, they proposed a discrete binary version of PSO in 1997 to solve the combinatorial optimization problem in engineering practice.
Similar to other evolutionary algorithms, the PSO
algorithm also adopts the concepts of “group”and
“evo-lution.” The difference is that the PSO algorithm does
not use evolutionary operators for individuals like other evolutionary algorithms, but treats each individual as a non-weight and non-volume particle flying at a certain speed in the search space. The speed of the flight is dy-namically adjusted by the individual’s flight experience and the group’s flight experience.
Suppose that in a D-dimensional target search space,
the population size is m particles, and the position of
theith particle in theD-dimensional search space is rep-resented as aD-dimensional vector
xi¼ðxi1;xi2;⋯;xiDÞT;i¼1;2;⋯;m ð9Þ
The position of each particle is a potential solution for the problem being optimized. By substituting a vectorxi into an objective function, the fitness value of the object-ive function can be calculated, and then the quality of the particle xican be measured according to the fitness value. The flight speed of the ith particle is also a D -di-mensional vector
vi¼ðvi1;vi2;⋯;viDÞT;i¼1;2;⋯;m ð10Þ
The optimal position vector that the ith particle has searched so far is
pbesti¼ðpbesti1;pbesti2;⋯;pbestiDÞT ð11Þ
START
Network construction
Is the remaining energy less than or equal to the threshold?
action
Is it possible to reconstruct the network?
Operate until the remaining energy of any arbitrary node
drops below 0
END YES
YES
NO NO
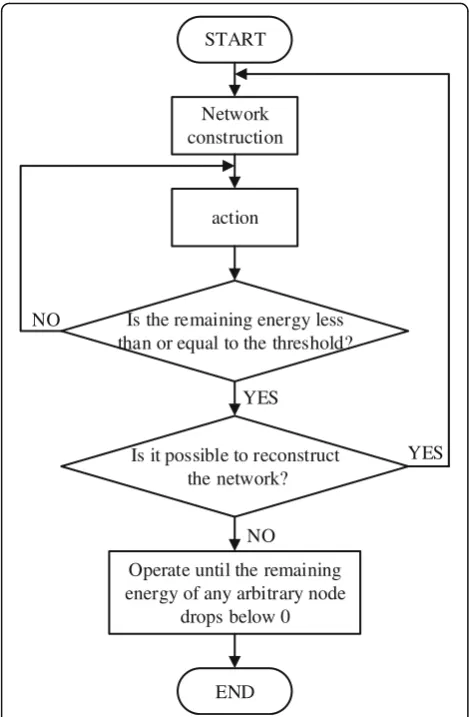
Fig. 11Flow chart of reconstruction method with fixed threshold. This figure shows the flow chart of a network reconstruction method based on a fixed power threshold. As shown in the figure, configure the network and then operate it first. Next, network reconstruction is performed when the remaining rate of battery energy of any router falls below the threshold that is set to 10%. In this case, it is required that the node whose remaining rate of battery energy is lower than the threshold cannot be a router. If reconstruction is not possible, leave the network structure remains unchanged and run until the remaining energy of any node is below zero
where pbesti is called an individual extreme point. The optimal position vector that the entire particle swarm has searched so far is
gbest¼ðgbest1;gbest2;⋯;gbestDÞT ð12Þ
wheregbest is called a global extreme point. In each it-eration, every particle updates its velocity and position according to the above two optimal values. The renewal equation is iteration; c1, c2 are learning factors used to adjust the
maximum step size of the flight toward the global opti-mal particle and the individual optiopti-mal particle; if they are too small, the particles may be far away from the tar-get area, if they are too large, the particles may fly over the target area. The appropriate value ofc1,c2can
accel-erate the convergence and not easily fall into local optimum, usually let c1=c2= 2; rand1, 2 is a random
number between [0, 1]. xk
id is the current position of the dth dimension of the ith particle in the kth iteration; pbestidis the position of theith particle at the individual extreme point of thedth dimension;gbestdis thedth di-mensional position of the global extreme point of the entire population.
In (14), sigðvkþ1
id Þ is the threshold function that
con-verts the velocity to a value between [0, 1], which is defined as
sig vkidþ1¼ 1 1þe−a vðkidþ1−cÞ
ð15Þ
where usually take a= 1, c= 0. The individual compo-nents ρi of the vectorρid are random numbers between [0, 1]. It can be seen that if the value of vidis larger, the position of the particle xid is more likely to select as 1;
otherwise,xid is more likely to select as 0. Therefore,vid is equivalent to a probability threshold, indicating the tendency of the particleito take 1 or take 0 at the d -di-mensional position.
During the running of the PSO algorithm, the individ-ual extreme of a single particle and the global extreme of the entire particle swarm are continuously updated, and the global extreme output at the end of the algo-rithm is the optimal solution of the problem.
4.2 Cluster tree topology construction for ZigBee WSNs using PSO
Construction method of cluster tree topology based on the PSO algorithm actually uses the global search and combination optimization capabilities of the PSO algo-rithm to determine the optimal combination of routers and end-devices in the solution space for ZigBee WSNs.
Based on the introduction and analysis of Section 2.2, we define the evaluation function as in (16) by extending (7) to general cases. Fitness PWSN represents the power consumption of one round of WSNs. One round is the period during which all nodes in WSNs complete once data transmission.
PWSN ¼
HTtPTþ½TR−ðkþRÞ Tt PR T
ð16Þ
Here,Ttis the transmission time,T is one round time of the network,Ris the number of routers,His the total
number of hops of the network, PT is the transmission
power, PR is the reception power, and k represents the
sum of the number of child nodes of each router. The process steps of the proposed network topology construction method using PSO is described as follows.
1. Particle population initialization
As shown in Fig. 5, nodes that can communicate with each other are first connected by dashed lines to create an adjacency matrix. Here, 1 indicates a connection state, and 0 indicates a non-connection state. Next, the
lower left half of the adjacency matrix is taken out and rewritten as one line as shown in Fig.5. Finally, particles can be generated by randomly extracting a number from each part.
2. Evaluation of particle fitness
Particle fitness evaluation is an operation of calculating the fitness of each particle in the population using the evaluation function of (16). The value of fitness can re-flect the quality of the particle. In order to prolong the lifetime of the network, it is desirable that the smaller the value of the fitness (the smaller the power consump-tion) the better.
In the first iteration of the particle population, the ini-tial population of N particles is randomly generated ac-cording to the method in the step (1). The individual
extreme value pbest is set to the current particle
pos-ition. The positional coordinates of each particle are substituted into the evaluation function (16) to calculate the fitness value, and the position of the particle with the largest value is set as the global extreme valuegbest.
If it is not the first iteration of the particle popula-tion, current position vector for each particle is substituted into the evaluation function to calculate the fitness value of the particle. If it is greater than the current individual extreme value of the particle,
pbest will be set to the current position of the par-ticle. If the largest of the individual extreme value of all particles is greater than the current global extreme
value, gbest will be set to the position of the best
particle.
3. Velocity and position of particle updating
For each bit on each particle code string, the vel-ocity and position are updated according to formula (13) and (14).
4. Judgment of stop condition
If the current number of iterations reaches the pre-determined maximum number of generations, the it-eration is stopped, and the result of the cluster tree topology is outputted; otherwise, the process proceeds to step 2, and the algorithm is continued.
5 Simulation results and discussion
In this study, environmental monitoring in a wide area is assumed. Nodes are randomly distributed in the observation area, and the information of each node is managed by the coordinator. Specifically, as
shown in Figs. 6, 100 nodes are placed in an
observa-tion area of 100 m × 100 m to collect informaobserva-tion.
START
Network construction
Is the remaining energy less than or equal to the threshold?
action
Is it possible to reconstruct the network?
Operate until the remaining energy of any arbitrary node
drops below 0
Whether the threshold is <10
YES NO
The communication radius of the node is 30 m. The position of the coordinator is located at the center of the viewing area (50, 50). The coordinator is powered by an external power source, while the node is pow-ered by the battery.
Here, the roles of routers and end-devices can be exchanged with each other, and the movement of the node is not considered. In addition, it is assumed that data collisions do not occur during wireless commu-nication. The experimental parameters are shown in Table 1. In the following section, the cluster tree top-ology constructed by the traditional method and the PSO algorithm are experimented respectively, and the performance is compared and analyzed.
5.1 Construction result of the network topology based on the PSO algorithm
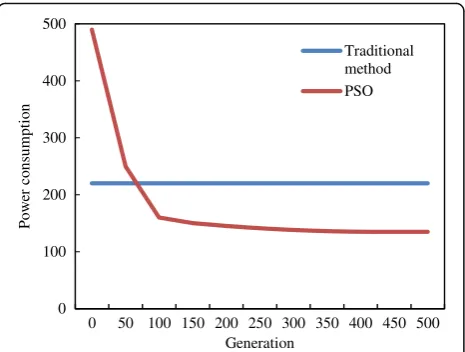
Experiments are carried out using the traditional method and PSO. The experimental results are the
average of ten simulation results. Figure 7 shows a
comparison of network power consumption. It can be seen that the power consumption of the network con-structed with PSO algorithm is smaller than that of the traditional method.
An example of a network construction with the lowest power consumption obtained by the PSO
algo-rithm is shown in Fig. 8. Here, the red node is the
coordinator, the yellow node is the router, and the green node is the end-device. It can be observed that the number of routers is 8, and the number of end-devices is 91.
5.2 Simulation and analysis of network lifetime
Based on the network topology with lowest power
con-sumption obtained in Section 4.1, we study its network
lifetime in this section. We compare the network life-time when the network is not reconfigured and the net-work is reconstructed, respectively. To calculate the lifetime of the network, a capacity of 100 J battery power is supplied to nodes other than the coordinator.
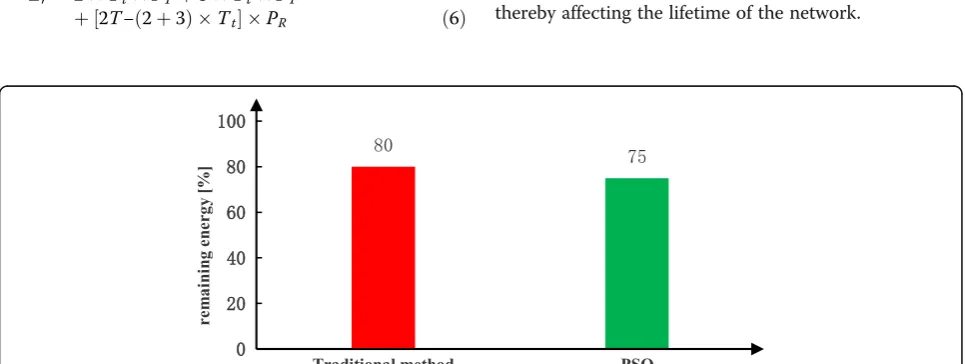
After the network is constructed, the network starts running. We assume that the remaining energy of any node is less than 0, the lifetime of the network stops. The comparison of the performance in term of the net-work lifetime and the remaining energy at the end of network lifetime is shown in Figs.9and10, respectively.
It can be seen that there is little difference in the life-time of the network, although the network constructed Fig. 15Comparison of network lifetime. This figure shows the comparison of the performance in term of the network lifetime when the
reconstruction method with variable threshold is used
by the PSO algorithm consumes less energy in one round than traditional method. In addition, the energy consumption is lower but the remaining energy is still kept at about 70% using the proposed method. This means that the network should be reconstructed to de-plete the remaining power and prolong the lifetime of the network.
5.2.1 Network reconstruction with fixed power threshold
The flow chart of the network reconstruction method based on a fixed power threshold is shown in Fig.11. First, configure the network and then operate it. Next, network reconstruction is performed when the remaining rate of battery energy of any router falls below the threshold that
is set to 10%. In this case, it is required that the node whose remaining rate of battery energy is lower than the threshold cannot be a router. If reconstruction is not pos-sible, leave the network structure remains unchanged and run until the remaining energy of any node is below zero. Here, we do not consider the power consumed during network reconstruction for simplicity.
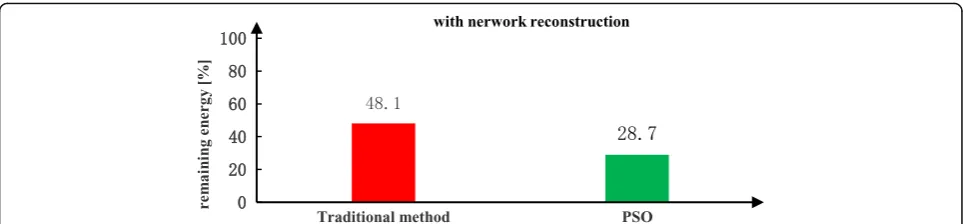
The performance comparison in term of the network
lifetime and the remaining energy is shown in Figs. 12
and 13, respectively. Comparing Figs. 10and 13, in the case of the proposed PSO scheme, it is confirmed that the remaining energy of the network with reconstruction is 46.3% less than that of the network without recon-struction. And as can be seen from Figs.12and 13, it is
(a)
(b)
Fig. 17Comparison of remaining energy distribution map. This figure shows the distribution map of the energy consumption of the network constructed by the proposed reconstruction method, whereacorresponds to the topology construction method using PSO algorithm and reconstruction method with fixed threshold;bcorresponds to the topology construction method using PSO algorithm and reconstruction method with variable threshold
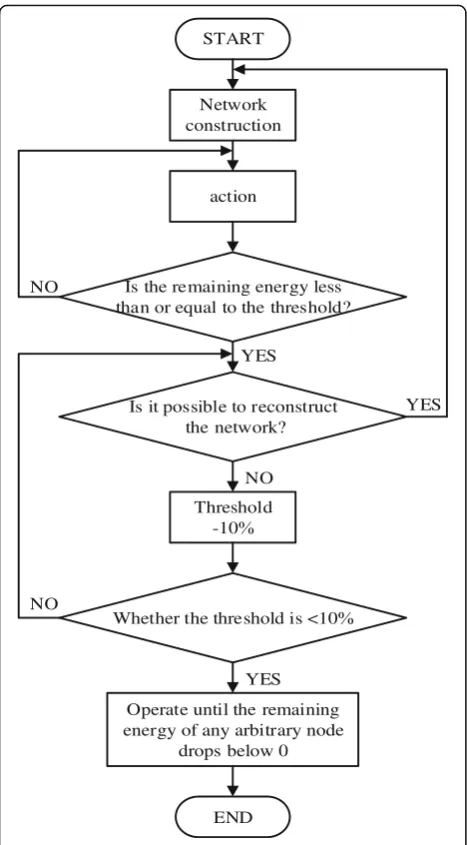
5.2.2 Network reconstruction with variable power threshold
The flow chart of the network reconstruction method
with the variable power threshold is shown in Fig. 14.
When the remaining rate of battery energy of any router drops below the threshold that is set to 80%, network re-construction is performed. It is required that nodes whose remaining power is below the threshold cannot be set as a router. If network reconstruction becomes impossible in the current threshold, the threshold is re-duced by 10%. In this case, the node with the remaining power higher than the threshold can be set as the router, and the node below the threshold can only be set as the end-device. In this way, the threshold decreases with 10% step size, and network reconstruction is carried out in a circular way. When the threshold becomes less than 10%, the network structure is maintained and the oper-ation of the network is performed until the remaining energy of any node is below zero.
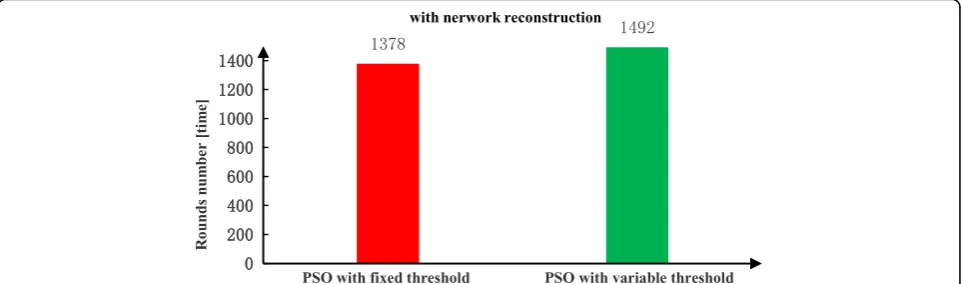
Figures 15 and 16 show the comparison of the
net-work lifetime and the remaining energy using the pro-posed network reconstruction method with the variable power threshold. It can be seen that the proposed recon-struction method with the variable power threshold can improve the performance of reconstruction method with the fixed power threshold.
Figures 17and 18show the distribution of the energy
consumption of the network constructed by the pro-posed reconstruction method. We note that the energy of the nodes near the coordinator is almost exhausted. This is because all the data are transmitted to the coord-inator via the router directly connected to the coordin-ator, so the power consumption of the router closer to the coordinator is eliminated first.
In addition, we can observe that compared to the fixed threshold method, the number of nodes with remaining energy of 90% is decreased significantly using the variable threshold method. It is understood that the remaining power of the battery can be used uniformly for constructed network using the PSO al-gorithm. This is because by using the variable thresh-old method, the number of network reconstructions is increased, and the data transmission load can be prevented from being concentrated on the router and the power of all nodes can be uniformly used, thereby prolonging the network life time.
solving with the PSO algorithm, the network topology is transformed into particle individuals of the PSO algo-rithm. On these bases, the construction method of the cluster tree network topology based on the PSO algo-rithm is proposed. The simulation results show that the proposed method can construct a network topology with lower energy consumption. From simulation results, we also find that it is necessary to reconstruct the network to further prolong the network lifetime. Therefore, two network topology reconstruction methods with the PSO algorithm based on fixed and variable energy threshold are further proposed, respectively. The simulation results prove that the proposed network topology
reconstruc-tion methods can prolong the network lifetime
effectively.
Abbreviations
PSO:Particle swarm optimization; WSNs: Wireless sensor networks
Acknowledgements
Authors would like to express the sincere thanks to the National Natural Science Foundation of Jiangsu province and China for their funding support to carry out this project.
Authors’contributions
YY and BX conceived the main idea and proposed the algorithm. ZYC performed the experiments and analyzed the simulation results. YY and ZWQ wrote the paper. All authors have read and approved the final manuscript.
Funding
This work is supported in part by the Natural Science Foundation of Jiangsu Province (Grant No.BK20160294) and National Natural Science Foundation of China (Grant No. 61601208).
Availability of data and materials
Data sharing not applicable to this article as no datasets were generated or analyzed during the current study.
Competing interests
The authors declare that they have no competing interests.
Received: 29 March 2019 Accepted: 22 July 2019
References
1. J. Yick, B. Mukherjee, D. Ghosal, Wireless sensor network survey. Comput. Netw..52(12), 2292–2330 (2008)
2. Z. Fei, B. Li, S. Yang, C. Xing, H. Chen, L. Hanzo, A survey of multi-objective optimization in wireless sensor networks: metrics, algorithms, and open problems. IEEE Commun. Surv. Tutorial.19(1), 550–586 (2017)
4. T. Ojha, S. Misra, N.S. Raghuwanshi, Wireless sensor networks for agriculture: the state-of-the-art in practice and future challenges. Comput. Electron. Agric.118(3), 66–84 (2015)
5. P. Yi, A. Iwayemi, Z. Chi, Developing ZigBee deployment guideline under WiFi interference for smart grid applications. IEEE Trans. Smart Grid.2(1), 110–120 (2011)
6. B. Pandya, F.K. Chuang, C.H. Tseng, T.D. Chiueh, An energy-efficient communication system using joint beamforming in multi-hop health monitoring sensor networks. EURASIP J. Wirel. Commun. Netw.2017, 172 (2017)
7. S. Tummalapalli, M.V.D. Prasad, ZIGBEE operated FPGA based nodes in wireless industrial automation monitoring and control. Int. J. Eng. Trends Technol.4(5), 1569–1572 (2013)
8. P. Baronti, P. Pillai, V.W.C. Chook, S. Chessa, A. Gotta, Y.F. Hu, Wireless sensor networks: a survey on the state of the art and the 802.15.4 and ZigBee standards. Comput. Commun.30(7), 1655–1695 (2007)
9. G. Omojokun, A survey of zigbee wireless sensor network technology: topology, applications and challenges. Int. J. Comp. App.130(9), 47–55 (2015)
10. M. Ouadou, O. Zytoune, D. Aboutajdine, Y.E. Hillali, A. Menhaj-Rivenq, Improved cluster-tree topology adapted for indoor environement in ZigBee sensor network. Procedia Comput. Sci.94, 272–279 (2016)
11. P. Nayak, A. Devulapalli, A fuzzy logic-based clustering algorithm for WSN to extend the network lifetime. IEEE Sensors J.16(1), 137–144 (2015) 12. A.A. Aziz, Y.A. Sekercioglu, P.G. Fitzpatrick, M.V. Ivanovich, A survey on
distributed topology control techniques for extending the lifetime of battery powered wireless sensor networks. IEEE Commun. Surv. Tutorial.
15(1), 121–144 (2013)
13. J. Esch, A survey on topology control in wireless sensor networks: taxonomy, comparative study, and open issues. Proc. IEEE101(12), 2538– 2557 (2013)
14. M. Ashouri, H. Yousefi, J. Basiri, A.M.A. Hemmatyar, A. Movaghar, PDC: prediction-based data-aware clustering in wireless sensor networks. J. Para. Distri. Comp.2(12), 24–36 (2015)
15. J. Szurley, A. Bertrand, M. Moonen, Distributed adaptive node specific signal estimation in heterogeneous and mixed topology wireless sensor networks. Signal Process.7(4), 44–61 (2015)
16. W. Heinzelman, A. Chandrakashan, H. Balakrishnan, An application-specific protocol architecture for wireless microsensor networks. IEEE Trans. Wirel. Commun.1(4), 660–670 (2002)
17. O. Younis, S. Fahmy, HEED: a hybrid, energy-efficient, distributed clustering approach for ad hoc sensor networks. IEEE Trans. Mob. Comput.3(4), 366– 379 (2004)
18. Y. Zhang, S. Wang, G. Ji, A comprehensive survey on particle swarm optimization algorithm and its applications. Math. Probl. Eng.2015, 1),1– 1)38 (2015)
19. J. Kennedy, R.C. Eberhart, inSystems, man, and cybernetics conference. A discrete binary version of the particles swarm algorithm (1997), pp. 4104–4108
20. W.R. Heinzelman, A.P. Chandrakasan, H. Balakrishnan,33rd Annual Hawaii International Conference on System Sciences. Energy-efficient communication protocol for wireless sensor networks, (2006)(2006), pp. 1–10
Publisher’s Note