OFS: Online Feature Selection based on
Regression analysis and Clustering method
along with its Application
Priyanka Vhansure1, A A Phatak2, A S Shimpi3
M.E.(CSE), Dept. of Computer Science and Technology, NBNSCOE, Solapur University, Solapur, India1 Asst. Professor, Dept. of Computer Science and Technology, NBNSCOE, Solapur University, Solapur, India2
Asst. Professor, Dept. of Computer Science and Technology, NBNSCOE, Solapur University, Solapur, India3
ABSTRACT: Feature Selection is one of the important technique in the Data mining. In this its result shows, almost
all learning of feature selection is limited to batch learning.Dissimilar to existing batch learning methods, online learning can be chosen by an encouraging familiar of well-organized and scalable machine learning algorithms for large-scale approachsuch existing technique is not always appropriate useful for real-world applications whendata instances are of high dimensionality or very expensive to acquire the full set of attributes/features. To highlight this limitation, here found the problem of Online Feature Selection (OFS). The large scale quantity of online learning needs to retrieve all the features/attributes of occurrence. In OFS it is hard to the online learner is allowed to keep a classifier that involved minimum and fixed or exact number of features. The major challenge of OFS is how to make exact prediction for aniteration using a small number of active features. This article shows two distinct tasks of OFS. First one is learning with full input in this an learner is allowed to accessingall the features to decide the subset of active features, and second is learning with partial input in this only limited number of features is allowed to be accessed for each iteration by the learner. TheDifferentialEvolutionary algorithmis used for developing the algorithm. The proposed system represents the novel technique such as Multiclass classification, Correlation and Clustering method to clear up each of the problems and give their performance analysis.
KEYWORDS: Feature Selection, Online Learning, Large-scale Dataset, Data Mining, Classification, Correlation,
Clustering Method.
I. INTRODUCTION
Feature selection(FS) is an essential step in successful data mining applications. In Feature Selection process batch learning is continuously used. It can be effectively reduce data dimensionality by discard the irrelevant and the redundant features. FS is a process of choosing a subset of original features according to certain criteria, it is an important and often used dimensionality reduction method for data mining[9]. It reduces the number of features, removes unrelated or, redundant, noisy data, and brings the instantly effects for applications:
speeding up a data mining algorithm, and getting best mining performance such as predictive accuracy and result comprehensibility. The aim of Feature Selection (FS) is to select the most relevant features in the whole feature space to increase the prediction performance of the predictors. Feature selection is separated into 3 categories: filter, wrapper and embedded. The purpose of online feature selection is to find the solution of feature selection problem in an online fashion by effectively exploring online learning techniques.
Differential evolution (DE) is a method that optimizes a problem by iteratively trying to improve the solution with regard to a given measure of quality. Such methods are commonly known as no supposition about the problem being optimized and can find very large area of dataset. Feature selection has found many applications or uses in many domains or fields, especially for the problems involved high dimensional data[10]. Such suppositions may not always be appropriate for real-world examples in which training examples arrive in order it is expensive to gather the all information of training data. Bioinformatics is another example of feature selection, where acquiring the complete set of features/attributes for eachiteration is expensive due to the high cost for conducting experiments.Finding the relationship between two or more feature here the correlation is best. It is one of the statistical class of statistical relationship involving dependence though in common usage[11].For clustering purpose Nearest Neighboring Algorithm is used it is easy to implement and executes quickly, but it can sometimes miss shorter routes which are easily recognize with human insight, due to its "greedy" nature.
II. RELATED WORK
This work is closely related to the studies of online learning of two task and feature selection in literature. Here below review on important related works in both field. One OFS: Online Learning based on Regression Analysis and Clustering Method with its Application[2]. Second Online Feature Selection with its Applications[1]. Recently, many number of online learning algorithms have been proposed [4], [5],[6], [8]. Here Correlation is a statistical method that can show whether and how strongly pairs of features are related. For example, height and weight both are related; taller people look after be heavier than shorter people. The relationship is perfect.
Correlation is useful because they can indicate a predictive relationship that can be derived in practice. For example, an electrical utility may produce less power on a clement day based on the correlation between electricity demand and weather. In this example they are related to each other, because extreme weather causes people to use more electricity for heating or cooling; however, correlation is not enough to demonstrate the presence of such a causal relationship (i.e., correlation does not imply causation).The dependence refers to any condition in which random variables do not satisfy a mathematical conditions or methods of probabilistic independence. In loose consumption, correlation can refer to any departure of many more random variables from independence, but technically it refers to any of several particular types of relationship between mean values. There are several of correlation coefficients, often denoted r, measuring the degree of correlation. The common of the Pearson correlation coefficient,which is quick response only to a linear relationship between one or two features (which may also exist even if one is a nonlinear function of the other).
Alternative correlation coefficients have been develop to be more robust than Pearson correlation – that is, more sensitive to nonlinear relationships.For the combination of most related features there is clustering technique is used which contains group of related attributes. Nearest neighbor clustering algorithm is used because it takes nearest related attribute for clustering.Nearest neighboring is a part of supervised learning that has been used in so many applications in the field of data mining, pattern recognition, image processing and many other applications[7].
There are two different types for online feature selection tasks: 1) OFS by learning with full input reading, and
2) OFS by learning with partial input reading.
For the first task,here consider that learner can access all the features of training instances, and our goal is to effectively identify a fixed number of related features for accurate prediction. In the second task, we assume more challenging scenario where the learner is allowed to access a fixed minimum number of features for each training data instance to find the subset of relevant features.
Clustering method is based on a fitness function that relies on a distance measure and usually tries to develop “tight” clusters.Nearest neighboring algorithm has simple and powerful rule. It runs fast and gives proper output for the clustering. It requires lot of training data and reduce the noisy data. Also reduce the redundant data from large dataset. After the clustering of related features are done then evolutionary optimization has to be done.Thealgorithms that allow optimization of fitness function of different variables[12].
III. DIFFERENTIAL EVOLUTIONARY ALGORITHM
of randomly selected pairs of solutions in the large data. The algorithm uses mutation operation as a search method and selection operation to direct the search toward the prospective area in the search space.
By using the components of the current data members to create trial vectors, the crossover is nothing but recombination. Crossoveroperator shuffles data or information about successful combinations, enabling the search for a best solution space.An optimization process consisting of D parameters can be represented by a D-dimensional search space. In DE, a data of NP solution data is randomly created at the start. This solution is successfully improve by
applying mutation, crossover and selection operators.
DE algorithm also uses a crossover that can take child node parameters from one parent node more often than it done
from others.
The important steps of the DE algorithm are given below: 1. Initialization Evaluation
2. Repeat
3. Mutation Recombination
4. Evaluation Selection Until (termination criteria are met)
Global optimization is needs in fields such as engineering, statistics and finance but many practical problems have objective functions that are no differentiable, non-continuous, non-linear, noisy, flat, multi-dimensional or have many local minima, constraints or stochasticitysome problems are difficult if not impossible to solve analytically. DE can be used to find approximate solutions to such large scale problems.
DE is an Evolutionary Algorithm
This class also includes Genetic Algorithms, Evolutionary Strategies also Evolutionary Programming
Fig 1: General Evolutionary Algorithm Procedure
HOW TO CALCULATE CORRELATION MATRIX
Correlation matrix is a type of matrix, which provides the correlation between whole pairs of data sets in a matrix. It should be used at the time of optimization.
Formula:
Sum of squared matrix
SSXX SSXY SSXZ
1/(n-1) SSYX SSYYSSYZ
SSZX SSZY SSZZ
Where,
n=N * N Matrix value SSXX = Σ(Xi ̶ X̅)2
SSXY= Σ(Xi ̶ X̅) * Σ(Yi̶Y̅)
Similarly
SSXZ= Σ(Yi ̶ Y̅) * Σ(Zi ̶ Z̅)
Correlation Matrix
1 PXY PXZ
PYX 1 PYZ
Where, n = N * N
PXY =SSXY/√(SSXX*SSYY)
ONLINE FEATURE SELECTION: Online feature selection is particularly important and needs when a real-world
application has to deal with series of training data with high dimensionality, such as online spam classification tasks, where traditional batch feature selection technique cannot be applied directly. In this paper we understand the problem of online feature selection for Multiclass Classification. Using DE algorithm the feature can selected in to two tasks.
OFS: Learning with Full Input- To motivate this algorithm, here first present a simple but ineffective algorithm that
simply select the features. The failure of this simple algorithm induce us to develop effective algorithms for OFS. The goal is to efficiently find a fixed number of relevant features for accurate prediction.
OFS: Learning with Partial Input- In the second task of OFS algorithm, a more challenging structure is understood
where the learner is allowed to access a fixed number of features for each instance to find the subset of relevant feature.This task contains partial data of the each training instance. The data can be given in the form of the percentage.
IV. RESULTS
In this section, an extensive set of experiments to evaluate the performance of the proposed online feature selection algorithms. first evaluate the online predictive performance of the two OFS tasks on several data sets from machine learning repository. In this the multiclass stock market data set is considered for demonstrating the result of OFS technique. Thedataset is related to stock marketin that dailyup, down values are stored. Various companies stock should be in the form of numerical values. That data will be distributed in four fields. The class values are hold, buy and
sell.There are two tasks where the OFS runs
1. OFS Learning with partial input: In this task the user or learner can enter any percentage of data. After
entering any percentage of data we get approximate same accuracy.
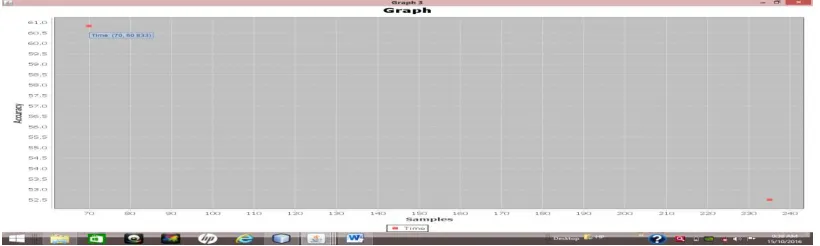
Fig.3: Selected features use for analysis.
The above graph shows accuracy of selected features within stock market dataset. The data that is under the 90% is considered to be 264 rows which is taken for the processing the OFS technic. The following Table 1 shows the different percentage of data gives the same accuracy so selected features accuracy is fixed for any number percentage of data. The Fig 3 shows the use of selected features. They are used for any purpose i.e analysis, prediction or any application development.
Fig 4: Displaying selected or remaining all featuresaccuracy and their processing time.
Table 1: Accuracy and Time Percentage of
data given for OFS.
Number of selected features.
Accuracy of selected features.
Time(ms)for selected features.
Accuracy of all features
Time(ms)for selected features.
78% 62 64.150 67ms 64.525 258ms
94% 49 64.28 68ms 64.52 429ms
68% 50 64.28 44ms 64.52 177ms
2. OFS Learning with Full input: This task also same like the partial input learning to enter the total percentage
of data i.e 100%. After it will shows total features or their count.For that also displayed selected features accuracy and their time.
III. CONCLUSION
This article introduces a research problem, Online feature selection which goal is to select a small and fixed number of features for Multiclass classification. In particular, here two kinds of OFS tasks in two different settings: 1) OFS by learning with full inputs of all the features/attributes, and 2) OFS by learning withpartial inputs of the attributes in large scale approach. Thenovel OFS algorithms to solve each of the OFS tasks, and offered theoretical analysis on the numerical data bounds of the proposed OFS algorithms. Here also extensively examined their performance and applied the proposed techniques to solve real-world applications: neural network, microarray gene expression, CPU Performance: Introducing Numeric Predictionin computer vision and microarray gene expression analysis in bioinformatics. The results showsthat the algorithm is fairly effective for feature selection tasks of many online applications, and moreefficient and scalable as compare to batchfeature selection technique. Future work could extend this framework to other settings, for example, online feature selection for numerical, textual or also image classification.
REFERENCES
1. Online Feature Selection and Its Applications Jialei Wang, Peilin Zhao, Steven C.H. Hoi, Member, IEEE, and Rong Jin
2. Review on “OFS: Online Feature Selection based on Regression analysis and Clustering method along with its Application” in Journal, IJRITCC, April 16,Vol-4,Issue 4.
3. S.C.H. Hoi, J. Wang, and P. Zhao, “LIBOL: A Library for Online Learning Algorithms,” Nanyang Technological Univ., 2012. 4. K. Crammer, O. Dekel, J. Keshet, S. Shalev-Shwartz, and Y. Singer, “Online Passive-Aggressive Algorithms,” J. Machine Learning
Research, vol. 7, pp. 551-585, 2006.
5. .P. Zhao, S.C.H. Hoi, and R. Jin, “Double Updating Online Learning,” J. Machine Learning Research, vol. 12, pp. 1587-1615, 2011. 6. S.C.H. Hoi, R. Jin, P. Zhao, and T. Yang, “Online Multiple Kernel Classification,” Machine Learning, vol. 90, no. 2, pp. 289-316, 2013.
7. J. Wang, P. Zhao, and S.C.H. Hoi, “Cost-Sensitive Online Classification,” Proc. IEEE 12th Int’l Conf. Data Mining (ICDM ’12), pp. 1140-1145, 2012.
8. K. Crammer, A. Kulesza, and M. Dredze, “Adaptive Regularization of Weight Vectors,” Proc. Advances in Neural Information Processing Systems (NIPS ’09), pp. 414-422, 2009.
9. H. Peng, F. Long, and C.H.Q. Ding, “Feature Selection Based on Mutual Information: Criteria of Max-Dependency, Max-Relevance, and Min-Redundancy,” IEEE Trans. Pattern Analysis Machine Intelligence, vol. 27, no. 8, pp. 1226-1238, Aug. 2005.
10. Zhu, X.: Semi-Supervied Learning Literature Survey. Computer Sciences Tech-nical Report 1530, University of Wisconsin-Madison, (2005)
11. Y. Saeys, I. Inza, and P. Larran aga, A Review of Feature Selection Techniques in Bioinformatics, Bioinformatics, vol. 23, no. 19, pp. 2507-2517, 2007.
12. Feature Selection with Redundancy-complementariness Dispersion Zhijun Chena,b,e, Chaozhong Wua,b, Yishi Zhangc,f,, Zhen Huangd, Bin Rane, Ming Zhonga,b,Nengchao Lyua,b
BIOGRAPHY
Priyanka R. Vhansurereceived the B.E. degree and pursuing M.E in Computer Science & Engineering from N. B.
Navale Sinhgad College of Engineering Solapur, India.
Prof. A. A. Phatak working as Assistant Professor, Department of Computer Science and Engineering, N. B. N. Sinhgad
College of Engineering, Solapur, India.