Scholarship at UWindsor
Scholarship at UWindsor
Electronic Theses and Dissertations Theses, Dissertations, and Major Papers
1-1-1981
Passive solar energy: A masonry wall simulation for Windsor,
Passive solar energy: A masonry wall simulation for Windsor,
Ontario.
Ontario.
Lameck M. Simeza
University of Windsor
Follow this and additional works at: https://scholar.uwindsor.ca/etd
Recommended Citation Recommended Citation
Simeza, Lameck M., "Passive solar energy: A masonry wall simulation for Windsor, Ontario." (1981). Electronic Theses and Dissertations. 6767.
https://scholar.uwindsor.ca/etd/6767
This online database contains the full-text of PhD dissertations and Masters’ theses of University of Windsor students from 1954 forward. These documents are made available for personal study and research purposes only, in accordance with the Canadian Copyright Act and the Creative Commons license—CC BY-NC-ND (Attribution, Non-Commercial, No Derivative Works). Under this license, works must always be attributed to the copyright holder (original author), cannot be used for any commercial purposes, and may not be altered. Any other use would require the permission of the copyright holder. Students may inquire about withdrawing their dissertation and/or thesis from this database. For additional inquiries, please contact the repository administrator via email
NOTE TO USERS
This reproduction is the best copy available.
UMT
PASSIVE SOLAR ENERGY A MASONRY WALL SIMULATION
FOR WINDSOR, ONTARIO
A THESIS
SUBMITTED TO THE FACULTY OF GRADUATE STUDIES
THROUGH THE DEPARTMENT OF MECHANICAL ENGINEERING AS A PARTIAL REQUIREMENT FOR THE DEGREE OF MASTER OF APPLIED SCIENCES,MASc.
BY
LAMECK M. SIMEZA (B.Eng. Distinction. UNZA)
DEPARTMENT OF MECHANICAL ENGINEERING UNIVERSITY OF WINDSOR
WINDSOR, ONTARIO. CANADA. DECEMBER, 1981.
IN F O R M A TIO N T O U S ER S
The quality of this reproduction is dependent upon the quality of the copy submitted. Broken or indistinct print, colored or poor quality illustrations and photographs, print bleed-through, substandard margins, and improper alignment can adversely affect reproduction.
In the unlikely event that the author did not send a complete manuscript and there are missing pages, these will be noted. Also, if unauthorized copyright material had to be removed, a note will indicate the deletion.
UMI Microform E C 5 4 7 5 0 Copyright 2 0 10 by ProQuest LLC
All rights reserved. This microform edition is protected against unauthorized copying under Title 17, United States Code.
ProQuest LLC
789 East Eisenhower Parkway P.O. Box 1346
Ann Arbor, Ml 4 8 1 0 6 -1 3 4 6
/?£>
SIMEZA, Lameck M. - Passive solar energy a masonry wall... MASc. 1982
COPYRIGHTED MATERIAL CN LEAVES 100-123. NEED AUTHOR'S PERMISSION. PRINTING IN APPENDICES IS FAINT AND BROKEN. WOULD NOT PRODUCE A GOOD MICROFICHE.
©
LAMECK M. SIMEZA*767905
To
m y wife Margaret
and
daughters,Cynthia and Niza.
"Pasole' is a computer simulation program for passive
solar energy. It can simulate a Trombe wall or a Waterwall
by thermal network analysis. In its original form as set
up at the University of Windsor there was no allowance for
modification of Water waXl and Trombe wall parameters nor
could the program accept weather data in the standard 'TRY'
weather tape format.
In this project modifications were made to allow all
relevant variables for Trombe wall or Water wall simulation
to be input by the user. Additions were made to the pro
gram so that it can access, process and use weather data
from weather tapes. The weather tapes are for selected Cana
dian and U.S.A. cities for a selected year (Test Reference
Year. 'TRY'). A user's manual was written on how to run the
program at the University of Windsor.
Using the modified program, a computer simulation of
the Trombe wall passive solar system, was carried out for
Windsor, Ontario, using Detroit, Michigan weather tape.
The optimum Trombe wall thickness was determined to be
10 inches. The optimum type of window was double glazing.
Using the prices of materials in Windsor in September 1981
and economic variables for the Fall 1981, the payback period
for the 10 inch double glazed Trombe wall, with an area equal
to 15* of the floor area, was 22 years.
The program was also used to estimate the solar contri—
( v )
bution to the building heating demand of the Trombe wall.in the
Solar Cottage built by N.K. Becker in Wheatley, Ontario.
The payback period for the Trombe wall system in this cot
tage was estimated to be 39 years.
A comparison of solar contribution to building heating
for three Ontario cities, Windsor, Toronto and Ottawa showed
that a Trombe wall in Toronto and Ottawa had a better thermal
performance than in Windsor.
The results established the thermal advantage of utili
zing a Trombe wall in Windsor area. The choice of incor
porating the system in a building was shown to depend mainly
on economics.
(vi)
I am most grateful to the following people for their
interest in this project.
Dr. W. T. Kierkus, for his supervision and review
of the thesis draft.
Professor W. G. Colborne, for his supervision,
suggestions and review of the thesis draft.
Dr. T. Tang, for the help in the computer aspects
of the project.
John Hall, for taking the time to review the
early drafts of the thesis.
I wish also to thank the Conklin family for financing
my studies through the David William Conklin Memorial
Scholarship.
I am grateful to my wife Margaret, for her support
and understanding (across the miles) over the past year.
Thanks are also due to Coreinne Malo for typing the
Peport-.
( vii)
T ABLE OF CONTENTS
Page No
ABSTRACT v
ACKNOWLEDGEMENTS vi i
TABLE OF CONTENTS viii
LIST OF TABLES xi
LIST OF FIGURES xiii
CHAPTER I
INTRODUCTION 1.
CHAPTER II
LITERATURE SURVEY ^ ,
CHAPTER III i
'PASOLE* THE COMPUTER PROGRAM 12.
3.1 BRIEF DESCRIPTION OF PASOLE 12.
3.1.1.DESCRIPTION OF MASONRY
WALL MODEL 12.
3.2 MODIFICATIONS TO PASOLE 1^*
CHAPTER IV .
SIMULATION
17-4.1 CONDITIONS CONSIDERED IN SIMULATION 17*
CHAPTER V
RESULTS AND OBSERVATIONS 19*
5.1. SOLAR HEATING FOR A SINGLE, DOUBLE AND TRIPLE
(viii)
5.2
5.3
5
5 • 5 •
5 • 6
5.7
5.8
5.9
5.10
5.11
NET SOLAR SVERGY CONTRIBUTION AS A FUNCTION
OF MASONRY WALL THICKNESS FOR A DOUBLE
GLAZED WINDOW,
21-SOLAR ENERGY HEATING AS A FUNCTION OF
CIRCULATION VENT SIZE.
23-SOLAR HEATING FOR 10 INCH WALL (OPTIMUM
FOR WINDSOR) AS A FUNCTION OF INDOOR
TEMPERATURE FLOAT RANGE.
23-SOLAR ENERGY CONTRIBUTION AS A PERCENTAGE
OF TOTAL HEATING FOR A 10 INCH TROMBE
WALL AND A DOUBLE GLAZED WINDOW. 26.
COOLING BY OPENING WINDOWS FOR 10 INCH
THICK MASONRY WALL AND DOUBLE GLAZED
WINDOW. 28.
SOLAR ENERGY CONTRIBUTION AS A FUNCTION
OF INSULATION LEVEL OF THE BUILDING.
30-SOLAR ENERGY CONTRIBUTION AS A FUNCTION
OF INSULATING SHUTTER RESISTANCE. 32.
AUXILIARY HEATING REQUIREMENT AS A FUNCTION
OF MASONRY WALL AREA , FOR A DOUBLE
GLAZED WINDOW. (WINDSOR, ONTARIO, 1968) 32.
HEAT TRANSFER INTO ROOM NODS FOR 10 INCH
WALL AND D0U3LS GLAZED WINDOW.
35-MASONRY WALL TEMPERATURE PLOTS
37-(ix)
CHAPTER VI
ECONOMICS
6.1 MATERIAL PRICES AND ECONOMIC VARIABLES
6.2 LIFE CYCLE COSTING
CHAPTER VII
SOLAR HEATING COMPARISON FOR THREE ONTARIO
CITIES.
CHAPTER VIII
CASE STUDY FOR WHEATLEY SOLAR COTTAGE
8.1 DESCRIPTION OF COTTAGE PASSIVE SOLAR
HEATING SYSTEM.
8.2 SIMULATION MODEL USED ON PASOLE,'2 AND
ASSUMPTIONS.
8.3 RESULTS AND DISCUSSION
8.^ LIMITATIONS OF SIMULATION
8.5 CONCLUSIONS
8.6 REC OMMENDATIONS
CHAPTER IX
CONCLUSIONS
CHAPTER 'X
RECOMMENDATIONS
REFERENCES
APPENDICES
A DEFINITIONS OF SOLAR AND SURFACE ANGLES.
3 PASOLE 2 MANUAL AND COMPUTER PROGRAM LISTING.
VITA AUCTORIS
(x)
Reproduced with permission of the copyright owner. Further reproduction prohibited without permission.
39.
39-39.
i*6r
1*9•
1*9
•
52.
51
*.
5 6
.
5 7•
57.
58..
6i'.
62.
-65.
TABLE
2.1 Rules of thumb on sizing south facing passive
solar systems for various latitudes and average
outdoor winter temperatures.
a) Masonry wall area as a function of heated
floor area
b) Water wall area as a function of heated floor
area.
c) Direct gain glazing area as a function of
heated floor area.
2.2 Southern window area in various solar houses
in the Northern Hemisphere and the percentage
solar heating.
2.3 Annual solar heating results for 29 various
climates.
6.1 Prices of Trombe wall materials. Fall 1981 in
Windsor Ontario.
6.2 Economic variables.
6.3 Payback period for Trombe wall with area equal
to 15fa of the floor area
a)Low insulated building with shutters
b)Low insulated building no shutters
c)Average insulated building with shutters
(xi)
FageMo.
5-6 .
8
.
1 1.
40. .
40.
42.
42.
d)Average insulated building no shutters
6.k Life cycle costing for a Trombe wall with
area equal tol5% of the floor area in Windsor.
(xii)
Figure 1.1 2.1
3-1
5*1
5*2
5-3
5-4
5-5
5*6
Page N o .
Trombe wall Passive Solar Heating System 2
Heating requirements as afunction of window area
(Hamburg,Germany 1973) 10
Pasole simulation model for masonry wall with
optional massive exterior wall. 13*
Monthly net solar heating for single,double and
triple glazed masonry wall system. 2 0.
Net solar contribution as function of masonry
wall thickness for double glazed window. 2 2.
Net solar contribution as afunction of thermo
circulation vent size. 2*K
Monthly net solar heating for a 10 inch thick
wall with double glazed window as a function of 2 5*
indoor temperature float range.
Monthly percentage solar heating fraction for
double glazed window with 10 inch masonry wall. 27*
Monthly amount of solar energy let to the outside
(by opening windows) in order to cool the indoors. 2 9*
(xiii)
5*7 Seasonal solar energy contribution as a function
of insulation level of the building. 31
5*8 Solar energy contribution as a function of night
insulating shutter resistance. 33
5*9 Auxiliary heating requirement as a function of
masonry wall area for a double glazed window(Windsor
Ontario 1968). 3^
5.10 Heat transfer into room node, for 25th January,
10 inch thick masonry wall and double glazed
window. 38
5*11 Masonry wall temperature plots for 25th January
1968. 38
7.1 Monthly net solar contribution; a comparison of
three Ontario cities, Windsor, Ottawa and Toronto. ^7
8.1 Passive solar heating systems on Wheatley solar
cottage. 5°
8.2 Passive solar heating system on Wheatley cottage
side view. -51
8.3 Pasole simulation model for masonry wall of the
Wheatley solar cottage. 53
(xiv)
INTRODUCTION
Passive solar heating is defined as the heating of
a building in which the solar energy is collected and
distributed by natural means, such as conduction and
convection. All components sire deliberately sized and
located to facilitate natural energy transfer.
A passive solar heating system can either be
(i) a direct gain system
or (ii) an indirect gain system.
Among the indirect gain systems is the masonry
wall system, commonly known as the Trombe wall. Shown in
Fig 1*1*
In a Trombe wall passive solar system the solar
radiation strikes the masonry wall which is positioned
directly behind the south facing glazing. The solar energy
is then distributed to the room by convection through
the vents provided in the wall and by conduction through
the masonry wall* The convection normally occurs during
the daylight hours. The solar energy conducted through
the masonry wall reaches the room at night. Flaps
over the top vents stop reverse convection of warm room
air to the cold space between the wall and the glazing
at night or on cold cloudy days. Shutters are used on
the outside to reduce heat loss to the outside at night
and on cold cloudy days.
1
flap to control
reverse thermo circulation
glazing •*=: w all surface painted black
SOLAR H EATED A IR
radiant heat
convective heat tra n s fe r
THERMAL STORAGE WALL
COOLER ROOM A IR
outside insulating shutters here
PIG- 1 • 1 Trombewall Passive Solar Heating System.
performance of the Trombe wall system in Windsor area.
The importance of this project is that it provides
for Windsor, Ontario the data required to make a decision
on whether or not to incorporate the Trombe wall passive
solar system into a house.
To analyse the performance of the masonry wall
passive solar heating system over a whole heating season,
a computer simulation was used. In this project the simulation
was done by use of a computer program called "Pasole". This
is a general passive solar energy computer program that
simulates a masonry wall and a waterwall. It calculates
hour by hour results utilizing weather data for a selected
test reference year (TRY)*. The program calculated for a
masonry wall passive solar heating system, the net amount
of solar energy contribution to the building heating.
Before using Pasole, modifications and additions had
to be made so that it could access and use data from weather
tapes. The program as it exists at the University of Windsor
computer centre is subsequently referred to as Pasole 2.
The economics of adding the masonry wall passive
solar heating system are also analysed for Windsor, Ontario.
The prices used in the analysis were for September 1981.
*TRY= Test Reference Year Data Available for a number of cities from National Weather Bureau. Ashville N.C.
CHAPTER II
LITERATURE SURVEY
Passive solar energy can contribute a sizeable amount
to the heating requirements of buildings. Such buildings must
have their windows located south east to south west through
south. Sizing these windows for most efficient use of solar
energy is determined by various factors. Some of these
factors are:
a) the percentage of total heating the solar
energy has to contribute.
b) available thermal storage mass in the
building enclosure. (1)
c) the passive solar system chosen, ( l) (2)
d) location and climatic conditions. (1) (2 )
e) other auxiliary control systems available for
limiting indoor temperature fluctuations, e.g.
night insulating shutters or blinds and
window overhangs. ( l) ( 2 )
( 2 )
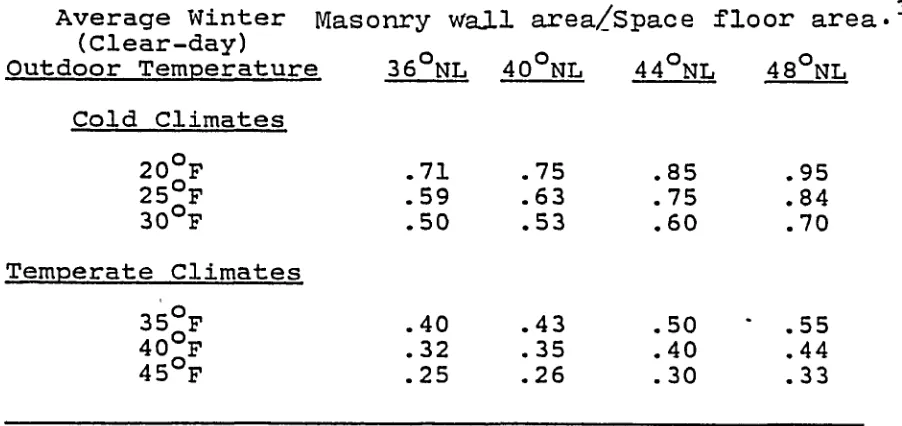
Mazria 'lays out rules of thumb which can be used
to determine the initial size of the south facing glazing
for the various passive solar heating systems.
The sizes for masonry wall, waterwall and direct
gain glazing are tabulated in Tables 2.1 (a) (b) and (c)
respectively. The passive solar energy system area is
fraction of he a t e d floor area.
«<
Average Winter Masonry wall area/Space floor area* (Clear-day)
Outdoor Temperature
Cold Climates
20 F 25°F 30 F
Temperate Climates
35°F 40 F 45°F
36°NL 40°NL 44°NL 48°NL
.71 .75 .85 .95
.59 .63 .75 .84
.50 .53 .60 .70
.40 .43 .50 * .55
.32 .35 .40 .44
.25 .26 . 30 .33
These tables apply to a well insulated space with a
heat loss of 8 BTU/day/sq.ft. /°F. If space heat
loss is more or less than this "figure, adjust the
ratios accordingly. The surface area of the wall is
assumed to be the same size as the glazing.
TABLE 2.1 (B). Preliminary size of water wall as a fraction
of heated floor area.
Average Winter Water wall area/Space floor area.
(Clear-day) Outdoor Temperature
Cold Climates
20°F 25°F 30 F
36°NL 40°NL 44°NL 48°NL
.52 .55 .65 .80
.45 .47 .55 .64
. 36 .39 .45 .55
.28 .31 . 35 .40
.23 .25 .29 .32
.17 .18 .20 .24
Temperate Climates
35°F 40°F 45 F
Note: ^For thermal walls with a horizontal specular reflector
equal to the height of the wall in length, use 67% of
the recommended ratios. For thermal walls with night
insulation (R-8) , use 853$ of the recommended ratios. With both night insulation and reflectors, use 57% of the recommended ratios.
Table 2.1(A), from, 'A Design and Sizing procedure for pas
sive solar heated building1. E. Mazria. Report Sand
79-0824 pp. 229, 242. Passive Solar Buildings.
6. TABLE 2.1 (C). Preliminary size of Direct gain windows
as a fraction of heated floor area, (double
48°NL
.31 (w/night insul.) .28 (w/night insul.) .24
.21
.13 .13
Temperatures listed are for Decemoer ana January, usually the coldest months.
2
These ratios apply to a well insulated space with
a heat loss of 8 BTU/day/sq. F t . ~ / F. If space
heat loss is more or less than this * figure, adjust the ratios accordingly.
glazing).
DIRECT GAIN
Average Winter
(Clear-day) ^
Outdoor Temperature
Cold Climates
Glazing/Floor area'
20°F 25 F 30°F
•^-^SSvperate Climates
30°F 40°F 45 F
36°NL 40°NL 44°NL
.24 .25 .29
.22 .23 .25
.19 .20 .22
.16 . 17 .19
.13 .14 .16
.10 .11 .12
given as a fraction of the heated floor area. The tables
were made from data on existing solar houses. The sizes
are given as a function of latitude and winter outdoor
average temperature.
For the Southern United States it has been shown
by Arumi and Hourmanesh in Texas and Balcombe
in Los Alamos that the optimum thickness of the wall, in
the Trombe wall passive solar system, is 12 inches.
Increasing the wall thickness above 12 inches does not
result in substantial increase in solar energy used to
heat the buillding.
Table 2.2 ^ ^ is a compilation of data on some
existing passive solar heated houses which make use of
the masonry wall passive soalar heating system. Some of
the houses have other passive solar heating systems in
addition to the masonry wall. These are called mixed
systems* The amount of south-facing glazing and the
percentage of solar heating achieved are tabulated. The
south-facing glazing area in these buildings ranges from
six percent to 142 percent of the heated floor area.
The heating percentage contributed by solar energy also
varies accordingly. The percentage of solar energy
contribution is determined mainly by (i) internal thermal
storage in the building envelope, (ii) use of night
insulating shutters on windows, (iii) insulating level
in the rest of the building.
8.
Table 2.2
Amount of South Glazing in Various solar houses and the per centage solar energy contribution of seasonal heating.
House Degree Days (DDF) Heated Floor Area ft2 South Window Area
% of Floor = South Window Solar Energy Contri bution Delap House Fayetterville AR. 36o n (1976)
Hybrid
3800 2000 860 ft2 43* 60-75%
Community Environment Santa Barbara C.A. 32°N
1507 2200 370 ft2 16.8% 70%
Lasar House 41°N
Tyrrel House Bedford
N.H. 43°N
Reckard
House Northwood N.H. 43 N
5897 7643 7383 2460 1920 2500
500 ft2 375 ft, vert 125 ft -60° Greenhouse
300 ft2 Trombe « + 150 ft Drain
20%
23.43%
65% no shutters 80% with shutters R-10.
60%
40-60%
Klein House Bally p .a . 40.5 N
5250 400 570 ft2 142.5% 100%
Source Reference ( 1 ) •
B r u n o ^ s h o w e d that in houses with low insulation levels, an
increase in direct gain south-facing window area resulted
in a decrease in the building heating demand. As the
insulation increased, however, this advantage is lost and
for heavily insulated buildings an increase in window area
resulted in an increase in the building heating demand.. This
study was done for Hamburg, Germany. Fig. 2.1 shows these
results.
The maximum and minimum, allowed indoor temperature
influences the amount of solar energy used to heat the
building. The lower the temperature is allowed to drop in
the building before turning on auxiliary heat, the more
solar energy will be used. Also the higher the temperature
is allowed to go before turning on the cooling or opening
the windov/s to let the excess heat out, results in an
increase in the amount of solar energy used. This is
because the energy storage in the building is increased
(1) (6 ).
Table 2.3 is a compilation of data simulated on Pasole
(
by Balcombe et al. ' The results show the solar energy
contribution to building heating for 29 different climates.
The simulations are for an 18 inch thick Trombe wall.
40000 T
windows facing
north east^S west
i",
fa
c<
M X
Cf
fcj
cc
CJ sc M c-* 2 X
+2 north +5 east +•5 west
rdouble glazed windows south facing windows
X
NORMAL HO US’normal windows
30000
-25000
20000
15000
10000
5000
triple glazed
windows with shutters
normal widows with shutters.
4-normal windows witn spec shutters.
double glazed windows with shutters
— II SWEDISH STD'S HOUSE, triple glazed windows with shutters.
— Ill EXPERIMENTAL HOUSE.
special double glezed windows with shutters.
10 20 30 40
WINKSVJ AREA FACING SOUTH.
50 m
PIG 2.1 Heating requirements as a function of the window
area. (Hamburg, 1973). Reproduced from Bruno^5) •
ANNUAL SOLAR HEATING RESULTS FOR 29 VARIOUS CLIMATES
1 BTU/ft hr .3
Case: 18 In. Trombe Wall Thermal Conductivity
Heat Capacity - 30 BTU/ftJ #F
Vent Size “ 0.074 ft2/ft of length (each vent) No reverse thermocirculatlon"
Load (U,) ■ 0.5 BTU/ft2 °F hr
Temperature band ■ 65°F to 75°F
C1tv
Year Startlnq
Heating
Degree-Days Latitude
Solar *
Heating,. BTU/ft^
Solar Heating Fraction Percent
Los Alamos, NM 9/1/72 7350 35.8 60,200 56.5
El Paso, TX 7/1/54 2496 31.8 50,000 97.5
Ft. Worth, TX 7/1/60 2467 32.8 38,200 80.8
Madison, WI 7/1/61 7838 43.0 44,900 41.5
Albuquerque, NM 7/1/62 4253 35.0 63,600 84.1
Phoenix, AZ 7/1/62 1278 35.5 38.300 99.h
Lake Charles, LA 7/1/57 1694 30.1 34,300 90.5
Fresno, CA 7/1/57 2622 36.8 43,200 83.3
Medford, OR 7/1/61 5275 42.3 47,400 56.1
Bismarck, ND 7/1/54 8238 46.8 53,900 46.4
New York, NY 6/1/58 5254 40.6 48,000 60.2
Tallahassee, FL 7/1/59 1788 30.3 40,700 97.3
Dodge City, KS 7/1/55 5199 37.8 58,900 •71.8
Nashville, TN 7/1/55 3805 36.1 39.500 65.2
Santa Maria, CA 7/1/56 3065 34.8 69,800 97.9
Boston, MA 7/1/57 5535 42.3 47,100 56.8
Charleston, SC 7/1/63 2279 32.8 47,900 89.3
Los Angeles, CA 7/1/63 . 1700 34.0 53,700 99.9
Seattle, WA 7/1/63 5204 47.5 42,400 52.2
Lincoln, HE 7/1/58 5995 40.8 53,500 59.1
Boulder, CO 1/1/56 5671 40.0 62,500 70.0
Vancouver, BC 1/1/70 5904 49.1 46,000 52.7
Edmonton, ALB 1/1/70 11679 53.5 37,700 24./
Winnipeg, Man 1/1/70 11490 49.8 33,700 22.6
Ottawa, Ont. 1/1/70 8838 45.3 37,900 31.9
Fredericton, NB 1/1/70 8834 45.8 40,100 33.9
Hamburg, Germany 1/1/73 6512 53.2 24,500 27.5
Denmark 7 6843 56 43,100 43.8
Tokyo, Japan 7 3287 34.6 50,300 85.8
★
The values in the solar heating column are the net energy flow through the Inner face of the wall
From Passive S olar
Into the building.
H eatin g , by Balcom be et a l t * )
CHAPTER .III
"PASOLE"' THE COMPUTER PROGRAM
In order -to study the thermal advantage of utilizing
the masonry wall passive solar heating system in the
Windsor area, the program Pasole was
used.-3.1 .BRIEF DESCRIPTION OP PASOLE
Pasole is a general simulation computer program for
passive solar heating. It has incorporated in it, a masonry
wall and a waterwall model. The masonry wall is shown in
Pig. 3-1. The model breaks the passive solar heating
system into a number of nodes with connecting resistances
and associated heat capacitance.
3.1.1. DESCRIPTION OF MASONRY..WALL_MODSLj.
The solar energy is absorbed in the surface node No.l
of the masonry wall. From this node the energy is dis
tributed in various proportions to the other connected
nodes. The nodes representing the glazing also absorb a
portion of the incident solar energy and are also termed
source nodes. Some of the solar energy absorbed by the
glazing is transmitted into the space.
The finite difference method is used to calculate
the heat storage in the masonry wall as well as the heat
flow through the masonry wall and the resulting node
temperatures.
1 2.
glazing
room node
(12)
(13)
(14) ULOAD
(1 0)
8 OR 16 lMAS0NRY W A LL
optional massive wall
PIG 3.1 Pasole simulation, model with optional
massive exterior wall. The room node is
node 7. The outside is node 8.
lk.
As a simplification the loss from the rest of the
building is lumped together and represented by one
conductance called ULCAD. This is the conductance of the
rest of the building per unit south facing glazing area.
This assumption neglects the heat storage in the rest of
the building. There exists an option to set this con
ductance to a fraction of the loss from the rest of the
building. The rest of the loss is modelled through a
massive optional masonry wall which has thermal storage
capacity. . .
Once calculations are completed, the results are
available through various print options, hourly, daily, and
monthly. A day on which hourly data is required to be
printed can be selected. A monthly summary consisting of
the sums of the hourly values is given at the end of the
calculation. Totals for the simulated period are also given.
Several other tables are also printed as shown in Appendix
B. The variables in the tables are explained in detail in
Appendix B » which contains a complete manual explaining
the program Fasole, and all its associated variables.
Included in Appendix B is the listing of the program(Pasole)
as it exists at the University of Windsor Computer Centre.
3.2 K0DIFICATI0M5 TO PASOLB
Since Pasole as originally set up at the University
of Windsor Computer Centre cannot accept weather data in
the standard TRY tape format, and does not have allowance
necessary to modify Pasole to make it more user oriented.
The modified program has subsequently been called Pasole2
The following modifications and additions were made to
Pasole:
(a) The program was made 'user oriented' This means
that all important variables in masonry wall and
waterwall passive solar heating models can now
be supplied (on cards) by the user.
(b) For the user at the University of Windsor, the
program has been expanded so that it can access
TRY data directly and transform it into acceptable
format to be used by the program. This is done
for U.S.A. cities via ESP ^ ? ' weather program. For
Canadian cities the weather is accessed and
processed by portions from the program ENCORE
(8)
CANADA . The weather must, however, be on disk
files in the computer centre. At present only
Detroit, Toronto and Ottawa are on disk files.
Tapes for other cities are available.
(c) The loss path through the optional massive
masonry outside wall was adjusted so that it can
accept a fixed temperature node on the outside.
The value of this temperature has to be less than
200°F. This could be used to represent adjacent
16.
rooms which are set at a fixed temperature.
For the node to he set at outdoor temperature, the
temperature value must be greater than 200°F. See
Appendix B .
(d) At the end of the calculations the net solar
energy contribution per month is output. This
value has to be modified if the optional wall is
used. This modification is necessary only if the
optional wall outside temperature is set at a
fixed value below 200°F. Then it is necessary to
add manually the loss through ULOAD connection
and through the extra massive wall.
Appendix B includes a complete manual on how to run
Pasole 2. If any problems are encountered consultation
with the computer centre consultants is recommended.
. SIMULATION
The program Pasole 2 was used to simulate a Trombe
wall passive solar heating system. The Trombe wall system
is shown in Fig. .1. The weather data used in the
simulation was for Detroit Michigan, for the year 1968.
This weather is supplied as Test Reference Year data from
the National Weather Bureau, Ashville N.C. The proximity
of Detroit to Windsor makes this data valid for use in
Windsor. Comparison was made of average January clear day
total observed in Windsor 1971-1978 ^ ^with the TRY
v/eather for 25th January 1968 and was found to be in
agreement within 2fS.lt was concluded that the use of the
Detroit weather was acceptable.
Hour by hour simulations were done for the heating
season months. (October to April inclusive). Monthly
totals of net solar energy contributed to heating the
buildings were calculated and were plotted.
*K1 CONDITIONS CONSIDERED IN THE SIMULATION
The following conditions were considered in the
simulation:
(a) For an 18 inch Trombe wall (used in Los Alamos W
Simulation by Balcombe ) the net solar energy contribution
for single, double and triple glazing was calculated, and
17.
18.
.plotted, for the heating season,
(b) Varying the masonry wall thickness from
^ inches to 18 inches for a double glazed
Trombewall system.
(c) For an 18 inch wall, varying the vent sizes
from zero to 25v° of the masonry wall area.
(d) For the optimum wall thickness and vent size,
varying the indoor temperature float range. The
ranges analysed were 65°F/75°F» 68°F/78°F and
70°F fixed temperature.
(e) Varying the resistance of night insulating
shutters for a double glazed Trombe wall system.
(f) Varying the insulation level in the rest of
the building for a double glazed Trombewall
system.
(g) The effect on the heating demand of varying
the size of the south facing masonry wall area.
RESULTS AND OBSERVATIONS
5.1 SOLAR HEATING FOR 'SINGLE, DOUBLE AND TRIPLE GLAZED
MASONRY WALL SYSTEM.
Fig. 5*1. shows the amount of net solar
energy contribution per foot squared south facing
masonry wall area. The results are for single, double
and triple glazing. The wall thickness is 18 inches
and there are no night insulating shutters. Single
glazing has net heat losses to the outdoors in three
of the heating season months. Double glazing has net
positive solar energy contribution in all the months
except in December. Triple glazing has positive solar
energy contribution in all the heating season months.
The advantage of changing from double to triple
glazing is small compared to the change from single to
double glazing.
The negative values in the single and double
glazing mean that the solar energy collected during
the month was less than the amount of heat conducted
to the outdoors through the same window.
19.
N E T S O L A R E N E R G Y A D D E D TO S P A C E P E R F T 2 W IN D O W A R E A jB T U /F l2 M O N T H .)
20.
6 0 0 0
N
\
4000
2000
oct
- 2000
w
\\
>
\
/
r
r >
/ /
f
// /
% t/ /
/
\ X
/
L
nov ' dec /
\
\ //
\ /
> /O
ja n feb m a r a p r H E A T IN G SEASON
M O N T H
v S in g le g la z in g
o DoubLe g la z in g x Triple g la zin g
•4 000
'7’
P I G 5*1 M o n t h l y s o l a r e n e r g y c o n t r i b u t i o n to b u i l d i n g
2
h e a t i n g p e r ft T r o m b e w a l l area. I n d o o r t e m p
e r a t u r e s e t t i n g Ttaax*78 P, Tm in a68 P- W a l l
thictoiess- 18 inches. A v e r a g e i n s u l a t e d
b u i l d i n g . U L C A D * 1.2.
WALL THICKNESS FOR A DOUBLE GLAZED WINDOW.
Fig 5.2 shows the effect of varying the masonry wall
thickness for a double glazed window with an indoor
temperature float range of 68 F/78 F.
The solar energy contribution increases with an
increase in wall thickness up to a 10 inch thick wall.
The amount of net solar energy contributed then starts
to drop. But it rises again, although slowly, for walls
of thickness above 12 inches.
The optimum wall thickness for Windsor is between
8 inches and 10 inches. This is, however, dependent on
the indoor temperature float. The value stated is for a
68 F/78 F.
The slight drop in solar energy contribution for
walls thicker than 10 inches is due to the fact that the
number of wall nodes was kept constant at four. This
Results in the wall nodes ,in thicker walls, having
resistances of a higher value. The drop would probably
disappear if the thickness of the wall segments was kept
constant. The thicker the segments the poorer is the
approximation to the Trombe wall system. A better repr
esentation would be to keep the segment thickness associ
ated with a node constant and increase the number of nodes
SEA SO N AL N ET SOLAR ENERGY IN T O SPACE PER F T 2 W IN D O W A R E A ( K B T U / F T 2
LATION VENT SIZE.
Pig 5*3 shows the effect of varying the area of the
top row of vents in relation to the masonry wall area.
The vent area ranges from zero to 25 percent of the
masonry wall area. Both the top and bottom vents are
equal in area.
The optimum size of both the top and bottom vents
is 1 0 of the masonry wall area, divided into 5f° for
the top vent and for the bottom vent. The increase
in solar energy contribution for vent area above the
5fi, for either the bottom or top vent, is small.
5.4 SOLAR HEATING FOR 10 INCH WALL AS A FUNCTION OF INDOOR
TEMPERATURE FLOAT RANGE.
Fig. 5.4 shows for a 10 inch wall, (which is the
optimum for Windsor) behind a double glazed window, •' 2 the amount of net solar energy contribution per ft
of glazing area.
Three indoor temperature ranges are shown, 65°F/
75°F, 68°F/78°F and 70°F/70°F.
The best performance is for the 65°F/75°P range
setting. This is followed by the 68°F/7S°F range and
S
e
a
s
o
n
a
l
n
et
so
la
r
e
n
e
rg
y
in
to
.s
p
ac
e
pe
r
ft
w
in
d
o
w
ar
e
a
(
K
B
t
u
/
f
t
^
)
2k.
10
-10
5 15 20
0 25
a r e a one row of vents as a percent of masonry wall a r e a .
PIG 5*3 Net seasonal solar energy heating as afunction
. of circulation vent size. Wall thickness= 18 in
ches. Indoor temperature float T = 78 F, max ' T . = 68 F. (Windsor, Ontario).
<
LU
8000 •
£ o Q
fNr—
U.
6000 K
S 4000
UJ
o
1/1§2000 S 2
<vj Q £
LU ^
Q
Q 3 0 < 1—
CD - .
O
cc
UJ
§ - 2000 cr
<
__i
o in
-
\
A 000 •
LU
Y
v.
• A
oct
•
nov dec / / /• ■ jan
4
-'AY"///
w w /
feb m a r
\V
/ /tapr
H E A T IN G SEASON MONTH
Indoor tem peratu re f l oat
a 6 5 ° F / 7 5 ° F ^ 68° F / 78° F
o 7 0 ’ F / 70 ° F
PIG 5*4 Monthly solar energy contribution to space for
a ten inch Trombe wall in Windsor. Double
glazing. No insulating shutters.
26.
last by the 70°F/70°F range. The reason is that when
the room temperature is set at a low temperature of
65°? it allows more heat to be conducted and convected
to it than to a room set at a higher temperature of
68°F. The indoor temperature rarely exceeds 75°F
during the heating season. Hence the 65°F/75°F range
represents the largest solar heating contribution.
The 68°F/78°F range reduces the value by 3°F on the
lower end and results in less solar energy used by
the room. The 70°F/70°F range reduces the range on
both the lower side and the upper side. On the lower
side reduction by 5°F results in less conduction and
convection to the higher temperature of 70°F, with a
subsequent decrease in net solar energy contributed.
On the upper end limiting the temperature to 70°F
means solar energy which would raise the indoor
temperature above 70°F will be let to the outside.
This energy is considered lost.
5.5 SOLAR ENERGY CONTRIBUTION AS A PERCENTAGE OF TOTAL HEATING FOR A 10 INCH TRCKBE WALL AND DOUBLE GLAZED
WINDOW.
Fig* 5*5 shows the percentage of solar energy contribution for the heating season for a double
glazed masonry wall system. The wall thickness is 10
inches and the room temperature float is 68°p/78°f.
The loss conductance for the rest of the building
a a» -c ■c
a o
o
o
dec
oct nov jan feb
HEATING SEASON MONTH.
m ar apr
o low insulated building ( R 8 )
V average insulated building ( R 2 0 )
PIG 5*5 Percentage solar heating for low and average insulated buildings. (Windsor, Ontario).
28.
is 1.20 BT'U/hr °F ft2 glazing area. This represents
am average insulated house equivalent to average
insulation level of R 20.
The largest percentage contribution is during the
fall and spring months. This is because the outdoor
temperature during these months is moderate hence the
heat conducted back through the glazing is less than during
the mid winter. The building heating load is also
smaller. It was also seen that the amount of solar
energy incident on the southern glazing is higher
during the fall and spring months resulting in the
higher percentage solar heating contribution.
5.6 COOLING BY OPENING WINDOWS FOR A 10 INCH TROMBE
WALL WITH DOUBLE GLAZED WINDOW, INDOOR TEMP FLOAT 68°?/
78°F.
Fig 5.6 shows the amount of solar energy let to
the outdoors when the ' indoor temperature rises above
the upper set limit. This is called vent cooling.
The vent cooling is small except for March and
April which are moderately warm months and they also
have high solar radiation incident on the southern
glazing. The results shown are for two cases with no
insulating shutters (i) low insulated building (R8)
and (ii) average insulated building (R20) .
A
M
O
U
N
T
OF
S
O
L
A
R
E
N
E
R
G
Y
V
E
N
T
E
D
TO
TH
E
OUTSI
DE
(
B
T
U
/F
T
2
M
O
N
T
H
)
8000
6000
4000
2000
0
F I G
O L o w insulated hous e a Average insulated house
oct nov dec jan feb m ar apf
HEATING SEASON MONTH
5*6 M o n t h l y a m o u n t o f s o l a r e n e r g y let to the o u t s i d e
(by o p e n i n g w i n d o w s ) in o r d e r to c o o l the indoor.
T e n i n c h T r o m b e wall. D o u b l e g l a z e d w i n d o w . I n d o o r
t e m p e r a t u r e f l o a t Tm a v ." 78 F, Tm ^n a 68 F* (W i n d s o r,
O n t a r i o ).
5-7 SOLAR ENERGY CONTRIBUTION AS AFUNCTION OF INSULATION
LEVEL OF THE BUILDING.
»
Fig 5*7 shows the effect of the insulation level of
the rest of the building on the amount of solar energy
contribution for the heating season.
For heavily insulated buildings the net solas energy
contribution is small. This is because heavily insulated
buildings will overheat and the solar energy will be vented
to the outside and considered lost. The amount of net solar 1
energy contribution increases as the insulation level
decreases. The plot should flatten out as houses with no
insulation are approached.
On the graph, heavily insulated buildings have been
defined as those with a ULOAD less than 1.2. This is
equivalent to an insulation level greater than R 20, v/hich
is about the same level as the Wheatley solar cottage in
Ontario. Average insulation is between ULOAD 1.2 and 3*2
representing average insulation between R 20 and R 8. Low
insulation is a ULOAD greater than 3*2 which is equivalent
to an insulation level of R8 and below. An ordinary frame
house of current structure falls at ' UL0AD=3»2.
For average and low insulated houses the insulation
level in the building does not significantly affect the
amount of net solar energy contribution to heating the
building by a masonry wall passive solar heating system.
However, for heavily insulated building the amount of
solar energy contribution is reduced due to over heating in
the building with subsequent need for cooling, by opening
o Q. C o CD Q. ■o CD GO (/) d 3 o o ■O cq' Z3 CD c a. CD ■D 3 Q. C o f— H o' = 3 ■o 3 CD Q .
ZT
O c T 3 CD a. m a. ui o <f a (/ifM t"O Ll
I- -X
Z3 >~ *~
o aj a. r;
uj *
z —
UJ
< «
o a in <
2 o a _i z
<
t-Id n
in
30
10
0
Wheatley Solar Cottage (R 2 0 ) Ordinary constriction ( R 8 ) AVERAGE CONDUCTANCE OF REST OF B U IL D IN G P E R UNIT WINDOW AREA (U L O A D ).
- 10
FIG 5-7 Solar energy contribution as a function o f insulation level in the rest of
the building* (Windsor, Ontario). Building floor area 1000 ft^. Indoor
temperature float T = 78 F»Trajn s 68 F.
(/)
32.
windows or if necessary by .auxiliary .cooling.
5.8 SOLAR ENERGY CONTRIBUTION AS A FUNCTION OF
INSULATING SHUTTER RESISTANCE.
The effect of increasing the insulating shutter
resistance is shown in Fig. 5*8. The plot shows the
law of diminishing returns. The gains due to
raising the resistance reduce with the increase in
the resistance value,
5.9 AUXILIARY HEATING REQUIREMENT AS A FUNCTION OF
MASONRY WALL AREA, DOUBLE GLAZED WINDOW (VJIND30R,
ONTARIO 1968)
Fig. 5-9 shows the relationship between south
facing masonry wall area and auxiliary heat
required to heat the building. Bruno (5) showed
that for direct gain passive solar windows, an
increase in window area in low insulated buildings
resulted in a decrease in the auxiliary heating
demand. For heavily insulated buildings he showed
that an increase in window area resulted in an
increase in heating demand.
Fig. 5*9 for a Trombe wall system shows that for
this kind of system an increase in the masonry wall
area always results in a decrease in the auxiliary
heating demand of the building. This is true for
both poorly insulated buildings and heavily insulated
*0
CD
(/)
(/) o' 3 O
O
o
"O c q'
o
CD
a.
O-CD CD
■o
O
Q.
O O ■O 3
CD
Q.
O C ■O
CD
C/3 C/3
o'
= 3
CQ
R M O
c
c
c
o (A
O
C
o
(A 3
in
0 1 2 3 A 5 6 7 8 9 10 11 12 13 K 15 16 17 1E> 19 20 Might insulating shutters resistance value ( ' F / B T U / H R / F T 7 )
F I G 5.B Net seasonal solar energy contribution as a function of insulating shutter
resistance. Double glazed ten inch masonry wall system. Indoor temperature
S E A S O N A L A U X IL IA R Y H E A T R E Q U IR E D F O R A 10 00 F T 2 F L O O R A R E A B U IL D IN G ( M ill io n B TU ) 3^* low insulated building( R3. average).
AO ■
average insulated — — building (R20
average ).
heavily insvlat-d building (?70 ~~ ~ average ).
150 200 250 300
0 50 100 350
A R E A O F M A S O N R Y WA L L ( F T 2 )
FIG 5-9 Seasonal auxiliary heat requirement as a function
Trombe wall area for Windsor, Ontario. 1968.
buildings.
It was found for the Trombe wall system that the
auxiliary heat required in all ranges analysed is a
linear function of the insulation level in the rest
of the building. It is hence not affected by the
south masonry wall. This result has been shown before (10)
by Jones , who came to the conclusion that Trombe
wall economics can be treated separately from
building insulation economics.
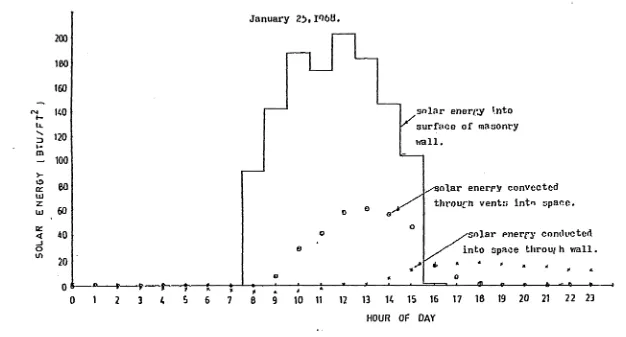
5.10 KSAT TRANSFER INTO ROOM NODE FOR A 10 INCH VJALL
AND DOUBLE GLAZED WINDOW.
The main aim of the Trombe wall system is that it
should store most of the solar energy received
during the sunshine hours. This stored energy should
then be conducted to the room during the night. The
heat transfer to the room during the daytime hours
should be by convection through the thermocirculation
vents in the masonry wall.
Fig. 5*10 shows that heat to the room is convected
by thermocirculation through the vents
starting for the day shown, 25th January 1968, at
9 am. The conducted heat through the wall reaches the
room at l.CO pm. The convected heat is more than the
conducted heat. The conducted heat continues late into
Re pr od uc ed w ith pe rm is si o n of th e co py ri gh t ow ner . Fu rthe r re production p ro h ib it e d wi th o ut p e rm is s io n .
January 2^,1068.
200
160 160
solar energy Into
surface of masonry
wall. tn 100 >-o DC lU z Ui
^-solar energy convected
through vents into space.
oc
< ^solar energy conducted
into space through wall.
_i
o in
HOUR OF DAY
FIG 5-10 Solar conduction and convection into space per ft window area for
a ten inch thick Trombe wall* Double glazed window* Indoor temperature
W ?8 e■ W 68
the night. Some convection occurs through the vents
during the early hours of the evening and stops at
7 pm.
A thicker wall means conducted heat will reach
the room later in the day. A thinner wall means
conducted heat will reach the room earlier in the
day resulting in higher room temperatures and lower
solar utilization.
5.11 MASONRY WALL SURFACE'AND ROOM AIR TEMPERATURE PLOTS
Fig 5*11 shows the temperature of the node on
the. surface of the masonry wall and the temperature
in the room (control node) for 25th January 1968 a
clear mid winter day. The plots are for a ^ inch
wall and a 10 inch wall.
Re pr od uc ed w ith pe rm is si o n of th e co py ri gh t o w ne r. Fu rthe r rep roduction p ro h ib it e d wi th ou t p e rm is s io n . rsi I-U. N 3 l— m v o cc UJ z Ui o: < _i o in 200 100 160 140 120 100 00 60 40 20 indoor temperature. a
% *e a
©
1
-solar energy into surface
of masonry wall.
* O
•ft inch masonry wall surface temperature.
% Ten inch masonry wall
/ surface temoerature.
<9 *
es &
f <*?
200 180* 160 HO* 120* 100* 00* 60* 40* 20*
1 4 0 10 11 12 13 14 15 16 17 18 19 20 21 22 HOUR OF DAY
FIG 5*11 Temperature plots for masonry wall surface and indoor. Double glazed four inch
and ten inch masonry wallsystem. (Windsor, Ontario). No insulating shutters.
23
Indoor temperature float Ttl|at= 78 F, Tm jn = 68 F. Avearge insulated building.
ECONOMICS
6.1 MATERIAL PRICES AND ECONOMIC VARIABLES
The economics of the Trombe wall system was based
on material prices and economic predictions for the
fall 1981* The prices of materials and other economic
variables are shown in Tables 6.1 and 6.2.
6.2 LIFE CYCLE COSTING
The life cycle costing formula used was:
NPV = ES * FC* SPWFm - CC
s m
where
NPV = the net present worth value of savings in
today's dollars.
ES= energy saved by the passive solar heating
system in the first year.
ES=Qwall + Qsolused
where Qwall is the loss which would have
occurred if ordinary wall construction,
as in the rest of the building, had
occupied the Trombe wall area.
Qsolused is the solar energy contribution
to the building.
FC= present cost of heating fuel
SFWF = the series present worth factor adjusted
39*
Tabl e 6 . 1 Prices of Trombe wall
Fall 1 9 8 1 in Windsor,
materials. Ontario.
Material Price
(Fall
in Windsor
1 9 8 1 )
1. Double glazing and installation.
$ 2 1 . 0 0 per ft2
2. Night insulating
shutters.
$ 1 1 . 0 0 per ft2
3. Concrete blocks 1 0 "
and installation.
$ 6 . 2 5 per ft2
4. Electricity cost. $ 8 . 8 8 per million BTU0
5. Cost of gas. $ 5 . 4 0 per million BTU
Table 6.2 Economic Variable
Variable Value
(Fall 1 9 8 1 )
1. Inflation 1 1 . 9 %
2. Fuel cost escalation to o • o
3. Interest rates long
term
1 8 . 0 %
Source Reference (11)
for fuel cost e s c a l a t i o n and inflation. SFWF is calculated using the formula
SFWF = ( |±|| ) * (1 - )N - )
where fe is the fuel cost escalation above inflation
d is the interest on investment loans above
inflation.
N is the expected lifetime of the passive
solar system.
CC= the extra capital investment to incorporate
passive solar heating.
Two cases.were considered in the economic analysis.
The first case assumed the Trombe wall was a completely
new investment. The second case assumed the building
would have window area equal to 7 percent of the floor
area originally set in the south facing wall. The passive
solar investment is then the masonry wall, night
insulating shutters if used and any extra glazing above
the original 7‘ percent.
6 -3 RESULTS
The results for a m a s o n r y w a l l equal to 15^ floor ajrea are g i v e n in T a b l e s 6.3 (a) (b) (c) and (d) . Th e Results show the p a y b a c k p e r i o d for a low insulated and average insulated b u i l d i n g for base w i n d o w a r e a and 7
%.
"he results are for a T r o m b e w a l l without night i nsulatingshutters and w i t h n i g h t i n s u l a t i n g shutters. T a b l e 6.3(a) ^nd (b)are for a low insulated b u i l d i n g (R8) and T a b l e s
42.
Table 6.3 (a) Payback period for Trombe wall with area equal to 159$ floor area. Double glazed window in Windsor. Low insulated building
(R8) With night insulating shutters over window.
Masonry wall area as a percentage °f heated floor ares
(1)* 7% window base Payback period
(years)
(2) 0% window base Payback period
(years)
15% 27.47 47.81
Table 6.3 (b) Payback period for Trombe wall with area equal to 15% floor area. Double glazed window in Windsor. Low insulated building
(R8) No night insulating shutters over windows.
Masonry wall area a percentage
of heated floor are;
15%
(1)* 7% window base Payback period
(years)
22.44
(2)^ 0% window base Payback period
(years)
31.85
(1) Window area equal to 7% of floor area originally assumed to be in south wall.
+
(2) No window area originally in south wall.
Table 6.3 (c) Payback period for a double glazed Trombewall with area equal to 15% of the floor area, in Windsor. Average insulated building (R20). With night insulating shutters on windows.
Masonry wall area (1)* 7% window base (2) + 0 % window base
as a percentage Payback period Payback period
°f heated floor area (years) (years)
15% 37.17 46.25
Table 6.3 (d) Payback period for a double glazed
Trombe wall with area equal to 15% of the floor area, in Windsor.
Average insulated building (R20). No night insulating shutters on windows.
Masonry wall area as a percentage
heated floor area
15%
(1)* 7% window base Payback period
(years)
33.77
(2) + 0 % window base Payback period
(years)
34.11
(1) Window area equal to 7% of floor area originally assumed to be in south wall
(2) No window area originally in south wall
6.3(c) and (d) are for an average insulated building (320).
The payback period for the masonry wall without
night insulating shutters is lower than that for the similar
situation with night insulating shutters. This result,
however, depends on the cost of the shutters, (which are
very expensive here). Cheaper shutters would shift the
lower payback period to the night insulated Trombe wall.
The payback period for a Trombe wall in a low insulated
building is shorter than for a Trombe wall in a higher
insulated building. This is because more energy is saved
by incorporating the passive solar heating system in the
low insulated building.
Life cycle costing for the conventional 30 year
period is shown in Table 6*4 for a Trombe wall with area
equal to 15^ of the floor area. The negative values mean
that the investment will not pay back, in 30 years.
Table 6.4 Life cycle costing for a Trombe wall of area equal to 15% of the floor area. Auxiliary heating by electricity.
CASE
Net Present Value Savings per ft^
glazing for N=30 yrs,
1. Low insulated building (R8)
a) 0% south window area base. b) 1%south window area base.
No shutters
2. Average insulated building (R20) a) 0%south window area base. b) 1%wouth window area base.
No shutters
2. Low insulated building (R8)
a) 0% south window area base. b) 1%south window area base.
With shutters
4. Average insulated building (R20) a) 0%south window area base. b) 1%south window area base.
With shutters
($ per ft glazing per yr.)
- $ 2.00
$ 7.73
■$ 6.38 -$ 2.53
•$18.32 $ 3.43
-$12.33 -$ 7.12
C H A P T E R VII .
SOLAR ENERGY COMPARISON FOR
TORONTO, OTTAWA, AND WINDSOR
Fig. 7.1 shows, for three Ontario cities ’Windsor,
Toronto and Ottawa, the solar energy contribution to heating 2
per ft glazing for each of the heating seasonnonths. The
plots are for an 18 inch thick masonry wall with double
glazing and no night insulating shutters.
The graphs are given for comparison of the expected
solar energy contribution in each of the cities for a Test
Reference Year.
A masonry wall system in Toronto has the highest
solar contribution to the building. Toronto is followed
by Ottawa and last is Windsor. There is a limitation in
the validity of this ranking because both Toronto and
Ottawa were run for Test Reference Year 1970 while Windsor
was run for the year 1968. (These are the tapes available,) .
There exists a possibility that 1970 was a much clearer
year in both Toronto and Ottawa than 1968 was in 'Windsor.
Secondly, there is a slight difference in the way solar
radiation data is handled for Canadian cities and U.S.A.
cities ('Windsor was run with Detroit, Michigan tape) . These
two points might explain the reason why Windsor has so
46.


![WoNeF, an improved, extended and evaluated automatic French translation of WordNet (WoNeF : amélioration, extension et évaluation d’une traduction française automatique de WordNet) [in French]](data:image/gif;base64,R0lGODlhAQABAIAAAP///wAAACH5BAEAAAAALAAAAAABAAEAAAICRAEAOw==)