ABSTRACT
MANDAPAKA VENKATA LAKSHMAN MURTHY. Effect of prolonged heating on the Asphalt-Aggregate Bond Strength of HMA containing Liquid Anti-strip Additives. (Under the direction of Dr. A.A. Tayebali and Dr. Detlef Knappe).
Effect of prolonged heating on the Asphalt-Aggregate Bond Strength of HMA containing Liquid Anti-strip Additives
by
Venkata Lakshman Murthy Mandapaka
A dissertation submitted to the Graduate Faculty of North Carolina State University
In partial fulfillment of the Requirements for the degree of
Master of Science
Civil Engineering
Raleigh, NC
2008
APPROVED BY:
Dr. A.A.Tayebali Dr. Detlef Knappe
(Chair of Advisory Committee) (Co-Chair of Advisory Committee)
Dedication
Biography
Acknowledgements
I am thankful to all of them who have helped towards the completion of my thesis. First of all I would like to thank Dr.A.A.Tayebali and Dr. Detlef R.U. Knappe who gave me the opportunity to take part in their research study. Their guidance and support made it possible to complete my research.
I would like to thank Dr.N.Paul Khosla for serving on my advisory committee. I would like to thank Dr. Phil Russell who has provided me the information about Monteith research Center, which helped me in the completion of the project. I sincerely thank Mr. Chuck Mooney and Roberto Garcia for the help they have given for my project at the research center.
I want to acknowledge my gratitude to the North Carolina Department of Transportation, sponsoring this research project and the North Carolina State University Department of Civil Engineering for their support. I want to express my sincere thanks to those people and agencies for their help and provisions of specimen and data for this research.
Table of Contents
List of Tables………vii
List of Figures………....ix
1. Introduction ... 1
2. Research Objectives ... 2
3. Literature review for asphalt-aggregate Adhesion ... 5
3.1 Background ... 5
3.2 Adhesion... 6
3.3 Asphalt-Aggregate adhesion mechanisms ... 8
3.4 Stripping ... 8
4. Evaluation of the Effect of Prolonged Heating on the Asphalt-Aggregate Adhesion Using Tensile Strength Ratio Test ... 11
4.1 Introduction ... 11
4.2 Job-Mix-Formula Evaluation and Revision ... 11
4.3 Evaluation of volumetric properties... 11
4.4 Tensile Strength Ratio Testing Sample preparation... 12
4.5 Test results and analysis... 14
4.6 Discussion of Test Results ... 15
5. Contact Angle Goniometer Test... 25
5.1 Theoretical background for Contact Angle Test ... 25
5.2 Goniometer overview... 26
5.3 Objectives and Task ... 28
5.4 Materials... 28
5.5 Preliminary tests performed with Goniometer ... 28
5.6: Standardization of the size of Asphalt droplet ... 31
5.7 Test Procedure... 32
5.8 Procedure for Goniometer test ... 33
5.9: Tests Results and discussion ... 34
5.10: Summary and conclusion ... 47
6. Pull-Off Test Using PATTI Device ... 50
6.1 PATTI Background ... 50
6.2 Objectives and Task ... 53
6.3 Materials... 53
6.4 Use of DSR to control the Thickness of the Asphalt film... 53
6.5 Preparation of specimens ... 54
6.6 Test results and Discussion ... 57
6.7: Summary and conclusion ... 62
7. Atomic Force Microscopy Test ... 63
7.1: AFM overview ... 63
7.2: Objectives and task ... 63
7.3: Materials... 63
7.4: Preliminary test to investigate the uniformity of the probes using Scanning Electron Microscopy... 64
7.5: Preparation of specimens ... 66
7.6: Procedure for AFM test... 67
7.6.1: A brief explanation of general force curve ... 67
7.7: Test results and discussion ... 69
7.8: Summary and conclusion ... 79
8. Summary and Conclusions... 80
References ... 83
List of Tables
Table No. Title Page
Table 3.1 Summary of the historical development in the field of determination of the
adhesive strength between the asphalt and aggregate [6]. ... 6
Table 3.2 Mechanisms explaining the asphalt-aggregate adhesion [7, 9 and 18]... 8
Table 3.3 Summary of Theories explaining the stripping phenomena [7, 18]... 10
Table 4.1 Gradations for Original JMF and Revised Lab Test ... 16
Table 4.2 Air Voids Data for samples containing no Anti-strip additive ... 16
Table 4.3 Air Voids Data of LOF 6500 Additive Samples... 17
Table 4.4 Air Voids Data of Morlife 2200 Additive Samples ... 18
Table 4.5 TSR Test Results: None Additive in Asphalt with 2-Hour Heating ... 19
Table 4.6 TSR Test Results: 0.8% LOF Additive in Asphalt without Prolonged Heating19 Table 4.7 TSR Test Results: 0.8% LOF Additive in Asphalt with 2-Hour Heating... 19
Table 4.8 TSR Test Results: 0.8% LOF Additive in Asphalt with 6-Hour Heating... 20
Table 4.9 TSR Test Results: 0.8% LOF Additive in Asphalt with 12-Hour Heating... 20
Table 4.10 TSR Test Results: 0.8% LOF Additive in Asphalt with 24-Hour Heating... 20
Table 4.11 TSR Test Results: 0.8% Morlife Additive in Asphalt without Prolonged Heating ... 21
Table 4.12 TSR Test Results: 0.8% Morlife Additive in Asphalt with 2-Hour Heating .. 21
Table 4.13 TSR Test Results: 0.8% Morlife Additive in Asphalt with 6-Hour Heating .. 21
Table 4.14 TSR Test Results: 0.8% Morlife Additive in Asphalt with 12-Hour Heating 22 Table 4.15 TSR Test Results: 0.8% Morlife Additive in Asphalt with 24-Hour Heating 22 Table 5.1 Results showing the importance of cleaning of Quartz slide with methanol.... 34
Table 5.2 Results obtained in the test that was performed to validate TSR test (asphalt with 0.5% LOF 6500)... 35
Table 5.3 Results showing the importance of Anti-Strip Additive in asphalt... 37
Table 5.4 Results to show the importance of volume control of droplet. ... 38
Table 5.5 Results of measured contact angles at 5, 10 and 15 minute test times at 1000 C ... 40
Table 5.7 Contact angle at 5 minute test time at various quantities of LOF 6500... 43
Table 5.8 Results showing the contact angles and volume adjustments of droplet ... 45
Table 5.9 Results showing the contact angles and volume adjustments of droplet ... 46
Table 6.1 Measured adhesive strength between virgin asphalt and quartz slide... 58
Table 6.2 Measured adhesive strength between asphalt with 0.75%LOF and quartz slide ... 59
Table 6.3 Comparison between the average POTS obtained for asphalt with additive (0.75%LOF 6500) and virgin asphalt against quartz slide... 60
Table 7.1 Average adhesive strength between virgin asphalt-glass beads (430 C) ... 73
List of Figures
Figure No. Title Page
Figure 1.1 Mass Loss of Pure Antistrip Additives as Function of Heating Time T = 150°C
... 2
Figure 1.2 Effect of Prolonged Heating on LOF 6500 Antistrip Additive. T = 150°C ... 2
Figure 2.1 Summary of research approach and methodology... 5
Figure 3.1 Stripping of asphalt due to lack of bond between the asphalt and aggregate [1] ... 9
Figure 4.1 Gradation Curves for Original JMF and Revised Lab Test ... 23
Figure 4.2 TSR Values of Non-Additive and 0.8% LOF Additive... 23
Figure 4.3 TSR Values of Non-Additive and 0.8% Morlife Additive ... 24
Figure 4.4 Loss in TSR with Prolonged Heating ... 24
Figure 5.1 Shows the direction of the surface energies working between various media 26 Figure 5.2 The sketch of contact angle goniometer ... 27
Figure 5.3 Contact angle goniometer ... 27
Figure 5.4 Captured Picture of Water Droplet on the Microscope, Quartz Slide at 25oC 29 Figure 5.5 Captured Picture of Water Droplet on the Microscope, Glass Slide at 25oC .. 30
Figure 5.6 Captured Picture of Asphalt Droplet on the Microscope, Quartz Slide at 135oC ... 30
Figure 5.7 Captured Picture of Asphalt Droplet on the Microscope, Glass Slide at 135oC ... 31
Figure 5.8 Mold designed to obtain reproducible quantities of asphalt droplet... 31
Figure 5.9 Results showing the importance of cleaning of Quartz slide with methanol... 34
Figure 5.10 Results obtained that validate TSR test results... 35
Figure 5.11 Results showing the importance of Anti-Strip Additive in asphalt ... 36
Figure 5.12 Results to show the importance of volume control of droplet. ... 37
Figure 5.13 The sample after testing for contact angle at 1350 C temperatures ... 39
Figure 5.14 The sample after testing for contact angle at 1000 C temperatures ... 40
Figure 5.15 Summary of the tests conducted ... 40
Figure 5.17 A plot between contact angle and duration of heating for various samples .. 42
Figure 5.18 A plot between contact angle and duration of heating for various samples .. 44
Figure 6.1 Pneumatic Adhesion Tensile Testing Instrument ... 51
Figure 6.2 The adaptor designed to control the thickness of the sample………...54
Figure 6.3 The adaptor fixed to the DSR ... 54
Figure 6.4 The specimen prepared with the thickness of 0.1mm asphalt film…………...57
Figure 6.5 The specimen placed in the piston... 57
Figure 6.6 shows schematic of the test set up for the adhesion pull-off test [18] ... 57
Figure 6.7 Graph showing variation of POTS with duration of heating (for pure asphalt and quartz slide) ... 58
Figure 6.8 Graph showing variation of POTS with duration of heating (for 0.75%LOF in asphalt and quartz slide)... 59
Figure 6.9 Graph showing variation of POTS with duration of heating (for pure asphalt and 0.75%LOF in asphalt and quartz slide) ... 60
Figure 6.10 Quartz slide with asphalt film after the test……….61
Figure 6.11Quartz slide and pull stub after the test (Cohesive failure)... 61
Figure 7.1 Scanning Electron Microscopy... 65
Figure 7.2 A comparison between the beads of two different probes selected at random 65 Figure 7.3 Chemical Composition of the Probes that were investigated for uniformity .. 66
Figure 7.4 Schematic of force curve obtained from the Atomic Force Microscopy... 68
Figure 7.5 Schematic of a typical cantilever deflection-vs.-piezo height (Zc-vs.-Zp ) curve (left) and corresponding Zc-vs.-D plot, with D = Zc + Zp (Butt et al. 2005) ... 69
Figure 7.6 The retrieval of the asphalt platform from the cantilever probe (1000 C). ... 70
Figure 7.7 The force curve obtained between virgin asphalt-glass bead (1000 C)... 71
Figure 7.8 The force curve obtained between virgin asphalt-glass beads (670 C) ... 72
Figure 7.9 Force curve obtained @430 C between virgin asphalt-glass beads ... 73
Figure 7.10 Force curve obtained at 430 C between asphalt (with 0.75%LOF)-glass bead ... 74
Figure 7.11 The pulled out bead stuck to the asphalt (containing anti-strip additive 0.75%LOF)... 75
1.
Introduction
NCDOT requires liquid organic antistrip additives in all asphalt mixtures to mitigate moisture damage. Findings of a recent NCDOT research study (Tayebali et al., 2005) indicate that liquid antistrip additives LOF 6500 and Morlife 2200, commonly used by NCDOT, volatilize and their presence in binder or mixture cannot be detected after as little as 12-24 hours of prolonged heating of the binder and 6-12 hours of prolonged heating of the asphalt mixture at nominal compaction and storage temperatures.
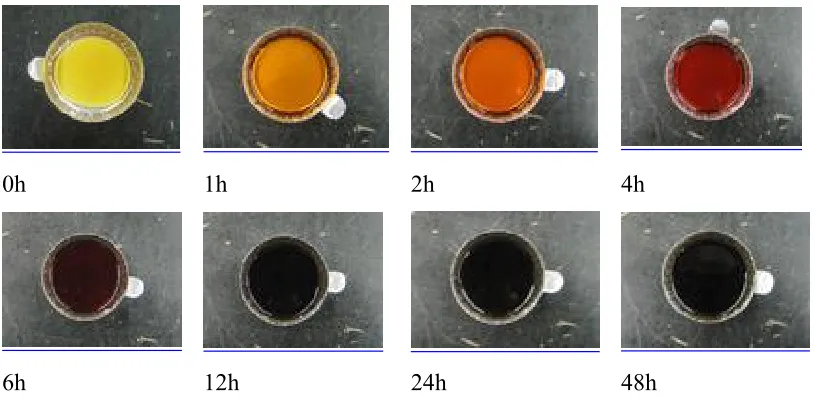
It can be argued that only lighter amine fractions from the antistrip additive are volatilized and that the heavier fraction (residue) remaining after volatilization may still represent an effective antistrip additive capable of mitigating moisture damage in mixtures. Results of the NCDOT research project HWY-2004-05 (Tayebali et al. 2005) indicate that mass losses after 24 hours of heating pure LOF6500 and Morlife2200 additive were 35 and 50%, respectively, as shown in Figure 1.1. The mass loss did not change appreciably between 24 and 48 hours. However, it was noted that the residue not only emitted a strong odor but was also smoky and changed color to brown-black as shown in Figure 1.2, which suggests decomposition (breakdown) in chemical composition. This raises a serious question regarding the effectiveness of the antistrip additive, that is, whether the loss of antistrip additive through volatilization and the eventual breakdown of the residue results in degradation of the asphalt-aggregate bond, which in turn could lead to moisture-sensitive mixtures.
0 20 40 60
Time (h)
M
as
s
L
o
ss
(
%
)
0 2 6 24 48 Morlife 2200
LOF 6500
Figure 1.1 Mass Loss of Pure Antistrip Additives as Function of Heating Time T = 150°C
0h 1h 2h 4h
6h 12h 24h 48h
2.
Research Objectives
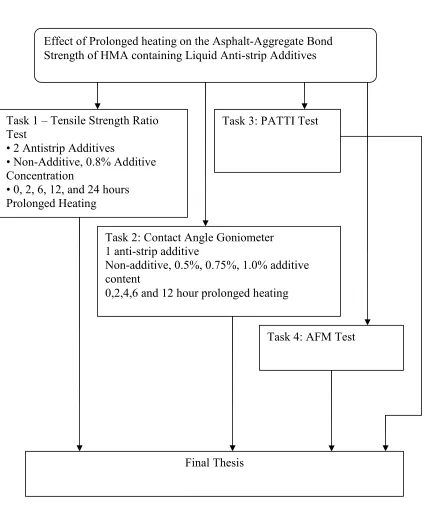
The objectives of this research are to determine the effect of prolonged heating on (1) asphalt-aggregate bond strength and (2) the moisture sensitivity of asphalt mixtures. In particular, this study will first evaluate the performance of mixtures using the tensile strength ratio (TSR) test, and second, study the effect of additive content and prolonged heating on the surface interaction between asphalt binder and aggregate. Figure 2.1 shows the work plan with individual tasks. The specific objectives of this study are:
Provide a literature review to determine the current state of knowledge regarding the nature and strength of the adhesive bond between asphalt binder and aggregate as well as the loss of adhesion due to moisture in the asphalt pavement.
Consult with NCDOT personnel in to identify required materials.
Using LOF 6500 and Morlife 2200 antistrip additives, prepare mixes and subject them to TSR testing using NCDOT procedure (modified AASHTO T283).
Determine the asphalt-aggregate bond strength through measurement of contact angle between asphalt samples containing LOF 6500 and Morlife 2200 antistrip additives and (1) a glass plate (i.e., a model aggregate surface) as well as (2) polished surfaces of aggregates commonly used in NCDOT mixes. Determine the effect of prolonged heating and moisture on contact angle.
Repeat objective 3 with a simple pull-test device.
Explore the use of atomic force microscopy (AFM) to measure asphalt-aggregate bond strength.
Correlate the results between tasks 2 to 5.
FLOWCHART
Figure 2.1 Summary of research approach and methodology Effect of Prolonged heating on the Asphalt-Aggregate Bond Strength of HMA containing Liquid Anti-strip Additives
Task 1 – Tensile Strength Ratio Test
• 2 Antistrip Additives
• Non-Additive, 0.8% Additive Concentration
• 0, 2, 6, 12, and 24 hours Prolonged Heating
Task 2: Contact Angle Goniometer 1 anti-strip additive
Non-additive, 0.5%, 0.75%, 1.0% additive content
0,2,4,6 and 12 hour prolonged heating Task 3: PATTI Test
Task 4: AFM Test
3.
Literature review for asphalt-aggregate Adhesion
3.1 Background
: The presence of the moisture normally causes the problem of3.2 Adhesion
: The measurement of the adhesion is of primary importance in many fields [3]. There are over 300 techniques for the determination of the adhesive strength between the coat and the substrate. This shows the extent of research that is being carried out in various fields in the act of determining the adhesive strength. The techniques are either qualitative or quantitative in nature. Most of these techniques are destructive in nature. As mentioned above, the kind of adhesion that is of primary importance for asphalt-aggregate is the practical adhesion. This adhesive measurement depends over various factors like the stress in the coating, thickness and them mechanical properties of the coatings, mechanical properties of the aggregate (substrate), work consumed by the plastic deformation or viscous dissipation, mode of failure, mode and rate of applying force or energy to detach the film, i.e. the technique used to determine the adhesive strength and the parameters of the technique [3]. The historical development for determination of the adhesive strength between asphalt-aggregate is summarized in the Table 3.1.Table 3.1 Summary of the historical development in the field of determination of the adhesive strength between the asphalt and aggregate [6].
Author Year Type of test
used Remarks
Engineers 1800's chew test[13]
The engineers used to chew the asphalt to determine the adhesion of the asphalt. If it adhered to their teeth, the asphalt passed the test and is good at adhesion.
Nicholson 1932
Riedel and Weiber 1934
Mc Leod 1937
Hubbard 1938
Powers 1938
Winterkorn et al. 1937
Boiling water test
Boiling Water test
Table 3.1 (continued).
Author Year Type of test
used Remarks
Saville and Axon 1937 boiling and
soaking test
Winterkorn 1937, 1938
and 1939
Krchma and Nevit 1942
Krchma and Loomis 1943
wash test, swell test, wet-dry test
Hveem 1943
These researchers have performed the tests and compared the stripping performance of various aggregates.
ASTM standard 1950
Immersion-Compression test
First moisture damage test on compacted specimens as per ASTM standard.
Thelen 1958
The researcher tried to determine the relationship between the surface energy of asphalt and aggregate to that of their bonding properties.
Andersland and Goetz 1956 sonic test
This researcher tried to evaluate the stripping resistance in compacted bituminous mixtures.
Johnson 1969
Schmidt and Graf 1972
Jimenez 1974
These four researchers tried to develop tests that could be used for the determination of the asphalt moisture mixture sensitivity.
Lottman 1978
Lottman procedure was a breakthrough in the determination of the moisture damage. This method was later standardized as the AASHTO test procedure T283.
Kennedy,Roberts,Anagnosand Lee
(UTA) 1982
Freeze thaw pedestal test
1984 Texas boiling test
This boiling test is almost similar to that of the test used by Saville and Axon (1937).
Western Research Institute Center
It determined that the displacement of the asphalt polar from aggregate by water varies by the asphalt source.
Ensley et al.
1984
asphalt-aggregate system
Table 3.1 (continued).
Al-Awailmi and Terrel (SHRP) 1992 developed environmental
conditioning system
1993
The Hamburg wheel-tracking device was introduced in
Aschenberner and Currier.
3.3 Asphalt-Aggregate adhesion mechanisms
: A number of theories havebeen developed by many scientists and researchers to explain the asphalt-aggregate bond formation.
These mechanisms have been summarized in Table 3.2:
Table 3.2 Mechanisms explaining the asphalt-aggregate adhesion [7, 9 and 18]
Theory General Principle Supporting Research Source
Mechanical Theory
Asphalt is forced into the pores and the irregularities of the aggregate surface, providing the mechanical interlock.
Knight 1938 (7), Lee and Nicolas 1954 (8) and Rice 1958 (6)
Chemical Reaction Theory
Chemical Reaction occurs between the absorbed asphalt and the constitutes of the aggregate phase.
Rice 1958 (6) and Maupin 1982 (9)
Molecular orientation Theory
Asphalt molecules orient themselves so as to satisfy the energy demands of the aggregate surface to the maximum of their capacity
McBain and Lee 1932 (10) and Mack 1957 (11)
Interfacial Energy Theory
Adhesion is a thermodynamic phenomenon related to the surface energy of the materials involved (asphalt,water,air and aggregate)
Thelen 1958 (12), Ishai and Craus 1977 (13)
Weak bond layer theory
Adhesion bond fails due to the presence of the
interfacial region of low cohesive strength J.Schultz and M.Nardin (1994)
3.4 Stripping
: The phenomenon of detachment of the asphalt layer from the aggregatepore pressure, and is influenced by the properties of the asphalt and aggregates [8]. As per the researchers, the performance of the asphalt due to the addition of the anti-strip additive is better in adhesion failure and is neutral in the cohesion failure. Review shows that the theories (summarized in Table 3.2) could not singly explain the phenomena of the field moisture damage due to the variability in the highway materials, environment, construction practices and the evaluation methods; and the complex interaction among them [8].The adhesion of asphalt to the aggregate is also governed by the presence of the clay over the aggregate. Clay is present in the form of aggregate or a thin layer around the aggregate. As the clay expands in the presence of the moisture, it forms a barrier between the asphalt and the aggregate; hence a poor adhesive strength is obtained [1]. Figure 3.1 shows the stripping of the asphalt from the aggregate due to lack of bond between them. Table 3.3 summarizes the theories explaining the stripping phenomena.
Table 3.3 Summary of Theories explaining the stripping phenomena [7, 18]
Theory General Principle Supporting Research Source Contact Angle
Theory or Mechanical Adhesion Theory
Asphalt is displaced because the contact angle of water is less than that of asphalt
Taylor and Khosla 1983(14), Stuart 1990(15), and Hicks et al. 1991(16)
Theory of interfacial energy or molecular orientation theory
Asphalt molecules are displaced from the aggregate surface because the surface energy of water is less than that of asphalt
Taylor and Khosla 1983(14), Stuart 1990(15), and Hicks et al. 1991(16)
Chemical Reaction Theory
Change in the pH value of the water around the aggregates affect the microscopic water at the mineral surface leading to the buildup of the opposing, negatively-charged electrical double layers on the
aggregate and the asphalt surfaces.
Taylor and Khosla 1983(14), Stuart 1990(15), and Hicks et al. 1991(16)
Pore Pressure or Hydraulic Scouring Theory
Pore pressure of water entrapped due to the mix densification under traffic results in the increased pore pressure on the asphalt films, leading to the rupture of the asphalt films.
Taylor and Khosla 1983(14), Stuart 1990(15), and Hicks et al. 1991(16)
Theory of Spontaneous Emulsification
Adhesion between the asphalt and aggregates is lost due to the formation of the inverted emulsion
4.
Evaluation of the Effect of Prolonged Heating on the Asphalt-Aggregate
Adhesion Using Tensile Strength Ratio Test
4.1 Introduction
: The adhesive bond strength between asphalt binder containingantistrip additive and aggregate was evaluated in this study using Tensile Strength Ratio (TSR) test method. On account of the substantial decrease of antistrip additive contents for both asphalt binders and mixes when subjected to prolonged heating, whether the loss of additive content due to storage and transport at elevated temperatures affects mix performance in terms of moisture sensitivity or not was evaluated in this study.
In this study, specimens were divided into two equal batches containing 0.8% LOF 6500 antistrip additive and Morlife 2200 antistrip additive in the asphalt respectively. Eight mixes of each batch were heated for 0, 2, 6, 12, 24 hours. Samples without antistrip additive were also produced to determine the effectiveness of the antistrip additive in preventing moisture damage.
4.2 Job-Mix-Formula Evaluation and Revision
: The asphalt binders andmixes used in this study were obtained from NCDOT. A PG 76-22 asphalt binder was used for all mixes, which is different from previous mixes used for litmus and colorimetric tests, that used PG 64-22. A copy of the original JMF provided by NCDOT is attached as Appendix A.
The JMF had batching percentages for the three aggregate constituents, baghouse fines, asphalt and antistrip additive. The aggregate fractions were 34 percent 78-M stone, 18 percent #67 stone, and 48 percent washed screenings. For these three aggregate constituents, the material passing the #200 sieve was removed. The proportions of aggregate constituents and baghouse fines were adjusted a little to increase the #200 sieve percent passing from 4.8% to 6.5%, which would increase the moisture susceptibility of mixtures. The gradation data are shown in Table 4.1 and gradation curves are plotted in Figure 4.1.
this JMF was a PG 76-22 produced by Conoco in Knoxville, TN. The design asphalt content was determined to be 5.6 percent by weight of the mix. The LOF 6500 antistrip additive was added to the asphalt cement at 0.8 percent by weight of the asphalt. The asphalt concrete was mixed in the laboratory at 163ºC and the maximum specific gravity was determined. Using AASHTO T 209 (Maximum Specific Gravity of Bituminous Paving Mixtures), the maximum specific gravity, Gmm, was found to be 2.530 compared
to the Gmm of 2.520 for the JMF.
C A
A Gmm
− =
Where:
A = mass of dry sample in air in grams
C = mass of water displaced by sample at 25ºC in grams
The quantity of each Superpave gyratory compactor (SGC) samples was calculated by use of experimental Gmm value. The target air voids of samples are 7% and
compacted at 143ºC for testing.
4.4 Tensile Strength Ratio Testing Sample preparation
: The moisturesusceptibility testing performed in this study followed the NCDOT modified AASHTO T 283 standard. This standard calls for sets of 6 to 8 specimens with a 150 mm diameter and a height of 95 mm. These specimens were compacted to a 7±1 percent air-void level; otherwise the sample would be discarded. The specimens were then divided into subsets with half being dry and the other half being moisture conditioned. The samples were conditioned in a 60ºC water bath until saturated between 50 and 80 percent. Once saturated, a Marshall indirect tensile test was performed on each specimen. The average tensile strength for each subset was then used to calculate the TSR value as shown below:
1 2
S S
TSR=
Where:
TSR=tensile strength ratio
S1=average dry sample tensile strength
After the TSR is calculated, it is compared to a minimum value to determine the level of moisture damage. The NCDOT acceptable minimum retained strength is 85 percent. Any mix that falls below this value is unsatisfactory and action must be taken to inhibit moisture damage. Two notable differences between the AASHTO T-283 standard and the test performed by NCDOT is the number of specimens and the freeze-thaw cycle. NCDOT uses eight specimens per subset while T-283 requires six. The freeze-thaw cycle, which is optional in T-283, is not used by NCDOT.
Each specimen was mixed at 163ºC and subsequently aged for four hours at 65ºC following the NCDOT specifications. The mixes were then heated for two hours at 143ºC, after which they were compacted using a Superpave Gyratory Compactor. The compaction of each specimen was controlled by height of 95 mm. After the samples fully cool down to room temperature, the bulk specific gravity of specimen was measured by AASHTO T 166 Saturated Surface Dry (SSD) method (Bulk Specific Gravity of Compacted Bituminous Mixtures Using Saturated Surface-Dry Specimens).
C B
A Gmb
− =
Where:
A = dry weight B = SSD weight C = submerged weight
Then air voids of samples were calculated.
Percent Air Voids =100 (Gmm- Gmb)/Gmm
*Specimen Nomenclature
In order to keep track of the large number of samples produced and tested throughout this study, the following specimen designation system was developed. The names of the subsets had 4 characters describing the type of antistrip additive, percentage of antistrip additive content, prolonged heating time and quantity of specimens. A list of the terms and meanings follows:
N – None additive
Second Character – Percentage of antistrip additive content 00 – none antistrip additive added to asphalt binder
08 – 0.8% antistrip additive added to asphalt binder Third Character – Prolonged heating time
12 – 12 hours prolonged heating
Fourth Character – Quantity of specimens
4.5 Test results and analysis
: A total of 88 specimens were prepared anddelivered to NCDOT for conditioning and testing. Out off the 88 specimens, 8 specimens were prepared based on the TSR sample procedure. The samples were prepared with pure asphalt (without adding antistrip additive). Following the NCDOT specifications the samples were mixed at 163ºC and subsequently aged for four hours at 65ºC. These mixes were then heated for two hours at 143ºC, after which they were compacted using a Superpave Gyratory Compactor. The air voids data of these eight samples are shown in Table 4.2. The remaining 80 specimens were divided into two equal batches containing 0.8% LOF 6500 and Morlife 2200 antistrip additives in the asphalt binders respectively. Eight specimens of each batch were heated for 0, 2, 6, 12, 24 hours at 143ºC respectively. The air voids data for samples containing LOF 6500 and Morlife 2200 are shown in Table 4.3 and Table 4.4.
high level but after that, the TSR values reduced. Based on the previous work performed by Chun and Dr.A.A. Tayebali [7], no antistrip additive content was detectable in asphalt mix after 6 to 12 hours of extended heating. In this test, after 12 hours of prolonged heating, the TSR values of mixes with LOF 6500 and Morlife 2200 antistrip additives are 77.2% and 79.3%, respectively. These values are slightly higher than TSR value of specimens with no additive, which is 71.1%. After 24-hour prolonged heating, the TSR values of mixes with LOF 6500 and Morlife 2200 antistrip additives are 76.3% and 67.4%, which are similar to or lower than TSR value obtained without additive.
The declining trend of the curve plotted between TSR test results vs. prolonged heating are shown in Figure 4.2 to Figure 4.4. The raw data for TSR test are shown in Appendix A.
4.6 Discussion of Test Results
: From the TSR test results, the improvement ofmoisture sensitivity using amine based antistrip additive was lost to a great extent after prolonged heating. It is seen that after only 6-hour heating, TSR values drop to about 80% for both LOF 6500 and Morlife 2200 antistrip additives, which are below the NCDOT standard value. Considering storage and transport as well as the duration between production and its ultimate paving in the field, this situation is very serious and needs due attention by NCDOT.
Table 4.1 Gradations for Original JMF and Revised Lab Test
Percent Passing Sieves (mm) JMF
Batching Revision
Control Points
37.5 100.0 100.0
25 99.8 99.9
19 98.2 98.5 100.0
12.5 90.1 91.7 90.0-100.0
9.5 82.3 85.0 <90.0
4.75 59.3 63.3
2.36 44.9 49.1 28.0-58.0
1.18 31.9 35.5
0.6 22.4 25.4
0.3 13.7 16.0
0.15 7.6 9.7
0.075 4.8 6.5 4.0-8.0
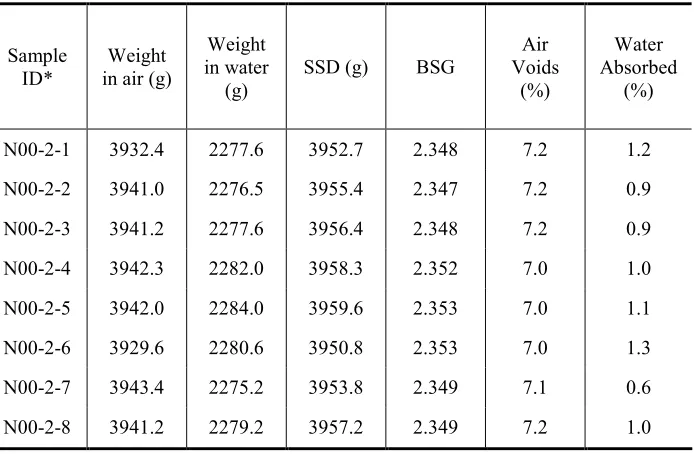
Table 4.2 Air Voids Data for samples containing no Anti-strip additive
Sample ID*
Weight in air (g)
Weight in water
(g)
SSD (g) BSG
Air Voids
(%)
Water Absorbed
(%)
N00-2-1 3932.4 2277.6 3952.7 2.348 7.2 1.2
N00-2-2 3941.0 2276.5 3955.4 2.347 7.2 0.9
N00-2-3 3941.2 2277.6 3956.4 2.348 7.2 0.9
N00-2-4 3942.3 2282.0 3958.3 2.352 7.0 1.0
N00-2-5 3942.0 2284.0 3959.6 2.353 7.0 1.1
N00-2-6 3929.6 2280.6 3950.8 2.353 7.0 1.3
N00-2-7 3943.4 2275.2 3953.8 2.349 7.1 0.6
Table 4.3 Air Voids Data of LOF 6500 Additive Samples
Sample ID Weight in air
(g)
Weight in
water (g) SSD (g) BSG Air Voids (%)
Water Absorbed (%)
L08-0-1 3911.5 2257.9 3928.2 2.342 7.4 1.0
L08-0-2 3929.5 2267.8 3949.0 2.337 7.6 1.2
L08-0-3 3924.7 2274.6 3946.8 2.347 7.2 1.3
L08-0-4 3938.9 2281.7 3955.7 2.353 7.0 1.0
L08-0-5 3940.5 2277.1 3956.5 2.346 7.3 1.0
L08-0-6 3942.9 2276.4 3962.1 2.339 7.5 1.1
L08-0-7 3939.5 2286.1 3958.5 2.356 6.9 1.1
L08-0-8 3934.4 2284.2 3961.2 2.346 7.3 1.6
L08-2-1 3928.3 2263.1 3945.7 2.335 7.7 1.0
L08-2-2 3942.9 2290.2 3954.3 2.369 6.3 0.7
L08-2-3 3942.7 2293.0 3955.7 2.371 6.3 0.8
L08-2-4 3913.2 2260.2 3927.4 2.347 7.2 0.9
L08-2-5 3905.1 2238.3 3913.3 2.331 7.8 0.5
L08-2-6 3933.0 2272.4 3949.4 2.345 7.3 1.0
L08-2-7 3930.5 2269.9 3940.2 2.353 7.0 0.6
L08-2-8 3919.0 2272.9 3944.5 2.344 7.3 1.5
L08-6-1 3933.7 2267.9 3945.9 2.344 7.3 0.7
L08-6-2 3928.9 2266.2 3942.1 2.344 7.3 0.8
L08-6-3 3943.6 2275.7 3955.6 2.348 7.2 0.7
L08-6-4 3939.1 2273.9 3954.1 2.344 7.3 0.9
L08-6-5 3941.7 2277.1 3954.8 2.349 7.1 0.8
L08-6-6 3936.8 2269.3 3946.8 2.347 7.2 0.6
L08-6-7 3934.9 2274.2 3952.5 2.345 7.3 1.0
L08-6-8 3933.1 2267.5 3946.1 2.343 7.4 0.8
L08-12-1 3908.4 2255.9 3919.8 2.349 7.2 0.7
L08-12-2 3913.0 2265.8 3930.2 2.351 7.1 1.0
L08-12-3 3929.0 2277.2 3936.5 2.368 6.4 0.5
L08-12-4 3949.8 2297.1 3962.1 2.372 6.2 0.7
L08-12-5 3927.7 2275.9 3936.3 2.366 6.5 0.5
L08-12-6 3935.9 2267.0 3946.0 2.344 7.3 0.6
L08-12-7 3934.5 2268.2 3941.7 2.351 7.1 0.4
L08-12-8 3941.6 2291.3 3965.7 2.354 7.0 1.4
L08-24-1 3934.7 2263.5 3946.3 2.338 7.6 0.7
L08-24-2 3934.5 2264.8 3947.6 2.338 7.6 0.8
L08-24-3 3935.1 2267.3 3949.2 2.340 7.5 0.8
L08-24-4 3944.9 2264.9 3952.5 2.338 7.6 0.5
L08-24-5 3940.3 2267.3 3953.4 2.337 7.6 0.8
L08-24-6 3946.3 2273.6 3957.3 2.344 7.4 0.7
L08-24-7 3939.6 2268.9 3952.1 2.341 7.5 0.7
Table 4.4 Air Voids Data of Morlife 2200 Additive Samples
Sample ID Weight in air
(g)
Weight in
water (g) SSD (g) BSG Air Voids (%)
Water Absorbed (%)
M08-0-1 3945.2 2277.7 3956.0 2.351 7.1 0.6
M08-0-2 3936.9 2269.4 3947.1 2.347 7.2 0.6
M08-0-3 3941.2 2267.5 3949.6 2.343 7.4 0.5
M08-0-4 3937.5 2266.7 3947.6 2.342 7.4 0.6
M08-0-5 3911.1 2244.5 3921.4 2.332 7.8 0.6
M08-0-6 3941.7 2275.1 3952.4 2.350 7.1 0.6
M08-0-7 3911.0 2249.4 3924.4 2.335 7.7 0.8
M08-0-8 3943.5 2273.8 3952.9 2.349 7.2 0.6
M08-2-1 3936.1 2273.4 3945.4 2.354 7.0 0.6
M08-2-2 3920.5 2259.1 3934.8 2.340 7.5 0.9
M08-2-3 3921.4 2260.9 3935.6 2.342 7.4 0.8
M08-2-4 3940.5 2281.3 3955.2 2.354 7.0 0.9
M08-2-5 3917.7 2252.2 3928.0 2.338 7.6 0.6
M08-2-6 3935.8 2282.4 3951.6 2.358 6.8 0.9
M08-2-7 3928.0 2274.3 3944.8 2.351 7.1 1.0
M08-2-8 3943.1 2278.3 3954.7 2.352 7.0 0.7
M08-6-1 3940.3 2270.6 3950.7 2.345 7.3 0.6
M08-6-2 3942.4 2266.5 3953.0 2.338 7.6 0.6
M08-6-3 3939.6 2267.4 3950.7 2.340 7.5 0.7
M08-6-4 3936.9 2266.6 3950.3 2.338 7.6 0.8
M08-6-5 3938.3 2266.5 3951.3 2.338 7.6 0.8
M08-6-6 3916.8 2249.4 3930.7 2.330 7.9 0.8
M08-6-7 3928.8 2258.5 3941.0 2.335 7.7 0.7
M08-6-8 3936.4 2268.9 3950.1 2.341 7.5 0.8
M08-12-1 3937.1 2274.1 3946.1 2.355 6.9 0.5
M08-12-2 3932.5 2262.3 3939.3 2.345 7.3 0.4
M08-12-3 3939.5 2273.8 3948.7 2.352 7.0 0.5
M08-12-4 3937.3 2271.2 3945.5 2.352 7.1 0.5
M08-12-5 3939.8 2272.8 3946.3 2.354 6.9 0.4
M08-12-6 3928.9 2269.7 3942.4 2.349 7.2 0.8
M08-12-7 3934.6 2277.8 3947.2 2.357 6.8 0.8
M08-12-8 3934.7 2269.0 3940.1 2.355 6.9 0.3
M08-24-1 3937.4 2258.7 3946.4 2.333 7.8 0.5
M08-24-2 3945.2 2262.5 3956.2 2.329 7.9 0.6
M08-24-3 3917.9 2247.6 3926.3 2.334 7.8 0.5
M08-24-4 3936.5 2264.6 3947.2 2.340 7.5 0.6
M08-24-5 3948.2 2268.7 3963.5 2.330 7.9 0.9
M08-24-6 3940.6 2256.3 3948.6 2.329 8.0 0.5
M08-24-7 3924.6 2252.3 3935.7 2.331 7.9 0.7
Table 4.5 TSR Test Results: None Additive in Asphalt with 2-Hour Heating
Unconditioned Specimens Conditioned Specimens
Sample ID Air Voids (%) Tensile Strength Mean Tensile Strength (lb) Sample ID Air Voids (%) Tensile Strength Mean Tensile Strength (lb)
N00-2-4 7.0 1397.0 N00-2-1 7.2 1052.2
N00-2-5 7.0 1522.4 N00-2-2 7.2 1069.9
N00-2-6 7.0 1516.7 N00-2-3 7.2 1075.4
N00-2-7 7.1 1501.8
1509.3
N00-2-8 7.2 1131.8
1072.6
Tensile Strength Ratio (%) 71.1
Table 4.6 TSR Test Results: 0.8% LOF Additive in Asphalt without Prolonged Heating
Unconditioned Specimens Conditioned Specimens
Sample ID Air Voids (%) Tensile Strength Mean Tensile Strength (lb) Sample ID Air Voids (%) Tensile Strength Mean Tensile Strength (lb)
L08-0-4 7.0 1023.5 L08-0-1 7.4 791.4
L08-0-5 7.3 1008.0 L08-0-2 7.6 819.6
L08-0-6 7.5 937.8 L08-0-3 7.2 936.3
L08-0-8 7.3 975.7
991.8
L08-0-7 6.9 847.9
833.8
Tensile Strength Ratio (%) 84.1
Table 4.7 TSR Test Results: 0.8% LOF Additive in Asphalt with 2-Hour Heating
Unconditioned Specimens Conditioned Specimens
Sample ID Air Voids (%) Tensile Strength Mean Tensile Strength (lb) Sample ID Air Voids (%) Tensile Strength Mean Tensile Strength (lb)
L08-2-4 7.2 1370.4 L08-2-1 7.7 1078.7
L08-2-5 7.8 1208.2 L08-2-2 6.3 1210.1
L08-2-7 7.0 1386.6 L08-2-3 6.3 1191.0
L08-2-8 7.3 1204.4
1289.3
L08-2-6 7.3 1151.8
1171.4
Table 4.8 TSR Test Results: 0.8% LOF Additive in Asphalt with 6-Hour Heating
Unconditioned Specimens Conditioned Specimens
Sample ID Air Voids (%) Tensile Strength Mean Tensile Strength (lb) Sample ID Air Voids (%) Tensile Strength Mean Tensile Strength (lb)
L08-6-4 7.2 1541.3 L08-6-1 7.3 1285.2
L08-6-5 7.1 1547.3 L08-6-2 7.3 1252.9
L08-6-7 7.2 1551.3 L08-6-3 7.3 1323.2
L08-6-8 7.4 1450.1
1544.3
L08-6-6 7.3 1282.5
1283.8
Tensile Strength Ratio (%) 83.1
Table 4.9 TSR Test Results: 0.8% LOF Additive in Asphalt with 12-Hour Heating
Unconditioned Specimens Conditioned Specimens
Sample ID Air Voids (%) Tensile Strength Mean Tensile Strength (lb) Sample ID Air Voids (%) Tensile Strength Mean Tensile Strength (lb)
L08-12-2 7.1 1975.3 L08-12-1 7.2 1457.7
L08-12-5 6.5 1981.5 L08-12-3 6.4 1478.5
L08-12-7 7.1 1876.4 L08-12-4 6.2 1705.7
L08-12-8 7.0 1818.9
1925.8
L08-12-6 7.3 1496.9
1487.7
Tensile Strength Ratio (%) 77.2
Table 4.10 TSR Test Results: 0.8% LOF Additive in Asphalt with 24-Hour Heating
Unconditioned Specimens Conditioned Specimens
Sample ID Air Voids (%) Tensile Strength Mean Tensile Strength (lb) Sample ID Air Voids (%) Tensile Strength Mean Tensile Strength (lb)
L08-24-5 7.6 1189.2 L08-24-1 7.6 955.7
L08-24-6 7.4 1078.4 L08-24-2 7.6 899.5
L08-24-7 7.5 1298.5 L08-24-3 7.5 839.3
L08-24-8 7.5 1236.2
1212.7
L08-24-4 7.6 915.9
925.7
Table 4.11 TSR Test Results: 0.8% Morlife Additive in Asphalt without Prolonged Heating
Unconditioned Specimens Conditioned Specimens
Sample ID Air Voids (%) Tensile Strength Mean Tensile
Strength (lb) Sample ID
Air Voids (%) Tensile Strength Mean Tensile Strength (lb)
M08-0-2 7.2 884.2 M08-0-1 7.1 816.9
M08-0-3 7.4 880.5 M08-0-2 7.4 755.7
M08-0-7 7.7 844.4 M08-0-5 7.8 739.1
M08-0-8 7.2 884.2
882.4
M08-0-6 7.1 797.4
776.6
Tensile Strength Ratio (%) 88.0
Table 4.12 TSR Test Results: 0.8% Morlife Additive in Asphalt with 2-Hour Heating
Unconditioned Specimens Conditioned Specimens
Sample ID Air Voids (%) Tensile Strength Mean Tensile
Strength (lb) Sample ID
Air Voids (%) Tensile Strength Mean Tensile Strength (lb)
M08-2-5 7.6 1196.2 M08-2-1 7.0 1083.1
M08-2-6 6.8 1283.8 M08-2-2 7.5 1026.7
M08-2-7 7.1 1265.2 M08-2-3 7.4 1062.1
M08-2-8 7.0 1246.2
1255.7
M08-2-4 7.0 1154.3
1072.6
Tensile Strength Ratio (%) 85.4
Table 4.13 TSR Test Results: 0.8% Morlife Additive in Asphalt with 6-Hour Heating
Unconditioned Specimens Conditioned Specimens
Sample ID Air Voids (%)
Tensile Strength
Mean Tensile
Strength (lb) Sample ID
Air Voids (%) Tensile Strength Mean Tensile Strength (lb)
M08-6-5 7.6 1444.1 M08-6-1 7.3 1232.7
M08-6-6 7.9 1429.4 M08-6-2 7.6 1119.9
M08-6-7 7.7 1521.1 M08-6-3 7.5 1136.4
M08-6-8 7.5 1478.1
1461.1
M08-6-4 7.6 1196.2
1166.3
Table 4.14 TSR Test Results: 0.8% Morlife Additive in Asphalt with 12-Hour Heating
Unconditioned Specimens Conditioned Specimens
Sample ID Air Voids (%)
Tensile Strength
Mean Tensile
Strength (lb) Sample ID
Air Voids (%) Tensile Strength Mean Tensile Strength (lb)
M08-12-4 7.1 1829.1 M08-12-1 6.9 1366.1
M08-12-6 7.2 1778.4 M08-12-2 7.3 1397.0
M08-12-7 6.8 1826.5 M08-12-3 7.0 1479.7
M08-12-8 6.9 1799.9
1813.2
M08-12-5 6.9 1531.6
1438.4
Tensile Strength Ratio (%) 79.3
Table 4.15 TSR Test Results: 0.8% Morlife Additive in Asphalt with 24-Hour Heating
Unconditioned Specimens Conditioned Specimens
Sample ID Air Voids (%)
Tensile Strength
Mean Tensile
Strength (lb) Sample ID
Air Voids (%) Tensile Strength Mean Tensile Strength (lb)
M08-24-5 7.9 1346.7 M08-24-1 7.8 412.0
M08-24-6 8.0 938.4 M08-24-2 7.9 745.4
M08-24-7 7.9 830.8 M08-24-3 7.8 447.0
M08-24-8 7.7 714.4
884.6
M08-24-4 7.5 1021.4
596.2
0 20 40 60 80 100
Sieve Size (mm)
P
e
rc
e
n
t
P
a
s
s
in
g
(
%
)
JMF Batching Revision Control Points
0 0.075 0.15 0.3 0.6 1.18 2.36 4.75 9.5 12.5 19 25 37.5
Figure 4.1 Gradation Curves for Original JMF and Revised Lab Test
60 70 80 90 100
No Additive
LOF-0h LOF-2h LOF-6hLOF-12hLOF-24h
Additive Type and Heating Time TSR %
NCDOT Standard: 85%
60 70 80 90 100
No Additive
MOR-0hMOR-2hMOR-6hMOR-12hMOR-24h
Additive Type and Heating Time TSR %
NCDOT Standard: 85%
Figure 4.3 TSR Values of Non-Additive and 0.8% Morlife Additive
60 70 80 90 100
Heating Time (h)
T
S
R
(
%
) LOF
M orlife
0 2 6 12 24 NCDOT Standard: 85%
5.
Contact Angle Goniometer Test
5.1 Theoretical background for Contact Angle Test:
“Contact Angle” canbe defined as the angle formed by a liquid over a solid at the intersection of the three phases (solid, liquid and gas) [7]. Contact angle test was developed to quantify the adhesive bond between a liquid and a substrate based on the surface free energy between them (in our case the liquid and the substrate are asphalt and aggregate respectively). The application of the contact angle test is not only confined in the determination of adhesive properties but also in the determination of colloid, lubrication and is also extensively used in the paint industry [9].The two techniques that are most popularly used to determine the contact angle are the Wilhelmy Plate technique and the Contact Angle Goniometer [10]. Contact Angle Goniometer was in this study used to determine the contact angle between asphalt and quartz/glass slide. The two methods in Goniometry are the Sessile Drop Method and the Pendant Drop Method. The best suited method to determine the contact angle between asphalt-aggregate is the Sessile Drop Method, because it allows us to measure the contact angle coincidently with the determination of the surface tension and moreover it also allows measurement of contact angle at high temperatures. [10].The principle of the Sessile Drop Method is the measurement of a contact angle between a known liquid over a solid surface [10, 11]. The size of the droplet should be considerably small, to avoid the effect of the gravity over the droplet. Hence, only the surface tension will act over the droplet [12, 13].
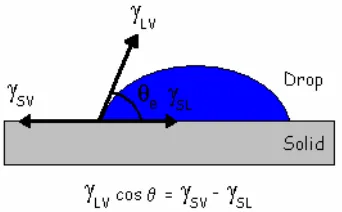
When the size of the droplet is small, the contact angle is controlled by the surface tension between the media [13] (solid-liquid, liquid-gas and gas-solid). The droplet comes to an equilibrium state exhibiting a constant contact angle when equilibrium is achieved between the surface tension (or surface energy) between the various media (as shown in Figure 5.1)
Figure 5.1 Shows the direction of the surface energies working between various media
γ
LV cos θ =γ
SV -γ
SL Equation 5.1Where,
γ
LV = surface tension between the liquid and vapor,γ
SV = surface tension between the solid and vapor,γ
SL = surface tension between the solid and liquid,θ = contact angle measured between the solid and liquid.
The other concept that is commonly used by the researchers to define the adhesive property is Work of Adhesion. Work of Adhesion can be defined as the work done on the system; when two condensed phases forming an interface, are separated to form unit areas of each with the interface
As the Work of Adhesion is high, it implies that the bond strength between the solid and the liquid is high, hence showing that there is a good bond between them. Based on the Young-Dupree equation (Equation 5.2), the contact angle that we obtain from the direct measurement using a Contact Angle Goniometer is inversely proportional to the work of adhesion. Hence, as the contact angle reduces, the work of adhesion increases which in turn shows that the adhesive bond between the solid and liquid is high.
Wa = σ (1+Cosθ) Equation 5.2
Where,
Wa = Work of Adhesion
σ = surface energy (Depending on the size of the droplet) θ = Contact angle between the liquid and the solid surface.
5.2 Goniometer overview:
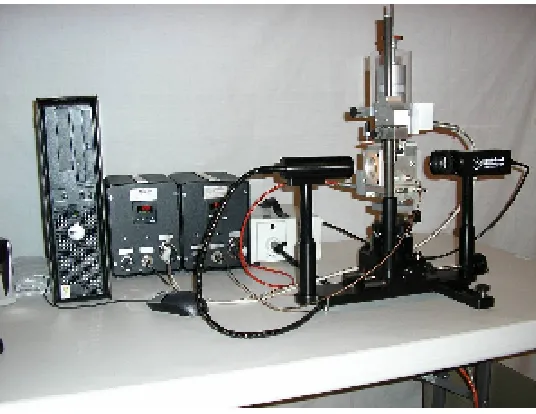
The Contact Angle Goniometer consists of a lightconnected to the computer and the image of the contact angle between the asphalt and the substrate captured by the camera is processed by computer. The DROP image software automatically calculates the contact angle of the captured image. Figure 5.2 & 5.3 shows the Contact Angle Goniometer.
Figure 5.2 The sketch of contact angle goniometer
1. Light Source 2. Microscope Camera 3. Platform 4. Solid Plate 5. Liquid Droplet 6. Environmental Chamber 7. Metal Needle 8. Micro syringe (1cc) 9. Elevated Temperature Syringe Chamber 10. Piston 11. Base of Instrument
5.3 Objectives and Task:
The main objective of this work was to determine the effect of prolonged heating and the anti-strip additive over the adhesive strength between asphalt and quartz/glass slide. This was attempted by observing the change in the contact angle between the asphalt and quartz/glass slide with different quantities of anti-strip additive (added to asphalt) and at different durations of prolonged heating.5.4 Materials:
The materials that were supplied by the North Carolina Department ofTransportation were PG 76-22 asphalt and LOF 6500 (Anti-Strip Additive). Quartz slides and glass slides were obtained from Chemglass (Glass Supply Company).The chemical composition of the microscopic glass slides that were obtained from the Chemglass is borosilicate. The dimension of the quartz slide and glass slide that were used in the experiments is 1inch by 1inch with thicknesses of 1/8 of an inch and 1/16 of an inch respectively.
5.5 Preliminary tests performed with Goniometer
: Various tests have beenconducted to determine the contact angle of water, anti-strip additive (LOF 6500 and Morlife 2200) and asphalt with respect to the glass slide and quartz slide. A brief summary of the procedure followed in order to determine the contact angle is described as follows. It should be noted that the contact angle of water is determined at 25o C and for asphalt and anti-strip additive the temperature of the environmental chamber was maintained at 135o C.
1) The designated temperature (as mentioned above) in the environmental chamber and the micro-syringe chamber are controlled during the test process.
2) The micro-syringe was used to place a drop of water/anti strip additive over the slide (quartz/glass). The quantity of the droplet was controlled by the micro-syringe. The quantity of the asphalt droplet was 0.01 ml and the water and anti-strip additive droplet was 0.02 ml.
3) The slide was placed inside the environmental chamber. It was left for 15 minutes to reach temperature equilibrium.
5) The contact angle of the liquid with respect to the slide was measured automatically with the help of the DROPimage software.
The captured pictures of water droplet on quartz and glass slides measured at 25oC are shown in Figure 5.4 and 5.5.The contact angle values are 36.2o and 61.1o respectively. The contact angle value for water-glass is in good agreement with the values observed in the published research [13, 15]. The captured pictures of asphalt droplet on quartz and glass slides at 135oC are shown in Figure 5.6 and 5.7. The contact angle value is 8.2o for asphalt droplet on glass slide, but it is too small to be measured for asphalt droplet on quartz slide.
Figure 5.5 Captured Picture of Water Droplet on the Microscope, Glass Slide at 25oC
Figure 5.7 Captured Picture of Asphalt Droplet on the Microscope, Glass Slide at 135oC
5.6: Standardization of the size of Asphalt droplet:
The primary problemthat was encountered was the volume of the droplet of asphalt that was placed over the glass slide or quartz slide. The variation of the quantity of asphalt for each test led to large variations in the contact angle measurements. Hence, to control the volume of the droplet a Teflon mold similar to that used for DSR test was used (Figure 5.8) that could control the volume of the droplet.
5.7 Test Procedure:
A procedure was developed to determine the contact angle of the asphalt with an aggregate slide as detailed in the following section.Preparation of samples:
A summary of the various steps taken in the preparation of the sample and the performance of the test is described as follows.
Apparatus required: Goniometer setup, steel scale, torch, cleaning cloth, citra-solv spray, methanol, and de-ionized water.
A) Preparation of the sample:
1) Preparation of the glass/quartz slide:
a) The quartz/glass slide was taken and first cleaned with soap.
b) The quartz/glass slide was cleaned with de-ionized water (distilled water) followed by methanol.
c) The cleaned glass/quartz slides were carefully placed on a clean aluminum foil (one per each piece of foil) and were neatly wrapped.
d) The neatly wrapped aluminum foils with the glass/quartz slides were put in an oven that was pre-set at a temperature of 105o C.
e) The glass/quartz slides were removed from the oven after one hour.
Note: The glass/quartz slides were un-wrapped from the aluminum foil only at the time of testing.
2) Preparation of the asphalt with 0.5% anti-strip additive:
a) The pure asphalt was placed in an oven at a temperature of 1500 C.
b) The anti-strip additive was measured for a quantity of 0.5 gm and is added to a clean container.
c) The pure asphalt that was placed in the oven is allowed to be in the oven until it was workable (30-45 minutes).
d) The liquid asphalt was taken out of the oven and a 100 Gms was added to the container containing the anti-strip additive and was stirred vigorously.
e) Hence the asphalt with 0.5% anti-strip additive is prepared for the testing purpose.
3) Preparation of the Mold:
b) The mold is thoroughly wiped with a tissue paper to avoid any dust in the cavity. c) The mold has to be stored in a clean place to avoid the intrusion of dust in the sample.
4) Preparation of the specimen:
a) The glass slide that was prepared was unwrapped from the aluminum foil. b) The asphalt sample that was prepared was placed in the oven at temperature of 1500 C for a period of 30-45 minutes before the sample was extracted.
c) The asphalt was thoroughly mixed for good dispersion of the LOF-6500 (anti-strip additive).
d) The asphalt was extracted from the container with the help of a syringe and needle and it is placed into the mold. Slightly additional asphalt is added to the mold as shown in Figure 5.8.
e) A steel scale was heated with the help of a torch for a period of 10-15 seconds. f) The stainless steel scale was used to wipe the excessive asphalt over the mold. g) Hence the asphalt present inside the cavity of the mold solidifies and forms in the form of a pellet.
h) The asphalt pellet was extracted with a sharp needle and it is placed over the glass /quartz slide.
B) Preparation of the instrument:
a) The instrument has to be calibrated prior to the usage.
b) The tilt of the instrument has to be checked at every measurement. (The level of the base tilt should not exceed 0.2 (constant).
c) The environmental chamber is set to the initial required temperature.
5.8 Procedure for Goniometer test:
The following procedure has been followedto perform the Goniometer test.
1) The prepared sample was placed in the environmental chamber that was pre-set for the initial temperature.
2) The sample was left at the initial temperature for 15 minutes for the stabilization of the temperature.
4) The temperature was increased at the rate of 50 C and measurements were taken for every 15 minutes with the help DROPimage software.
Following tests were performed in succession to the preliminary tests to obtain a better understanding over some parameters that affect the contact angle.
5.9: Tests Results and discussion:
The following tests have been done todetermine the effect of prolonged heating over adhesive strength between asphalt and glass/quartz slide.
Test 1: To determine the importance of cleaning the quartz/glass slide with methanol: The results are summarized as below in Figure 5.9 and Table 5.1
0 10 20 30 40 50 60 70
60 65 70 75 80 85 90 95 100
temperature (C) c o n ta c t a n g le contact angle(uncleaned) contact angle(water cleaned) contact angle(methanol cleaned-1) contact angle(methanol cleaned-2)
Figure 5.9 Results showing the importance of cleaning of Quartz slide with methanol
Table 5.1 Results showing the importance of cleaning of Quartz slide with methanol
Temperature (C) contact angle (uncleaned) contact angle(water cleaned) contact angle(methanol cleaned-1) contact angle(methanol cleaned-2)
70 53.2 58.7 52.6 50.5
75 46.5 44.5 42.2 44.7
80 40.1 37.1 34.8 35.7
85 35.3 32.5 31.8 32.2
90 32.5 32.1 26.6 29.5
95 28.8 28.9 25.9 22.3
Observations: As per the analysis of the results obtained, the contact angles obtained over the samples where the slides were cleaned by methanol were much closer to each other than the contact angles obtained from the samples for which the slides were uncleaned and cleaned by water. This showed the importance of cleaning of slides with methanol (glass/quartz/aggregate).
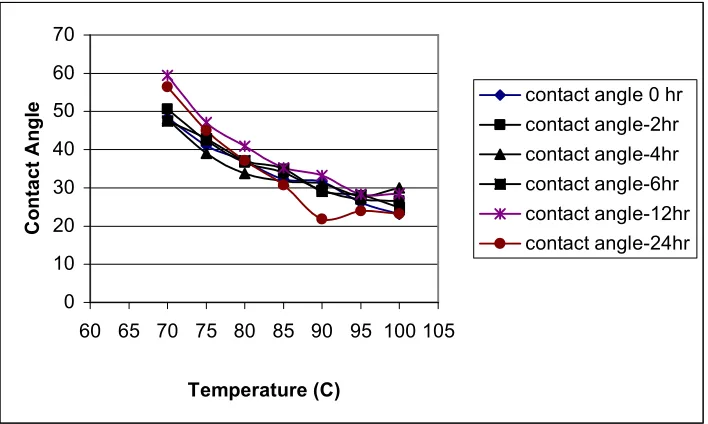
Test 2: This test was conducted to determine the validity of the result that was obtained from the TSR test. As per the results that were obtained from the TSR with respect to the prolonged heating, the adhesive strength (as measured by the tensile strength ratio) reduces when the asphalt is subjected to prolonged heating. This phenomenon has been tested by the application of Contact Angle Goniometer over asphalt (with 0.5% LOF) and a quartz slide. The results are summarized as below in Figure 5.10 and Table 5.2.
0 10 20 30 40 50 60 70
60 65 70 75 80 85 90 95 100 105
Temperature (C) C o n ta c t A n g
le contact angle 0 hr
contact angle-2hr contact angle-4hr contact angle-6hr contact angle-12hr contact angle-24hr
Figure 5.10 Results obtained that validate TSR test results
Table 5.2 Results obtained in the test that was performed to validate TSR test (asphalt with 0.5% LOF 6500)
Temperature (C) contact angle-0 hr contact angle-2 hr contact angle-4 hr contact angle-6 hr contact angle-12 hr contact angle-24 hr
70 48.4 50.7 48 47.6 59.5 56.4
75 41 42.4 39 42.9 47.2 45
80 37 36.6 33.7 37.1 40.9 37.1
85 32.3 34 31.7 35 35.2 30.7
90 31.6 29.4 31.1 29.1 33.3 21.8
Observations: Based on the principle of Work of Adhesion, as the contact angle between the liquid and the substrate is less, the adhesive bond strength between them is more. As per the analysis of the above results, as the heating time increased at the temperature of 700 C, the contact angle also increased. This result obtained at 700 C is in agreement with the TSR result that is as the prolonged heating duration increased the adhesive bond strength between asphalt-aggregate reduced. This agreement of results with the TSR couldn’t not be observed at other temperatures. However, it may be noted that there are some anomalies in preliminary results.
Test 3: Importance of Anti-Strip Additive in Asphalt: The determination of contact angle at various temperatures ranging from 95-1500 C has been done between asphalt (with and without anti-strip additive) and glass slide. The following results have been obtained. The results obtained in this test are summarized below in Figure 5.11 and Table 5.3.
0 5 10 15 20 25 30 35
90 95 10 0 10 5 11 0 11 5 12 0 12 5 13 0 13 5 14 0 14 5 15 0 temperature (C) c o n ta c t a n g le
contaqct angle ex1 0.5%LOF
contact angle ex2 0.5%LOF
contact angle 0%LOF-test 1
contact angle 0%LOF test 2
contact angle 0%LOF test 3
Table 5.3 Results showing the importance of Anti-Strip Additive in asphalt
Temperature (C)
contact angle test example1 0.5%LOF
contact angle test example 2
0.5%LOF
contact angle 0%LOF-test 1
contact angle 0%LOF test 2
contact angle 0%LOF test 3
95 29.8 25.8
100 26.1 24.6 27.5 24.6 26.2
105 24.8 24.6
110 24.3 21.7
115 22.6 20.5
120 22.6 19.5 28.5 23.4 26.6
125 23.2 21
130 23.8 17.9 29.5 25.1 26.9
135 24.6 18 28.6 27.2
140 24.8 21
150 24.4 21 23.8
Observations: As per the analysis of the above obtained results, we can find that the presence of anti-strip additive increases the adhesive strength (as the observed contact angles are in general, less than the contact angle obtained between asphalt and glass without additive).
Test 4: Importance of the Control of Volume of the droplet: Test was performed to determine the importance of the control of the volume of asphalt droplet. The test has been performed over asphalt and quartz slide. The results obtained in this test have been summarized as below in Figure 5.12 and Table 5.4.
0 5 10 15 20 25
90 95 100 105 110 115 120 125 130 135 140
temperature (C) C o n ta c t A n g le contact angle example1 contact angle example2
Table 5.4 Results to show the importance of volume control of droplet.
Temperature (C)
contact angle example 1
contact angle example 2
95 23.8 23.3
100 21.2 21.9
105 19.8 19.5
110 10.9 18
115 10.9 15
120 8.1 16
125 9 17
130 11 11
135 12 10
Observations: As per the analysis of the above results, the contact angles obtained at 950 C, 1000 C, 1050 C, 1300 C and 1350 C for the examples1 and 2 are close to each other. Such observation could not be obtained at the temperatures ranging from 1100 C to 1250 C. Based on the contact angle that was obtained at the initial temperature, it can be concluded that the control of volume helps to obtain reproducible results. As per the primary purpose of this test, the asphalt should be subjected to prolonged heating for specified durations. The asphalt is heating to the desired duration prior to the preparation of the sample. The results obtained at the higher temperatures could be discarded, as the duration of prolonged heating condition is not satisfied as the sample is subjected to different temperatures for longer time.
Analysis over the performed preliminary tests:
were performed with asphalt (with and without additive) against quartz slide. Furthermore, the captured pictures of asphalt with quartz/glass slides at various temperatures that are obtained from the above tests were observed and 1000 C was selected as the test temperature, as the curvature obtained at that temperature was smooth and also the temperature was sufficient for the activation of the asphalt. Figure 5.13 & 5.14 shows the captured pictures of asphalt droplet after testing at 1350 C and 1000 C respectively. Further tests performed are summarized in the Figure 5.15 as shown below.
Figure 5.14 The sample after testing for contact angle at 1000 C temperatures
Figure 5.15 Summary of the tests conducted
Test 5: This test was conducted to determine the contact angle between asphalt (with 0.5%LOF), and glass slide at different durations of heating (from 0 to 12 hours) for a test time of 5 minutes, 10 minutes and 15 minutes. The test was conducted to observe the change in contact angle at various test times to determine desirable test time. The data are summarized as below in Table 5.5 and Figure 5.16.
Table 5.5 Results of measured contact angles at 5, 10 and 15 minute test times at 1000 C
Duration of heating(hrs)
contact angle@ 0.5%LOF @5 min
contact angle@ 0.5%LOF @10 min) contact angle@ 0.5%LOF @15 min
0 30.8 25 23.8
2 31.2 26.4 25.8
4 32.8 28.2 26.3
6 35 28.2 27.1
12 47.2 36.8 34.4
Contact angle goniometer tests conducted with the
objectives being:
Test 5: To determine the effective test time for the determination of the contact angle.
Test 6: To determine the test time and the effect of LOF and prolonged heating on adhesive strength strength
Test 7: To ascertain the test 2 results at 5 min. test time.
0 5 10 15 20 25 30 35 40 45 50
0 2 4 6 8 10 12 14
duration of heating(hrs)
c o n ta c t a n g le
contact angle (5min)
contact angle (10min) contact angle (15min)
Figure 5.16 Results showing Contact angle determination at various test times
Discussion: The data show that the 5 minute test time duration gives consistently higher values than the 10 and 15 minute test time durations. No significant difference can be observed between the 10 and 15 minute test time duration. Moreover the trend in the data is very similar for all testing time duration.
The angles were observed to increase with the prolonged heating duration, and this result is in conformance with the TSR result where declining TSR values were observed. Note that larger contact angle corresponds to lower adhesive strength. In this particular test it was observed that the TSR values reduce as the value of the contact angle increases. Although, this trend was observed during this test, it could not be repeated in the following tests that were done. To the contrary, it was observed that no correlation could be ascertained between the contact angle and the results of the TSR test. In order to minimize the excessive heating of the asphalt sample, 5 minute test duration was chosen for further testing.
This test was done to observe the change in contact angle at various test times and also to determine the combined effect of anti-strip additive and prolonged heating over the adhesive strength between asphalt (with anti-strip additive) and quartz slide. The data are summarized in Table 5.6 and Figure 5.17.
Table 5.6 Contact angles at 5 and 10 minute test times with various quantities of LOF
Duration of heating(hrs)
contact angle 5 min
(0.5%L)
contact angle10 min
(0.5%L)
contact angle 5 min
(0.75%L)
contact angle10 min
(0.75%L)
contact angle 5 min
(1.0%L)
contact angle10 min
(1.0%L)
0 33.1 32.4 30.4 27.8 29.3 25.7
2 38.6 35 31.7 27.2 29 26.9
4 32.5 29.3 35.4 32.3 27 25.7
6 27.9 27 31 25.9 29.8 25.6
12 27.2 23.3 27.2 29.3
0 5 10 15 20 25 30 35 40 45
0 2 4 6 8 10 12
duration of heating (hrs)
c o n ta c t a n g le
contact angle 0.5%L 5 min
contact angle 0.5%L 10 min
contact angle 0.75%L 5 min
contact angle 0.75%L 10 min
contact angle 1.0%L 5 min
contact angle 1.0%L 10 min
Figure 5.17 A plot between contact angle and duration of heating for various samples
Discussion: The data show that there seems to be a variation in the trend observed between the results obtained at 5 minute, 10 minute, similar to the trend observed in test 5.
![Table 3.1 Summary of the historical development in the field of determination of the adhesive strength between the asphalt and aggregate [6]](https://thumb-us.123doks.com/thumbv2/123dok_us/1382754.1170943/19.612.85.525.412.686/summary-historical-development-determination-adhesive-strength-asphalt-aggregate.webp)