ABSTRACT
WANG, WEI-CHENG. Development of a Small Scale Continuous Hydrolysis Process for Drop In Biofuel Production. (Under the direction of Dr. William L. Roberts and Dr. Larry F.
Stikeleather.)
Drop-in biofuel production for replacing traditional liquid transportation fuel can be accomplished by converting oils and fats, which are composed mostly triglycerides, into high quality free fatty acid (FFA) and then turning the hydrolyzed FFA into long-chain hydrocarbons through deoxygenation. A small scale thermal hydrolysis of fats and oils in continuous mode is presented in this study with high temperature (250°C~270°C) and with high pressure in order to suppress the vaporization of liquid reactants. Countercurrent water and lipid flows provided mass transfer and enhanced mixing. Preheating water and oil inflow reduced heat exchange between the inflows and the reactants, and this offered 44% more FFA yield than non-preheating. Increasing reaction temperature improved water solubility in lipid phase and accelerated hydrolysis reaction. Higher excess water also provided better replacement for glycerol content in sweet water and resulted in a better FFA yield. The mass yield, calculated from the reactions with commercial off-shelf canola oil, camelina oil as well as algal oil, was approximately 89% ~ 93%. Moreover, the energy conversion efficiency is determined to be 75.66%.
low water-to-oil ratios. Within 300 minutes process time, glycerol was concentrated from 2~3% (from the reactor) to 5.5% (from the glycerol concentrator), and was expected to increase with extended reaction time. The high enthalpy of the steam and refined glycerol gave 78.64% of energy conversion efficiency, which was 2.98% more than the normal water/oil injection method.
The experimental data allowed the use of two famous methods for determining thermochemical properties; Peng-Robinson departure functions and the Joback group contribution method gave the kinetic model of the continuous hydrolysis reaction, including four equilibrium constants and eight rate constants of the reaction steps. The results provided the activation energy for all forward and reverse reactions under a variety of reaction temperatures. In addition, the results indicated that diglycerides (DG) in the lipid feedstock reduce the induction period for hydrolysis. Moreover, mass balance was found to be conserved by observing uniform carbon distribution. The results from kinetic modeling of hydrolysis, coupled with thermophysical and thermochemical properties as well as liquid flow behavior, were used to develop a CFD model using ANSYS-CFX software. By showing good agreements with experimental data, the concentration distribution of every component of hydrolysis was predicted.
Development of a Small Scale Continuous Hydrolysis Process for Drop-In Biofuel Production
by
Wei-Cheng Wang
A dissertation submitted to the Graduate Faculty of North Carolina State University
in partial fulfillment of the requirements for the Degree of
Doctor of Philosophy
Mechanical Engineering
Raleigh, North Carolina 2011
APPROVED BY:
________________________ ________________________
William Roberts Larry Stikeleather
Chair of Advisory Committee Committee Co-Chair
DEDICATION
BIOGRAPHY
Born in Tainan, Taiwan in 1979, Wei-Cheng is the son of Huang Wang and Wen-Song Chen. He grew up in Tainan, Taiwan, where he had eighteen years fantastic life. Graduated from Nan-Kwang High School, where he developed his physics and chemistry interests, he attended Feng-Chia University and took Aerospace Engineering as his major. Within the four years college life, Wei-Cheng realized that the challenges of air transportation are not only the design itself, but the jet-fuel that feeds the aircraft. After eighteen months in military service, he started working in United System Engineering Co., Ltd. and served as a project manager. He tested, characterized and demonstrated biodiesel performance for Taiwan EPA. During this work he realized that alternative energy, especially renewable fuel, will be very significant all over the world in the future. The United States, where biofuels has been developed for a hundred years, was going to be a good place to learn. This motivated him to study abroad and pursue a higher education.
ACKNOWLEDGEMENTS
This material is based upon work supported by the National Science Foundation under Grant NO. 0937721 “Algal Oils for „Drop in‟ Replacements for Petroleum Transportation Fuels”.
Professor William Roberts and Professor Larry Stikeleather, for their continuous guidance and assists. Professor Kevin Lyons, Professor Tiegang Fang and Professor Alexei Saveliev, for their kindly suggestions in the preliminary and final oral exam. Tim Turner, for his help teaching me the laboratory skills and getting me started Nirajan Thapaliya, Andrew Campos, Robert Netelson, Abhisheka Bhargava and Mengchen Yin, for their help in making the work progress and being good friends. Pinja Chen, Marco Yang, Sin-Wei Hsu, Yenming Chen and Hsien-Tzer Tseng, for bringing me smiles when the research work was getting me down.
Hsiang-Lin Tseng, for the insistent support.
TABLE OF CONTENTS
LIST OF TABLES ... viii
LIST OF FIGURES ...x
CHAPTER 1. INTRODUCTION ... 1
1.1 BACKGROUND AND REVIEW ... 1
1.1.1 Biofuel production... 1
1.1.2 Hydrolysis process ... 5
1.2 SPECIFIC AIM ... 10
1.3 CONTINUOUS HYDROLYSIS PROCESS ... 10
1.4 KINETIC MODEL FOR HYDROLYSIS REACTION ... 12
CHAPTER 2. LAB SCALE INVESTIGATION OF CONTINUOUS HYDROLYSIS REACTIONS . 14 2.1 INTRODUCTION ... 15
2.2 EXPERIMENTAL METHODS ... 19
2.2.1 Materials ... 19
2.2.2 Experimental ... 19
2.2.3 Sample Analysis ... 21
2.3 RESULTS AND DISCUSSIONS ... 23
2.3.1 CFD Simulation of Continuous Hydrolysis ... 23
2.3.2 Effect of water and oil preheating ... 26
2.3.3 Effect of reaction temperatures ... 27
2.3.4 Effect of water-to-oil ratio ... 28
2.3.5 Different feedstocks and mass yield from hydrolysis reaction ... 30
2.3.6 Energy balance for continuous hydrolysis reactions ... 31
2.3.7 Continuous vs Batch reactions ... 34
2.4 CONCLUSION ... 36
CHAPTER 3. SWEET WATER RECOVERY IN THE CONTINUOUS HYDROLYSIS OF TRIGLYCERIDES... 37
3.1 INTRODUCTION ... 39
3.2 EXPERIMENTAL METHODS ... 42
3.2.1 Apparatus ... 42
3.2.2 Co-feeding steam... 43
3.2.3 Sample analysis ... 44
3.3 RESULTS AND DISCUSSION ... 47
3.3.1 Glycerol Concentration in Sweet water during Hydrolysis Reactions ... 47
3.3.2 Glycerol refining process ... 49
3.4 FREE FATTY ACID CONVERSION FROM CONTINUOUS HYDROLYSIS REACTION WITH STEAM ... 52
3.4.1 Effect of co-feeding steam and pre-heating water/oil... 52
3.4.2 Effect of co-feeding steam and reaction temperatures ... 54
3.4.3 Effects of co-feeding steam at various water-to-oil feed rate ratios ... 55
3.5 ENERGY BALANCE CALCULATION ... 58
3.6 CONCLUSIONS ... 62
4.2 EXPERIMENTAL... 67
4.2.1 Apparatus ... 67
4.2.2 Reaction procedures ... 67
4.2.3 Sample analysis ... 68
4.3 KINETIC MODEL ... 70
4.4 RESULTS AND DISCUSSION ... 77
4.4.1 Mass Balance ... 91
4.5 CONCLUSIONS ... 92
CHAPTER 5. CFD SIMULATION OF CONTINUOUS HYDROLYSIS REACTIONS ... 94
5.1 INTRODUCTION ... 94
5.2 EXPERIMENTAL METHODS ... 97
5.3 MODEL DEVELOPMENT... 99
5.4 SIMULATION RESULTS AND DISCUSSION ... 112
5.5 CONCLUSIONS ... 121
CHAPTER 6. HYDROCARBON FUELS FROM VEGETABLE OIL ... 122
6.1 INTRODUCTION ... 122
6.1.1 Hydrolysis ... 123
6.1.2 Deoxygenation ... 126
6.2 EXPERIMENTAL METHODS ... 129
6.2.1 Hydrolysis ... 129
6.2.2 Deoxygenation ... 132
6.3 RESULTS AND DISCUSSION ... 135
6.3.1 Hydrolysis ... 135
6.3.2 Decarboxylation ... 140
6.4 CONCLUSION ... 145
CONCLUSIONS ... 146
REFERENCES ... 150
APPENDICES ... 160
LIST OF TABLES
Table 2-1 Properties of reactants and products of hydrolysis used in the CFD model [44] ... 25
Table 2-2 Hydrolysis results from different feedstocks; all reactions were conducted at 260 °C with 10 mL/min of oil feed rate and 40 mL/min of water feed rate ... 31
Table 2-3 Thermal dynamic analysis of continuous hydrolysis reaction based on the reaction conducted at 250 °C as well as 10 mL/min of oil and 20 mL/min of water ... 33
Table 2-4 Comparison of continuous and batch hydrolysis at different temperatures and water-to-oil ratios. Feedstock: canola oil ... 35
Table 3-1 thermodynamic analysis of continuous hydrolysis reaction ... 61
Table 4-1 thermochemical properties of all components from hydrolysis reaction ... 77
Table 4-2 the departure function of enthalpy and entropy of all components from hydrolysis reaction ... 77
Table 4-3 Mathematical expression for experimental curve fitting results ... 88
Table 4-4 rate constants, equilibrium constants and activation energy at three different temperatures ... 90
Table 5-1: Simulation settings ... 102
Table 5-2 Specified boundary conditions; simulation was based on the reaction conducted at 250°C as well as water flow rate of 20 mL/min and oil flow rate of 10 mL/min ... 103
Table 5-3 the coefficients of the density equations ... 104
Table 5-4 the coefficients of specific heat equation ... 105
Table 5-5 the coefficients of dynamic viscosity equation ... 106
LIST OF FIGURES
Figure 3-7 Effect on FFA conversion of co-feeding steam at a 2:1 water-to-oil ratio; reactor was maintained at 250 °C, and the feed rate of oil was 10 mL/min and of water was 20 mL/min ... 56 Figure 3-8 Effect on FFA conversion of co-feeding steam at a 2:1 water-to-oil ratio; reactor was maintained at 250 °C, and the feed rate of oil was 10 mL/min and of water was 30 mL/min ... 57 Figure 3-9 Effect on FFA conversion of co-feeding steam at a 2:1 water-to-oil ratio; reactor was maintained at 250 °C, and the feed rate of oil was 10 mL/min and of water was 40 mL/min ... 57 Figure 3-10 Energy conversion efficiency as a function of sweet water flow rate into the glycerol concentrator ... 60 Figure 4-1 Continuous hydrolysis system ... 69 Figure 4-2 Four steps of continuous hydrolysis reactions [60]... 71 Figure 4-3 GC-FID chromatogram of the starting material (1.DG; 3,4: TG(C48); 5: TG(C50);
6,7: TG(C52), 8: TG(C54), 9: TG(C56)); C48~C56 indicate the TG with 48~56 carbon number79
Figure 6-2 GC-FID chromatogram of the starting material-canola oil (1.DG, 3. TG (C48), 4.
TG (C50), 5. TG (C52), 6. TG (C54), 7. TG (C56)) ... 137
Figure 6-3 TG, DG and MG concentrations as a function of time; reaction was carried out at a temperature of 250 °C and feed rates of water was 20 mL/min and of oil was 10 mL/min ... 138 Figure 6-4 FFA and Gly concentrations as a function of time; reaction was carried out at a temperature of 250 °C and feed rates of water was 20 mL/min and of oil was 10 mL/min . 139 Figure 6-5 GC-FID chromatogram of the hydrolyzed sample at 300 minute reaction time; reaction was conducted at a temperature of 250 °C and feed rates of water was 20 mL/min and of oil was 10 mL/min. (peak #1: Glycerol ; #2: palmitic acid ; #3: oleic, linoleic and linolenic acid ; #4: stearic acid ; #5: arachidic acid ; #6: behenic acid ; #7,8: MG ; #9: DG) ... 139 Figure 6-6 CO2 and CO molar production rates and effluent mol% H2 for fed-batch
CHAPTER 1.
INTRODUCTION
1.1
Background and Review
1.1.1 Biofuel production
were studied as alternative fuel before the energy crises [5]. In addition, the well-known engine inventor, Rudolf Diesel, was also interested in these fuels [5]. For a liquid alternative fuel to be economically attractive and technically feasible to replace current petroleum fuel, the challenges of (1) feedstock harvesting, storage and lipid extraction, (2) agricultural policy due to food needs and prices, (3) commercially applicable scale, (4) process energy conversion, (5) process mass yield, (6) fuel quality and characteristics, (7) emissions from engine combustion, and (8) the biofuel must be cost competitive.
another alcohol under mild conditions (< 100°C) [7]. Three consecutive and reversible reactions are expected to occur [7]:
' catalyst
Triglyceride ROH diglyceride R COOR (1-1)
'' catalyst
Diglyceride ROH monoglyceride R COOR (1-2)
''' catalyst
Monoglyceride ROH glycerol R COOR (1-3)
triglycerides is conducted with high reaction pressure, which increases the equipment cost and reduces the economic feasibility. Moreover, hydrogen, considered as a reactant and used to break all C-O bonds, requires 12 mole for each mole of triglyceride to complete the reaction. Since hydrogen is viewed as another source of fuel, deoxygenation seems to be more applicable to generating the large quantities of renewable transportation fuel required to replace petroleum fuel. Kubickova et al. proposed that free fatty acid, such as stearic acid [11] and oleic acid [12], which is contained in vegetable oils, can be turned into diesel fuels through a deoxygenation process. Compared with hydrodeoxygenation, catalytic deoxygenation only requires 0 to 3 mole of hydrogen for each mole of triglyceride [9]. However, in order to obtain FFA for deoxygenation process, thermal hydrolysis has to be performed.
The study presented here focuses on the hydrolysis of crude lipid containing mostly triglycerides to generate FFA via removing the glycerol backbone as a means to produce hydrocarbon fuels via deoxygenation.
1.1.2 Hydrolysis process
aminolysis, therefore they are currently not important industrially. As mentioned in the previous section, FFA, generated from the hydrolysis reaction, is the target product to produce hydrocarbon fuel.
hydrogen ions in it which then accelerates the hydrolysis reaction. Therefore, hydrolysis of triglycerides with these reagents is catalyzed by the hydrogen ions instead of hydroxyl ions. There are two ways to increase the water solubility without reagents. One is to conduct the reaction with much higher temperature, which enhances not only the solubility of water in fats but the electrolytic dissociation of water [18]. Mills and McClain [20] found that at 233°C, the oil phase contains approximately 20% of water, but they form a single phase at 293°C. The other way is the autocatalysis of hydrolysis reaction by FFA. Water with FFA yields ions such as hydronium and hydroxide, which hydrolyze the glycerol backbone of any glycerides [21]. Minami and Saka [22] also proposed a hydrolysis model in which FFA dissociated to generate hydrogen ions, which catalyzes the hydrolysis reaction. The induction period, known as “emulsive hydrolysis” period, ends as soon as 10~20% of FFA in the reactant mixture [22, 23].
propylene glycerol, propionic acid and iso-propanol, with higher market prices [24]. Glycerol is also applied to make absolute alcohol via dehydration through Mariller-Granger process [25]. As an alternative fuel, glycerol can be used as a boiler fuel to produce process steam and generate electricity [24].
The metal contents such as sulfur, phosphorus as well as magnesium in vegetable oil derived FFA can cause problems in downstream processes if not removal. For example, they can deactivate the catalysts need for deoxygenation. These metal components are usually removed by degumming, alkali refining, bleaching and deodorization [26]. However, these components are still at a level after refining. Currently hydrolysis is considered as an alternative method to remove these three metal components [26]. The hydrogen ion and hydroxyl ion from water break off the bonds of the phospholipids and form palmitic acid and linoleic acid. Xu et al. [26] has also monitored the phospholipids content in crude tallow. It is found that the bulk of the phospholipids were in the glycerol sidestream after steam splitting.
H2O
+ 3
OH -H+
H+ OH -OH -H+ C C C H H H H H O O O C C C O O O
(CH2)16CH3
(CH2)7CH=CH(CH2)CH=CH(CH2)4CH3
(CH2)7CH=CH(CH2)7CH3
(TAG)
(CH2)7CH=CH(CH2)7CH3 C
O
O H
(CH2)7CH=CH(CH2)CH=CH(CH2)4CH3 C O
O H
(CH2)16CH3 C
1.2
Specific Objective
Thermal hydrolysis of lipid has been applied for many years in industry and lab-scale research. Batch mode hydrolysis has been predominant in lab-scale study. However, the qualitative and quantitative information on the thermodynamics, reaction conditions, chemical kinetics, product quality as well as engineering aspects of continuous hydrolysis reactions is limited. The objective of this work is to demonstrate the lab-scale continuous, non-catalytic, counterflow hydrolysis process using different reaction temperatures and water-to-oil ratios. The study of the recovery of sweet water, which is the water and glycerol mixture, as well as the examination of glycerol refining and effect of co-feeding steam is also examined. The kinetic model, generated from the equilibrium parameters of hydrolysis reaction steps and validated with a CFD model, is also developed. Finally, the end product of hydrolysis reaction, FFA, is applied to catalytic deoxygenation process and produce diesel-like fuel.
1.3
Continuous hydrolysis process
feed and the boiling point of the solvent is lower than that of the feed. This process has been modified by various companies for different applications. Commercial countercurrent splitting towers have been developed by Colgate-Emery, Badger, Foster-Wheeler and Lurgi [13], shown in Figure 1-2[30].
Figure 1-2 Commercial fat splitting process
In the Colgate-Emery process [31], fat is fed via a sparge ring at a point about 3 ft. from the bottom of the tower with a high-pressure pump and water is introduced at a point near the top of the tower. The fat rises through the sweet water section, passes through the oil-water interface into the oil layer where the hydrolysis reaction happens [32]. No stirring motion is needed because high temperature provides sufficient water in the oil from the beginning [23]. The countercurrent water also carries away the glycerol which hydrolysis forms. High temperature and pressure also provide short reaction time. The full countercurrent flow of water and oil gives high grade FFA.
temperature by direct feeding of steam. FFA is discharged from the top of the column and sweet water, which contains 12~18% of glycerol, is released from the bottom. In Foster Wheeler process, steam from the glycerol-water mixture can be used as another energy source for evaporating water content in the sweet water and this concentrates to 88% crude glycerol.
Figure 1-3 Foster-Wheeler continuous fat splitting process
1.4
Kinetic model for hydrolysis reaction
results from this simulation were in good agreement with the data from both the batch reactor [33] and the continuous stirred tank reactor [34]. Minami and Saka [22] proposed a second-order model for hydrolysis reaction and developed an autocatalytic mechanism for it. Because the study from Minami and Saka was focused on the effect of FFA on the autocatalytic reaction, the rate constant of triglycerides was assumed to be equal to those of diglycerides and monoglycerides. This research sufficiently modeled the concentration of FFA in the system but had no information about the simulation of triglycerides, diglycerides and monoglycerides. Moquin and Temelli [17] developed a kinetic study based on batch mode hydrolysis of canola oil in supercritical carbon dioxide (SC-CO2). This model
CHAPTER 2.
LAB SCALE INVESTIGATION OF CONTINUOUS
HYDROLYSIS REACTIONS
2.1
Introduction
Oils and fats have been viewed as the most important renewable raw materials of the chemical industry. They have been converted into high purity free fatty acid (FFA) to be used for chemical conversions and for the synthesis of chemically pure compounds [35]. Fatty acids are also used in a wide variety of end-use industries, such as commercial soap, cosmetics and pharmaceuticals production [13]. The total production of fatty acid in the world was estimated at 2×10⁶ ton in 1986 and increased to about 902×106 ton in 1994 [13]. Currently it is found that straight alkanes can be produced from FFA through a decarboxylation process [11], and these hydrocarbons are considered good replacements as petroleum-like diesel or other transportation fuels after suitable refining. In other words, FFAs are now an important precursor for next generation biofuel production.
Through hydrolysis of triglycerides, FFA was produced from oils or fats with subcritical water. There are numerous theoretical and experimental investigations of fat splitting. Under ideal stoichiometric conditions, fat splitting is a reversible reaction which requires the addition of three moles of water to one mole of triglyceride to produce three moles of fatty acids and one mole of glycerol. In practice, excess water is used to drive the equilibrium balance toward the desired product.
The hydrolysis reaction can proceed via either a batch or continuous process. The reaction requires relatively high temperatures. High enough pressure is maintained to keep the water, and hence the entire reaction, in the liquid phase. If a continuous process is used, a flow-through process can be expected to produce higher yields than a continuous stirred-tank reactor (CSTR), since hydrolysis is an equilibrium reaction under these conditions. Thermal hydrolysis of fats in a continuous process was first reported by Ittner [27]. The counter-flow process was operated at about 200°C and provided satisfactory yields. A wide variety of temperatures (185 °C – 315 °C) and pressures (10 bar – 110 bar) were investigated in a continuous counter-flow reactor [28]. A higher yield and rapid rate of splitting were obtained in their invention. These efforts led to the development of the Colgate-Emery process, which is still widely used today [31]. In the Colgate-Emery process, fat and water react in a counter-flow column at about 260 °C and about 50 bar. Heat transfer and mass exchange between fatty acid and water take place in the top portion of the column and between fat and sweet water in the bottom part. This method usually takes from 1-3 hours to accomplish 99% conversion. Also, this process can be operated with high throughput and with high yields without the use of a catalyst, and the quality of produced FFA is exceptionally good, particularly from high-grade fats. Recently, King et al. [37] proposed a semi-continuous reactor for hydrolyzing soybean oil with subcritical water in a very short time period, producing 100% yield of FFA using 338 °C and 5:1 water-to-oil ratio.
catalyst. Previous studies have identified the following factors that influence the hydrolysis rate:
(1) Reaction temperature: Increasing the reaction temperature not only improves the reaction rate but also increases the diffusion rate of water and glycerol into and out of the oil phase [38]. The higher the reaction temperature, the greater the solubility of water in oil and the faster the reaction occurs. For hydrolysis with pure water without any catalyst, much higher temperatures are needed to increase both the solubility of water in oil phase and the electrolytic dissociation of this water [39]. There are some reports showing that the fatty acid solubility increases with the increasing of temperature [40].
Patil et al. [33] has found that in batch hydrolysis reactors, higher acid value will be measured at higher temperatures. Another study indicated that a temperature increase of 10°C produces a rise of reaction rate of 1.2 to 1.5 times [18]. Sturzenegger [41] found that hydrolysis attains equilibrium 5 times faster when temperature is increased from 225 °C to 280 °C [39]. Correspondingly, lowering the temperature from 250 °C to 200 °C and keeping the other parameters constant have shown a dramatic decrease in conversion rates [17]. These results confirmed that temperature has a considerable influence on the reaction rates of non-catalyzed hydrolysis.
(2) Water-to-oil ratio: The initial ratio of water-to-oil affects the degree of hydrolysis. Higher water-to-oil ratio shifts the equilibrium balance in favor of product [42]. King et al.
of FFA yield as the water-to-oil volume ratio was increased from 3:1 to 17:1and 70:1 in supercritical CO2.
2.2
Experimental Methods
2.2.1 Materials
The basic materials used in this study were commercial canola oil and distilled water obtained from a local grocery store. The other feedstocks were refined, bleached and deodorized (RBD) canola oil purchased from Jedwards International Inc. (Quincy, MA), camelina oil from Touchet Seed & Energy (Touchet, WA), and algal oil from Eldorado Biofuels (Santa Fe, NM).
2.2.2 Experimental
which control the ovens in on-off mode. The power consumption of the heaters was adjusted by tuning the inductive circuits, with a maximum power of 1.8 kW per coil. The heaters are capable of bringing the upper and lower parts of the reactors to the desired temperature in about 120 minutes.
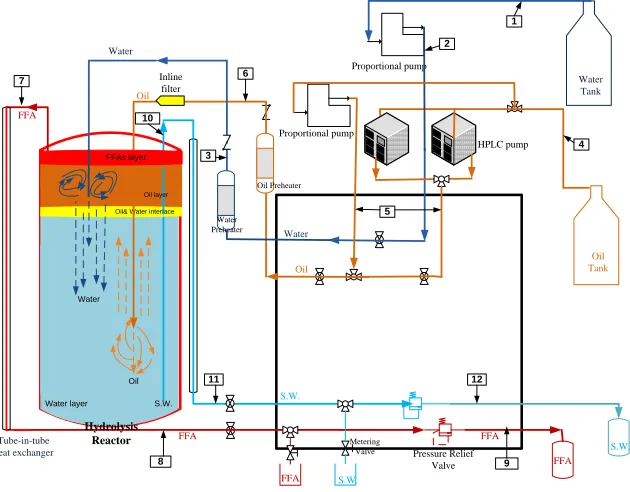
For a hydrolysis reaction, the reaction temperature was set between 250-270 °C. Water was pumped into a column with a fluid volume of 600 mL. Oil was pumped into a second column with a 154 mL volume. Both columns were heated to 250 °C by induction coils similar to those described above. Experiments with and without water and oil pre-heating were conducted. Water was injected at a point about 25 cm below the top of the reactor and oil was injected about 120 cm below the top of the reactor. By the difference of densities, water and oil flow counter-currently, which also enhances mixing.
During the continuous reaction, the FFA and the sweet water streams leaving the vessel were cooled by a tube-in-shell heat exchanger. Pressure was controlled via Swagelok back pressure relief valves. The flow rates of the FFA and sweet water were maintained by Swagelok metering valves. The purity of the product was obtained by comparing the acid value, which is proportional to the molar fraction of free fatty acid present, to the saponification value, which is proportional to the total number of moles of bound and unbound fatty acids.
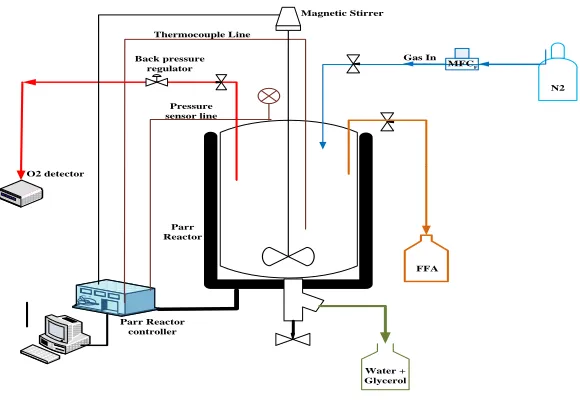
is equipped with 3600 W ceramic fiber heaters which are designed to provide uniform heat distribution to the walls and bottom of the vessel. A thermowell is inserted in the heater to accommodate an external J type thermocouple for contact with the outside vessel wall. The reaction temperature and pressure were controlled by the Parr 4857 process controller and operated through CAL GRAPHIX interface. During a run, the reactants were constantly stirred at 600 rpm via the stirrer driven by DC variable speed motor and manually or automatically controlled by Parr 4857 process controller. After purging with N2, appropriate
amounts of water and canola oil were heated to 270 °C and reacted for 2 hours without any catalytic agents. The FFA product stream was released from the upper part of the reactor and sweet water was released from the bottom part.
2.2.3 Sample Analysis
The concentration of glycerol in the sweet water was tested by measuring the density via a density meter (Model: DMA 5000M, Anton Paar, Graz, Austria). The glycerol concentration was calculated by interpolating the density data with the glycerol-water solution [45].
FFA FFA FFA S.W. Proportional pump Water Tank Oil Tank Oil Oil Water S.W. FFA Water HPLC pump Inline filter Pressure Relief Valve Oil Preheater S.W. Proportional pump Water Preheater Tube-in-tube heat exchanger Metering Valve FFA S.W.
Oil& Water interface
S.W. Oil FFAs layer Water layer Oil layer Water Hydrolysis Reactor 1 3 4 5 6 7 2 10 11 9 12 8
Figure 2-1 Continuous hydrolysis system (numbers indicates states of energy input and output in Table
Figure 2-2 Batch hydrolysis system
2.3
Results and discussions
2.3.1 CFD Simulation of Continuous Hydrolysis
To gain a better understanding of the reactant and product distributions inside the reactor as well as the reaction performance, a simulation modeled by ANSYS-CFX (Ansys, Inc.) has been carried out (Figure 2-3). The analysis of computational fluid dynamics (CFD) for continuous hydrolysis was based on the properties of reactants and products of the reaction at 250 °C, as shown in Table 2-1, along with the reaction kinetics. The hydrolysis reaction is shown as [17]:
(2-1)
(2-2)
F
N2 MFC
Thermocouple Line
Pressure sensor line
O2 detector
Parr Reactor controller
Water + Glycerol
Gas In Back pressure
regulator
Parr Reactor
Magnetic Stirrer
FFA
1 2
3 5( )3 2 3 5( ) (2 )
k k
C H COOR H O C H COOR OH RCOOH
3
4
3 5( ) (2 ) 2 3 5( )( )2
k
k
(2-3)
(2-4) Where (C3H5(COOR)3), (C3H5(COOR)2(OH)), (C3H5(COOR)(OH)2), (RCOOH) and (
3 5
3H (OH)
C ) represent triglyceride (TG), diglyceride (DG), monglyceride (MG), FFA and glycerol (GLY), respectively. The rate equations can be described as follows:
2
2
5 6 1 2
TG
TG MG DG TG H O DG FFA
dC
k C C k C k C C k C C
dt (2-5)
2 2
2
5 6 3 4 7 8
MG
TG MG DG DG H O MG FFA MAG H O GLY FFA
dC
k C C k C k C C k C C k C C k C C
dt (2-6)
2 2
2
5 6 1 2 3 4
2 2
DG
TG MG DG TG H O DG FFA DG H O MG FFA
dC
k C C k C k C C k C C k C C k C C
dt (2-7)
2
2 2 2
1 2 3 4 7 8
H O
TG H O DG FFA DG H O MG FFA MG H O GLY FFA
dC
k C C k C C k C C k C C k C C k C C
dt (2-8)
2 2
1 2 2 3 4 7 8
FFA
TG H O DG FFA DG H O MG FFA MG H O GLY FFA
dC
k C C k C C k C C k C C k C C k C C
dt (2-9)
2
7 8
GLY
MG H O GLY FFA dC
k C C k C C
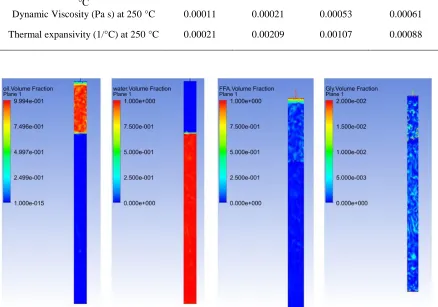
dt (2-10) For the given rate constants [17], the results showed that oil distributes slowly to the upper part of the reactor and water stays in the lower part. When the reaction happens, FFA is formed at the oil and water interface, and flows upward and accumulated at the very top of
5 6
3 5( )3 3 5( )( )2 2 3 5( ) (2 )
k k
C H COOR C H COOR OH C H COOR OH
7 8
3 5( )( )2 2 3 5( )3
k
k
the vessel. Glycerol, produced at the same location, flows downward and mixes with the water at the bottom.
Table 2-1 Properties of reactants and products of hydrolysis used in the CFD model [44]
water canola oil FFA glycerol
Molar Mass (g/mole) 18.02 878 282.46 92.09
Density (g/cm3) at 250 °C 0.798 0.753 0.734 1.09
Heat Capacity (J/mole K) at 250 °C 87.38 2187.98 1030.00 349.94
Thermal conductivity (W/m K) at 250 °C
0.62 0.15 0.08 0.32
Dynamic Viscosity (Pa s) at 250 °C 0.00011 0.00021 0.00053 0.00061
Thermal expansivity (1/°C) at 250 °C 0.00021 0.00209 0.00107 0.00088
Figure 2-3 Volume fractions of the components from ANSYS-CFX simulation (from left to right: Oil,
water, FFA, Glycerol). The reaction was simulated at 250 °C, 20 mL/min of water feed rate and 10
2.3.2 Effect of water and oil preheating
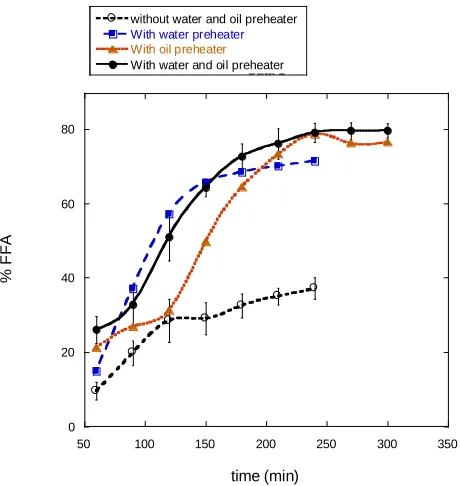
As described by Mill [28], water and oil were pre-heated to the reaction temperature before entering the reactor. Pre-heating water and oil is actually used to avoid heat exchange between the new feed pumped into the reactor and the reactants in the vessel within the hydrolysis reaction. Water and oil pumped into the reactor without pre-heating will reduce the reaction temperature at some parts of the reactor and decrease hydrolysis rate. As the experimental results shows in Figure 2-4, at a reaction temperature of 250 °C and an water-to-oil ratio of 2:1, pre-heating both water and oil at 250 °C provided 79%~82% FFA yield when reaching steady-state, 44% more than no pre-heating, 10% more than only pre-heating water and 3% more than only pre-heating oil.
Figure 2-4 Effect of preheating water and oil on FFA % yield; reaction was carried out at a constant
temperature of 250°C and oil feed rate of 10mL/min and water feed rate of 20mL/min
0 20 40 60 80
50 100 150 200 250 300 350
Data 1
without water and oil preheater
With water preheater With oil preheater
With water and oil preheater
%
F
F
A
2.3.3 Effect of reaction temperatures
Figure 2-5 FFA conversions at different temperatures; water was fed at 20 mL/min and oil was fed at
10 mL/min
2.3.4 Effect of water-to-oil ratio
The water-to-oil ratios in this study represent the ratio of inflow rates for the two reactants. To obtain a better conversion to FFA, the instantaneous or final glycerol concentration must be kept low [18] or washed out countercurrently [16]. In the continuous hydrolysis reactor, as the reaction reached equilibrium, glycerol concentration in sweet water, calculated from the density of glycerol-water solution [45], was reduced faster when more fresh water was applied. As shown in Figure 2-6, glycerol concentration tracks very closely with FFA yield, which represents the progress of the reaction. The highest glycerol concentration measured was 2.03%, at the time the hydrolysis reached equilibrium. The best way to improve the hydrolysis level is replacing glycerol-water phase by adding fresh water as soon as the
10 20 30 40 50 60 70 80 90
50 100 150 200 250 300 350
250°C
260°C 270°C
upper: 260°C; lower: 200°C
%
F
F
A
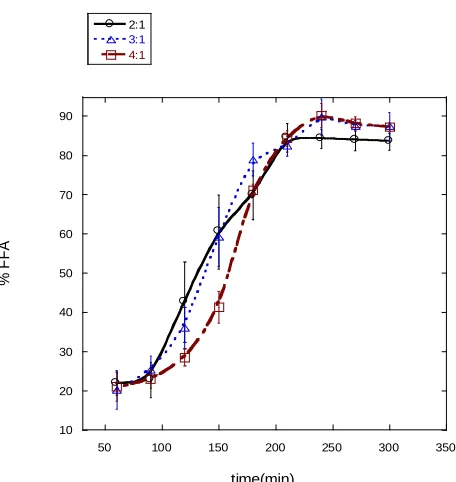
reaction rate slows down [18]. In addition, higher excess water improves the forward reaction rate in each of the reaction steps and accelerates the completion of hydrolysis. Higher water-oil ratio, shown as Figure 2-7, has a lower reaction rate at first, but results in a higher yield eventually. As Figure 2-7 demonstrated, compared with 2:1 water-to-oil inflow ratio, continuous hydrolysis with 4:1 water-to-oil ratio was 14~19% lower before 210 minutes but 7~8% higher as the reaction reached steady-state. It is thought that as the reaction reached equilibrium, the condition with 20 mL/min water feed rate (2:1 ratio) had insufficient fresh water to flush out the glycerol content in sweet water and this limited the extent of the hydrolysis reaction.
Figure 2-6 The variation of FFA and Glycerol concentration for continuous hydrolysis reactions;
reaction was conducted at 250 °C as well as 20 mL/min of water feed rate and 10 mL/min of oil feed rate 0
20 40 60 80 100
0 0.5 1 1.5 2 2.5
50 100 150 200 250 300 350 400
% FFA % Glycerol
%
F
F
A
%
G
ly
c
e
ro
l
Figure 2-7 The effect of hydrolysis with various water-to-oil ratios at a constant reaction temperature of
250 °C. The feed rates of oil was 10 mL/min and of water was 20-40 mL/min
2.3.5 Different feedstocks and mass yield from hydrolysis reaction
Table 2-2 shows FFA yield, profile and concentrations as well as the mass yield of the reaction, for the continuous hydrolysis reactions for the four different feedstocks; canola oil (raw and RBD), camelina oil and algal oil. Hydrolyzed canola oil and algal oil contain mostly oleic acid and linoleic acid while camelina contains a significant amount of alpha-linolenic acid. For the same experimental conditions, a 260 °C reaction temperature and 4:1 water-to-oil ratio, a FFA yield of 91% at equilibrium was obtained from these four feedstocks. Due to the removal of the glycerol backbone, every one mole of triglycerides will lose one mole of glycerol. Therefore, the theoretical mass yields of these four feedstocks are 96.3%, 96%, 95.9% and 89.8%, respectively. As Table 2-2 described, mass conversion ranged from 89~93%, showing a high mass yield in this process.
10 20 30 40 50 60 70 80 90
50 100 150 200 250 300 350
2:1 3:1
4:1
%
F
F
A
Table 2-2 Hydrolysis results from different feedstocks; all reactions were conducted at 260 °C with 10 mL/min
of oil feed rate and 40 mL/min of water feed rate
Canola oil RBD canola oil Camelina oil Algal oil
FFA yield at steady state (%) 95.46 93.45 91.49 93.4
FFA profile FFA concentration (mg/g sample)
C 12:0 0.00 0.00 0.00 0.00
C 14:0 0.01 0.05 0.04 0.01
C14:1, cis 0.00 0.00 0.00 0.00
C 16:0 0.94 0.98 3.54 1.38
C 16:1, cis 0.51 0.61 2.14 1.14
C 17:0 0.03 0.05 0.00 0.04
C 17:1, cis 0.00 0.00 0.00 0.00
C 18:0 0.47 0.49 1.63 0.60
C 18:1, trans 0.45 0.39 1.13 0.63
C 18:1, cis 20.62 22.53 17.97 19.77
C 18:2, cis 3.33 3.91 11.07 6.20
C 18:3, cis 6, 9, 12 0.25 0.30 1.82 0.25
C 18:3, cis 9,12, 15 0.85 1.29 15.08 1.11
C 20:0 1.90 2.36 5.60 3.77
C 20:1, cis 0.25 0.31 8.72 0.24
C 20:2, cis 0.00 0.00 0.00 0.00
C 22:0 0.10 0.08 0.60 0.03
C 22:1, cis 0.00 0.01 1.15 0.00
C 20:5, cis 0.04 0.04 0.34 0.03
C 24:0 0.04 0.04 0.06 0.03
C 24:1, cis 0.02 0.01 0.03 0.02
Mass reacted (g) 2459.4 2321.3 2260.7 904.2
Mass produced (g) 2272.2 2113.9 2107.8 808.7
Mass Conversion (% wt) 92 91 93 89
2.3.6 Energy balance for continuous hydrolysis reactions
(2-10) the actual energy conversion efficiency, from the calculation of electrical power measurements, and ideal energy conversion efficiency, from the calculation based on thermodynamics, were determined. These values were obtained from the reaction carried out at 250 °C and 2:1 water-to-oil ratio. After filling and heating the reactor, which gave a startup energy cost of 15.98 MJ, the reaction was conducted for 5 hours. The total mass and total water/oil feeding time were determined by the period which started at the beginning of the reaction and ended when the FFA yield reached steady state. After 5 hours, 2.431 kg of FFA was obtained from hydrolyzing 2.83 kg of canola oil. The total heating value of reactant, e.g. canola oil, within this reaction was 110.25 MJ [44] and the total thermal energy equivalent input to the process, as shown in Table 2-3, was 17.96 MJ for the actual case and 11.53 MJ for the ideal calculation. The energy content of the products, including FFA and glycerol, is 97 MJ. The energy content of FFA was determined based on the average enthalpy of all FFA components derived from canola oil, valued at 38.15 MJ/kg. The actual energy conversion efficiency obtained was 75.66%, where the ideal theoretical conversion efficiency was 79.66%. The reasons for the difference were inefficiencies of the heaters, pumping losses and heat losses.
energy conversion efficiency energy content of product
Table 2-3 Thermal dynamic analysis of continuous hydrolysis reaction based on the reaction conducted at 250
°C as well as 10 mL/min of oil and 20 mL/min of water
Energy Balance Calculation
state description Species T (°C )
P (psig) volume flow rate(mL/min) mass fraction mass flow rate (g/min) Total volume (L) Total Mass (kg) h
(kJ/kg) H (kJ)
Electricity input (KWH) Electrici ty input (kJ)
E in (kJ) ideal
Start-up costs
Reactor heat 4.35 15660
Fill reactor 0.09 324
Total 15984
1 Water from tank H2O 25 0 20 20 6.00 6.000 104.96 629.76
2 Water from pump H2O 25 800 20 6.00 6.000 110.06 660.36 0.39 1404 30.60
3 Water pre-heated H2O 250 800 20 6.00 6.000 1085.80 6514.80 2.13 7668 5885.04
4 Oil from tank Canola 25 0 10.2 9.44 3.06 2.831 0.00 0.00
5 Oil from pump Canola 25 800 9.44 3.06 2.831 16.87 47.76 0.18 648 47.76
6 Oil pre-heated Canola 250 800 9.44 3.06 2.831 517.91 1465.96 0.39 1404 1418.19
7 FFA from reactor FFA 250 800 2.89 2.431 1741.78 4234.66
8 FFA cooled FFA 50 800 2.431
9 FFA after pressure relief
FFA 25 0 2.431
10 Sweet water from reactor
250 800
H2O 250 800 0.9626 6.849 1085.80 7436.57
Glycerol 250 800 0.0374 0.266 1725.81 458.98
Total 7.115 7895.55
11 Sweet water cooled 50 800
H2O 50 800 0.9626 6.849 214.21
Glycerol 50 800 0.0374 0.266
Total
12
Sweet water after
pressure relief 25 0
H2O 25 0 0.9626 6.849 104.96
Glycerol 25 0 0.0374 0.266
Total
Reactor makeup heat 1.90 6840 4149.45
Totals 4.99 17964 11531.05
Measured Value theoretic al value start-up cost Energy of product produced
(MJ) 97.004
Energy inputs to
process
(MJ) 17.964 11.531 15.984
Energy of feedstocks(
MJ) 110.248
measured value theoretic al value start-up cost Energy conversion efficiency
2.3.7 Continuous vs Batch reactions
Figure 2-8 FFA as a function of temperature for Continuous and Batch hydrolysis reactions. Continuous
reaction was conducted at 250 °C~270 °C and batch reaction was at 220 °C~310 °C.
Table 2-4 Comparison of continuous and batch hydrolysis at different temperatures and water-to-oil ratios.
Feedstock: canola oil
Temperature (°C) Volumetric
water-to-oil ratio
Catalyst Max %
FFA
Batch reaction 1 280 3:1 N/A 91.26
Batch reaction 2 270 6:1 N/A 94.8
Batch reaction 3 280 3:1 ZnO 93.14
Batch reaction 4 310 2:1 N/A 90.60
Batch reaction 5 –Re-hydrolyze FFA with fresh water
270 3:1 N/A 92.1
Continuous reaction 260 4:1 N/A 95.46
20 30 40 50 60 70 80 90 100
200 220 240 260 280 300 320
Continuous
Batch
%
F
F
A
2.4
Conclusion
CHAPTER 3.
SWEET WATER RECOVERY IN THE CONTINUOUS
HYDROLYSIS OF TRIGLYCERIDES
Hydrolysis of triglycerides to form free fatty acids (FFA) has been used for many decades for soap manufacturing and other products. The primary intent here is to minimize the reaction temperature and reaction time. Specifically, hydrolysis is the first step of a proprietary chemical process to convert lipids to sustainable, drop-in replacements for petroleum based fuels. Although the hydrolysis reaction is already well understood, to improve the economics of the process, attention is now focused on the energy efficiency of the process, maximize the reaction rate, and improve the recovery of the glycerol by-product. A laboratory-scale reactor system has been designed and built with this focus in mind.
3.1
Introduction
The important industrial process of hydrolyzing bio fats and oils to produce FFA has been in commercial operation for many years. World production of fatty acids in 1986 was estimated at 2×10⁶ ton and increased to about 902×106 ton in 1994 [13]. Due to the increasing demand for petroleum fuels and environmental concerns, fats and oils from renewable sources are currently used to produce biofuels such as biodiesel (FAME) from transesterification and “drop in” replacements via the proprietary Red Wolf ProcessTM
[47], which converts triglycerides to FFA as the first step. There are many theoretical [34, 17] and experimental [41, 22] investigations showing that FFA can be produced from oils or fats through hydrolysis of triglycerides with subcritical water [37] or supercritical CO2 [17]. The
process consists of a series of steps to obtain FFA and glycerol:
C3H5(COOR)3 H2O C3H5(COOR)2(OH) RCOOH (3-1)
C3H5(COOR)3 H2O C3H5(COOR)2(OH) RCOOH (3-2)
C3H5(COOR)3 H2O C3H5(COOR)2(OH) RCOOH (3-3)
C3H5(COOR)3 H2O C3H5(COOR)2(OH) RCOOH (3-4)
Where triglyceride (C3H5(COOR)3) is converted to diglyceride (C3H5(COOR)2(OH)), then to monoglyceride (C3H5(COOR)(OH)2 ), and then to FFA ( RCOOH) and glycerol (
3 5
3H (OH)
product of the hydrolysis reaction, is widely used in soaps, cosmetics, foods and for many other industrial uses [48]. It has also been considered as the alternative source for petroleum-based fuel [24]. It may also be used as a fuel to provide combined heat and power in the fuel conversion process due to its moderate heating value, approximately 16MJ of heat per kilogram [36]. The main purpose for optimizing the hydrolysis reaction is to obtain high purity FFAs for downstream conversion to fuel in the Red Wolf ProcessTM while refining the glycerol as an energy source or co-product.
The continuous hydrolysis reaction requires relatively high temperatures. High pressure is maintained to keep the water, and hence the entire reaction, in the liquid phase. Thermal hydrolysis of fats in a continuous process was first reported by Ittner [27]. His counter-flow process was carried out at 200 °C and gave satisfactory yields. Temperatures from 185 °C to 315 °C and pressures from 10 bar to 110 bar were investigated in a continuous countercurrent flow reactor [28]. One percent of zinc oxide was used in the process described by Mills as a catalyst. A high conversion and a rapid rate of splitting were obtained. These efforts led to the development of the Colgate-Emery process, which is still widely used today [31]. In the C-E process, fat and water react in a counter-current flow column at 260 °C and 50 bar. This process can be operated with high throughput and with high yields without the use of a catalyst, and the quality of the FFA product is exceptionally good, especially from high-grade fats.
high, about 260 °C. Low reaction temperature, especially below 200 °C, results in an even slower reaction and low purity of FFA [17] due to the relatively low reaction rate, low diffusion rate and low oil solubility. In addition, the reverse process, in which FFA reverts back to diglcyeride and monoglyceride, is more active at low temperatures. In the interest of industrial applications, two significant goals for the continuous hydrolysis process are minimizing the reaction time and reaction temperature.
Steam splitting has been used to remove the phosphorus groups contained in crude tallow [49]. Heat and agitation provided by the admission of steam lead to faster hydrolysis reactions. In a batch reactor, for example, 90% of the splitting was achieved in 180 min at 260 °C [49]. Also, phospholipids mixed with the triglyceride were hydrolyzed and the phosphorus compound was removed from the glycerol backbone after steam splitting. Research showed that co-feeding steam in the hydrolysis reaction results in a decrease in residence time of the oil in the reactor and facilitates the process [50].
hydrolysis reaction [18]. However, high sweet water output and low glycerol concentration in the sweet water increases the difficulties in refining glycerol, i.e., more time and energy are required because more water needs to be boiled off to concentrated glycerol.
In this paper, a lab-scale, counter-flow, continuous hydrolysis reaction has been carried out to produce FFA from canola oil with high conversion. The steam evaporated from the sweet water was recovered, and injected back to the reactor continuously, stimulating the hydrolysis reaction. The steam, with relatively high energy content, can provide sufficient heat to sustain the hydrolysis reaction. The process not only produces high quality FFA due to the improved emulsion of the oil and water at low reaction temperature and low water-to-oil ratio, but also produces highly purified glycerol from the glycerol separation stage. In addition, for the continuous hydrolysis reaction, due to the steam recovery, the energy requirement for reactor make-up heat was less with co-feeding steam than without steam injecting.
3.2
Experimental Methods
3.2.1 Apparatus
Temperature was monitored by K-type thermocouples mounted on the surface of the reactor. These thermocouples were connected to two Delta DTB 4824 Temperature Controllers which controlled the induction units in on-off mode. The maximum power of the ovens is 1.8 kW and they are capable of bringing the upper and lower parts of the reactor to the desired temperature in about 120 minutes.
In this system, proper ratios of water and oil were pumped continuously and simultaneously into the hydrolysis vessel via Neptune proportional pumps (Model: 515-S-N1, Neptune Chemical Pump Company, Inc., Buffalo, NY) and Waters HPLC pumps (Model: 510, Waters Corporation, Milford, MA). Water and oil were pumped into two separate columns with 154 mL of inner volume. According to the authors‟ previous experiments [52], preheating water and oil increases FFA yield by 43% compared with no pre-heating. In this case, therefore, water and oil inflow were preheated to between 190 and 220 °C and 140 °C, respectively. The pre-heating was accomplished by the induction coils similar to those described above. When the reactor reached the desired temperature, water was introduced about 25 cm below the top of the reactor and oil was introduced about 120 cm below the top of the reactor. Due to their different densities, water and oil flow in opposite directions, which also enhances mixing.
3.2.2 Co-feeding steam
coil in a similar manner to the reactor. The temperature was set to 300 °C, slightly above the saturation temperature of water at the reaction pressure [53]. In the glycerol concentrator, the water portion of the sweet water was converted to superheated steam and then injected back to the reactor through the steam line. A thermocouple, inserted downstream of the steam line right before the reactor, was used to ensure that the water was in vapor form. The steam line extended 25 cm below the top of the reactor. Co-feeding steam provided an energy input for the hydrolysis. The heat source for the hydrolysis reactor was switched from the reactor‟s induction heaters to the steam once the reactor reached the desired reaction temperature. Simultaneously, a portion of the post-reaction sweet water was continuously feds into the glycerol concentrator at flow rates sufficient to maintain steam. By repeating this semi-continuous process, the glycerol concentration of the sweet water in the hydrolysis reactor was kept low by continuously removing glycerol from the system. As expected, low glycerol concentration resulted in high percent yield of FFA.
3.2.3 Sample analysis
(15 m long, 0.32 mm in diameter, 0.1 µm film thickness) and coupled to an FID. Sixty mg of product samples were dissolved in 4 mL HPLC grade hexane and a sample of 1 µL was injected into the GC and the carrier gas (hydrogen) flow rate was 4 mL/min. The injector temperature was 380 °C. The initial oven temperature was 50 °C and was held for 1 minute, and then increased to 180 °C at 15 °C/min, followed by an increase of 7 °C/min to 230° C and finally an increase of 30 °C/min to 380 °C and held for 5 minutes. Quantitative calculations were performed by the area method and supplemented by using the external standard method.
FFA FFA FFA S.W. Glycerol Concentrator Proportional pump Water Tank Oil Tank P Oil Oil Water S.W. FFA Water P HPLC pump Inline filter Pressure Relief Valve Oil Preheater S.W. Proportional pump Water Preheater Concentrated Glycerol Glycerol Steam Tube-in-tube heat exchanger S.W. Thermocouple T Temperature Readout Metering Valve FFA S.W. Oil& Water interface
S.W. Oil FFAs layer Water layer Oil layer Water Hydrolysis Reactor 1 2 3 4 5 6 8 9 7 10 11 13 14 15 16 17 12
Figure 3-1 Lab-scale continuous hydrolysis system (numbers indicate energy input/output states in Table
3.3
Results and discussion
3.3.1 Glycerol Concentration in Sweet water during Hydrolysis Reactions
the glycerol concentration is expected to continue to increase with longer processing times. In the present experimental set-up, the power of the concentrator heater was a limiting factor.
0 0.5 1 1.5 2 2.5 3 3.5
0 50 100 150 200 250 300 350
W:O = 2:1 W:O=3:1
W:O=4:1
%
g
lyc
e
ro
l
in
t
h
e
s
w
e
e
t
w
a
te
r
time (min)
Figure 3-2 Glycerol concentration in sweet water for different water-to-oil ratios at a constant
temperature of 250 °C. The feed rate of oil was 10 mL/min and of water was varied between 20 and 40
0 20 40 60 80 100 0 1 2 3 4 5 6
0 50 100 150 200 250 300 350
% FFA % glycerol in the sweet water
% concentrated glycerol
% F F A % gl yc e rol in t he s w ee t w a ter time (min)
Figure 3-3 FFA and glycerol (before and after refining) concentration as a function of time at a reaction
temperature of 250 °C, 20 mL/min of water feed rate and 10 mL/min oil feed rate
3.3.2 Glycerol refining process
Based on an energy balance calculation, to make superheated steam from sweet water in the glycerol concentrator, we need to consider:
loss gly water vapor
W H H H H
(3-5)
On average, the glycerol concentration in the sweet water coming out from the hydrolysis reaction was 2%. The energy provided by the induction heating system and the heat losses from the glycerol concentrator, measured by the electrical consumption meters, were 6708.6
0.1 kJ and 1296.4 0.1 kJ, respectively. The heat losses were measured using a pretest, which measured the energy consumption of the glycerol concentrator when the temperature reached steady-state without feeding in sweet water. Also,
(1) heating glycerol from 25 °C to 300 °C:
, ,300 , ,25
2% ( )
gly v gly C boiler v gly C initial
H m C T C T
(3-6) where m is the total mass of sweet water pumped into the glycerol concentrator for the whole reaction time. The heat capacities Cv of glycerol at 25 °C and 300 °C are 2.4 kJ/kg K
and 3.8 kJ/kg K [54], respectively. The boiler temperature Tboiler=573.15 K and the initial temperature Tinitial=298.15 K.
(2) heating water from 25 °C to 300 °C:
300 25
98% ( )
water C C
H m u u
(3-7) where the internal energy of water at 300 °C and 25 °C are 2669.7 kJ/kg and 104.37 kJ/kg, respectively[53].
(3) enthalpy to evaporate the water,
,
98%
vapor va water
H m E
where the enthalpy of evaporation for water is 1390 KJ/kg at 50 bar [54].
Using experimental values for W and Hloss, the total amount of sweet water pumped into the
0 1 2 3 4 5 6 7
0 50 100 150 200 250 300 350
3.5 mL/min
2.8 mL/min
2.2 mL/min
4.7 mL/min
5.5 mL/min
G
ly
c
e
ro
l
Co
n
c
e
n
tra
ti
o
n
(
%
)
time (min)
Figure 3-4 Refined glycerol concentration from the glycerol concentrator with time for different sweet
water feed rates at a refining temperature of 300 °C and pressure of 55 bars (the error bars are ±1
standard deviation based on two to three data sets)
3.4
Free fatty acid conversion from continuous hydrolysis reaction with
steam
3.4.1 Effect of co-feeding steam and pre-heating water/oil
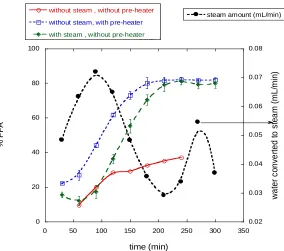
temperature before entering the reactor. Pre-heating the reactants helps the reaction proceed and increases its FFA yield by 43% compared with no pre-heating [52]. As Figure 3-5 shows, at the 250 °C and 2:1 water-to-oil ratio, injecting steam from the glycerol concentrator increases its FFA yield by 41% compared with no steam, which agrees closely to the results of applying water and oil pre-heaters. It is thought that the admission of steam provides better mixing of water and triglycerides and helps overcome the heat exchange effects from water and oil inflows. Moreover, from a thermal efficiency consideration, for steam generation, 5645 kJ was consumed from the glycerol concentrator, which was lower than the energy consumption of water and oil pre-heaters (8678 kJ). Therefore, co-feeding steam can be an attractive alternative to preheating the reactants.
0 20 40 60 80 100 0.02 0.03 0.04 0.05 0.06 0.07 0.08
0 50 100 150 200 250 300 350
Data 4
without steam , without pre-heater without steam, with pre-heater
with steam , without pre-heater
steam amount (mL/min)
% F F A wa te r c o n ve rt e d t o s te a m (m L /m in ) time (min)
Figure 3-5 Effect of co-feeding steam and preheating water and oil on FFA conversion; reaction was
3.4.2 Effect of co-feeding steam and reaction temperatures
0 20 40 60 80 100 0 0.02 0.04 0.06 0.08 0.1 0.12 0.14
0 50 100 150 200 250 300 350
200°C with steam
200°C without steam
250°C with steam
250°C without steam
260°C with steam 260°C without steam
steam amount (mL/min)
% F F A w at er co nve rt ed to s te am ( m L /m in ) time (min)
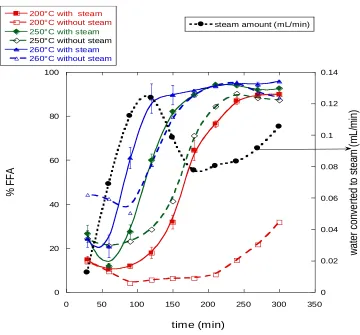
Figure 3-6 Effect of co-feeding steam and reaction temperature to FFA conversion; reaction was carried
out at 200~260 °C, and the feed rate of oil was 10 mL/min and of water was 40 mL/min
3.4.3 Effects of co-feeding steam at various water-to-oil feed rate ratios
the 2:1 water-to-oil ratio, 90% FFA conversion was obtained in 240 minutes, compared with 210 minutes for a ratio of 3:1 and 180 minutes for 4:1. However, recall that high water-to-oil ratios result in low glycerol content in sweet water after reaching equilibrium (Figure 3-2) thus requiring more energy and time to concentrate the glycerol.
0 20 40 60 80 100 0.02 0.03 0.04 0.05 0.06 0.07 0.08
0 50 100 150 200 250 300 350
water-to-oil ratio=2:1 with steam without steam steam amount % F F A y ie ld w a te r c o n v e rt e d t o s te a m (m L /m in ) time (min)
Figure 3-7 Effect on FFA conversion of co-feeding steam at a 2:1 water-to-oil ratio; reactor was
0 20 40 60 80 100 0 0.02 0.04 0.06 0.08 0.1 0.12
0 50 100 150 200 250 300 350
water-to-oil ratio = 3:1
with steam without steam
steam applied (mL/min)
% F F A y ie ld w a te r c o n v e rt e d t o s te a m ( m L /m in ) time (min)
Figure 3-8 Effect on FFA conversion of co-feeding steam at a 2:1 water-to-oil ratio; reactor was
maintained at 250 °C, and the feed rate of oil was 10 mL/min and of water was 30 mL/min
0 20 40 60 80 100 0 0.02 0.04 0.06 0.08 0.1 0.12 0.14
0 50 100 150 200 250 300 350
water-to-oil ratio = 4:1 with steam
without steam
steam applied (mL/min)
% F F A y ie ld w a te r c o n v e rt e d t o s te a m (m L /m in ) time (min)
3.5
Energy Balance Calculation
A standard measure of a fuel production process is the energy conversion efficiency, defined as
energy conversion efficiency energy content of product
energy content of feedstock input energy (3-9)
The energy balance calculation shown in Table 3-1 computes the actual energy conversion efficiency, based on electrical power measurements, as well as the ideal conversion efficiency, based on thermodynamics. Both of these calculations merely describe the current laboratory configuration. Higher efficiencies can be easily achieved by making use of the enthalpy of the products of the reaction. For example, the sweet water from the reactor could be fed directly to the glycerol concentrator, rather than allowing it to cool and depressurize first. Similarly, the enthalpy of the FFA could be used to help pre-heat the triglyceride feedstock.
product was calculated by conservation of mass. The resulting concentration of glycerol in the sweet water shows good agreement with measurement.
The actual energy conversion efficiency was found to be 78.6% vs. the ideal efficiency of 84.2%. The difference between these values is caused by heat losses, pumping losses, and inefficiencies of the heaters.
From this analysis, it is possible to predict the effect of the sweet water feed rate to the concentrator on the overall energy conversion efficiency of the process. The results of this calculation are shown in Figure 3-10. In the calculation, the total amount of water fed to the reactor is held constant. As the sweet water feed rate increases, the feed rate of the make-up water from the tank decreases. The energy to concentrate the glycerol increases while the energy to preheat the water from the tank decreases.
required by the reactor, the efficiency drops off more rapidly, again assuming that the excess enthalpy is discarded.
50 60 70 80 90 100
0 5 10 15 20 25
Prediction of energy conversion efficiency for measured values Theoretical energy conversion efficiency
Measured energy conversion efficiency
En
e
rg
y
c
o
n
v
e
rs
io
n
e
ff
ic
ie
n
c
y
(%
)
Sweet water feeding rate (mL/min)
Figure 3-10 Energy conversion efficiency as a function of sweet water flow rate into the glycerol