Optimization of direct conversion of methane to liquid fuels
over Cu loaded W/ZSM-5 catalyst
Nor Aishah Saidina Amin
a,*, Didi Dwi Anggoro
a,b aDepartment of Chemical Engineering, Faculty of Chemical and Natural Resources Engineering, Universiti Teknologi Malaysia, 81310 UTM Skudai, Johor, Malaysia
bDepartment of Chemical Engineering, University of Diponegoro, 23589 Semarang, Indonesia
Received 3 April 2003; accepted 16 September 2003; available online 27 October 2003
Abstract
The optimization of methane conversion to liquid fuels over copper loaded W/ZSM-5 catalyst was studied by utilizing experimental design from ‘Statsoft Statistica’ version 6.0 software. Response surface methodology was employed to determine the optimum methane conversion and C5þselectivity. Numerical results indicated the optimum methane conversion of 29.4% with the corresponding C5þselectivity of 57.2% were achieved at 12.3 vol% of O2, 203.9 ml/min of total feed flow rate, and %W doped of 3.2 wt%. The optimum C5
þ
selectivity of 70.2% was attained at 7.6 vol% of O2, 208.9 ml/min of total feed flow rate, and 3.2 wt% of W content with the corresponding methane conversion of 26.7%. By means of variance analysis and additional experiments, the adequacy of this model is confirmed.
q2004 Elsevier Ltd. All rights reserved.
Keywords:Optimization; Direct conversion; Methane; Liquid fuels
1. Introduction
Methane, the principal component of natural gas, can be converted to produce liquid fuels and chemicals of commercial importance. However, the commercialization of the direct conversion process remains a challenging goal as the engineering and chemistry involved are quite complex. In general, there are two routes for converting methane to liquid fuels: indirectly or/and directly. The indirect route is a two-step process whereby natural gas is first converted into
synthesis gas (a mixture of H2 and CO), and then into
gasoline range. The direct route is a one step process in which the natural gas is reacted with oxygen (or another oxidizing species) to give the desired product directly.
Many researchers studied the applicability of HZSM-5 and modified ZSM-5 zeolite to the direct conversion of methane to liquid hydrocarbons[1– 9], but the conversion and selectivity remained low making the process not lucrative economically. The direct partial oxidation of methane to liquid hydro-carbons was reported by Han et al.[1,2]. They found that liquid hydrocarbons could be produced from the reaction
between CH4and O2over metal loaded ZSM-5. However,
low conversion of methane was obtained due to a high formation of COx as side products. They concluded liquid
hydrocarbons could be produced from the reaction between CH4 and O2 if CH4 or C2H6 dehydrogenation and olefin oxidation functions of the metals in the metal – ZSM-5 catalysts are in balance. Different reactor configuration could also be used to achieve a better catalytic result as demonstrated by Pak et al.[9]. In their study, a high yield of liquid hydrocarbons (80%) was achieved using a two-reactor system with recycle, one for oxidative coupling of methane and the other for oligomerization reactor.
Previous studies on the conversion of methane to higher hydrocarbons generally accepted that CH4in the absence of O2reacted to form ethylene as an intermediate product on metal active sites by dehydrogenation, then followed by the formation of liquid hydrocarbons by oligomerization over acid sites of the catalyst. Recently, it has been shown that Mo supported on HZSM-5 are active and selective for conversion of methane to aromatics [10 – 17]. Wang et al.
[16] studied the conversion of methane to aromatics over
Mo/HZSM-5 based catalysts under non-oxidative condition and found that Mo species is transformed to Mo carbide species which is an active phase for methane transformation to higher hydrocarbons. Liu et al.[17]reported that methane
0016-2361/$ - see front matterq2004 Elsevier Ltd. All rights reserved. doi:10.1016/j.fuel.2003.09.013
www.fuelfirst.com
is dissociated on Mo active sites (Mo2C) to form CHx, which
oligomerized on ZSM-5 support having proper acidity to produce aromatic hydrocarbons. Cu loaded ZSM-5 catalyst prepared by acidic ion exchange method showed a promising performance in the conversion of methane to liquid hydrocarbons where the methane conversion and the composition of gasoline range (C5 – 10) in liquid hydro-carbons were 15.6 and 80.2%, respectively[18]. However, the infrared study of the catalyst indicated that it was not
resistant to high temperature. Li et al. [19] found that
introduction of Cu by ion exchanged into Mo/HZSM-5 catalysts could improve the stability of the catalysts to some extent at reaction temperature of 7508C.
Results from two recent studies [20,21] found the
W/HZSM-5 catalyst to be suitable for methane reaction in a non-oxidative environment reaction at temperatures
as high as 8008C over which a much higher methane
conversion (18 – 23%) and yields of aromatic hydrocarbon (48 – 56%), without the loss of W component, were
obtained. The result from the TPR-H2 analysis revealed
the temperature needed for the reduction activation of the
W/HZSM-5 catalyst was moderate (600 – 7208C) and the
catalyst was stable even at 8008C.
In our previous study on the direct conversion of methane to liquid fuels[22], the FT-IR and TPR-H2analysis revealed the W loaded Cu/ZSM-5 catalyst was thermally stable at the reaction temperature. 3.0 wt% of W in 3.0 wt% of Cu/ZSM-5 catalyst demonstrated a longer lifetime than 3.0 wt% of W/ZSM-5; 12 and 8 h, respectively. The 3.0W/3.0Cu/ZSM-5 showed potential of catalysing the direct conversion of
CH4 to liquid fuels (C5
þ
), over which the methane conversion and C5
þ
selectivity were reported to be 21 and 34%, respectively. With the encouraging performance plus its thermal stability, the combination of Cu and W species loaded onto the ZSM-5 catalyst has potential to be used in the methane oxidation reaction to produce liquid fuels.
Response surface methodology (RSM) is a method to determine the optimum condition of a process. RSM has similarity with regression analysis. In regression analysis, empirical mathematical model are derived from the experiment data. RSM is a set of technique designed to find the optimum value of the response and the influencing factors. RSM technique has been successfully applied in the field of quality experimental work[23 – 26].
A new combination of tungsten first and then copper loaded onto the ZSM-5 catalyst was developed and tested for the direct conversion of methane to liquid fuels. The catalyst developed was to elucidate the role of tungsten in enhancing the thermal stability of the ZSM-5 catalyst. Previous works found that some aspects such as percent of metal loading, percent volume of O2in feed and feed flow rate affected the catalytic performance of methane conver-sion to higher hydrocarbons. In this paper, the optimization of those variables for direct conversion of methane to gasoline over 3% Cu loaded W/HZSM-5 catalyst was
studied to obtain maximum methane conversion and selectivity to C5
þ
products by utilizing experimental design.
2. Experimental
2.1. Preparation of catalysts
ZSM-5 zeolite with a SiO2/Al2O3mole ratio of 30 was supplied by Zeolyst International Co. Ltd, The Netherlands. The surface area of the zeolite is 400 m2/g. The 3.0 wt% of Cu loaded with variable percentage of W doped into the W/HZSM-5 catalyst was prepared by first impregnating a certain amount of the HZSM-5 zeolite carrier with a calculated amount of tungsten hydrate in aqueous solutions. The tungsten hydrate solution was prepared by dissolving a certain amount of ammonium tungsten hydrate ((NH4)6·W12·O40·H2O) in deionized water. A small amount of H2SO4was added to regulate the pH value of the solution to 2 – 3 followed by drying at 1208C for 2 h and calcining at
4008C for 4 h. The sample was subsequently impregnated
with a calculated amount of H2SO4acidified copper nitrate aqueous solution (pH 2 – 3). Finally, the sample was dried at 1208C for 2 h and calcined at 5008C in air for 5 h. The sample is designated as 3.0Cu/W/ZSM-5 zeolite catalyst.
2.2. Apparatus
The direct conversion of methane reaction over the catalyst was carried out in a continuous flow quartz reactor (ID¼9 mm). The catalysts were pretreated in situ in a flow of nitrogen at 5508C for an hour. The feed was a mixture of pure methane and oxygen. The reaction was performed at
7538C, atmospheric pressure and the amount of catalyst
used was 500 mg. The reactor effluent gases were analyzed by an on-line Hewlett Packard Agilent 2000 gas chromato-graph using Porapak-N columns.
2.3. Experimental design
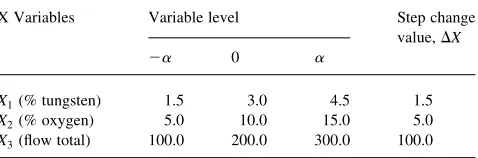
The low, middle and high levels of all the independent variables were wt% of W doped into the 3.0Cu/W/ZSM-5, X1; vol% of O2, X2; and flow rate of feed gases, X3. Accordingly, 1.5, 3.0 and 4.5 wt% were chosen for variable
X1; 5, 10 and 15 vol% O2 for X2 and 100, 200 and
300 ml/min for X3 (Table 1). Allowances for extreme
Table 1
Experimental range and levels of independent variables
X Variables Variable level Step change value,DX
2a 0 a
X1(% tungsten) 1.5 3.0 4.5 1.5
X2(% oxygen) 5.0 10.0 15.0 5.0
measures are designated as 2a and þa in the central composite design.
The optimization method based on RSM involved three major steps: design of experiment using statistical approach, coefficient estimation based on mathematical model and response prediction and finally model adequacy check. The equation model is tested with analysis of variance (ANOVA) with 99% degree of confidence. The RSM output such as contour and 3D graphic surface plots provide the optimum and most influential variable for methane
conversion and C5
þ
selectivity. According to central composite design, the total number of experiment
combi-nations is 2kþ2kþno; where k is the number of
independent variables andnois the number of experiments repeated at the center point[27,28]. In this case,no¼2:
The variablesXi were coded as xi according to Eq. (1). The basis to form a polynomial equation is given in Eq. (2)
xi¼ ðX12XoÞ=DX; i¼1;2;3…k ð1Þ
Yu¼boþ Xk
i¼1 biXuiþ
Xk
i¼1
biiX2uiþ
X Xk
i,j
bijXuiXuj ð2Þ
with Yu; predicted response u; bo; offset term; bi; linear term;bii;squared term;bij;interaction term;xi; dimension-less value of an independent variable;Xi;real value of an
independent variable; Xo; real value of an independent
variable at center point;DX;step change andu¼1;2;…;n: In this work, the number of independent variables are three and therefore,k¼3:Eq. (2) becomes:
Yu¼boþb1X1þb2X2þb3X3þb12X1X2þb13X1X3
þb23X2X3þb11X21þb22X22þb33X32 ð3Þ
The actual experimental design for optimization is shown in
Table 2. From Eq. (3), it was found that a total of 16 runs
were needed to optimize the methane conversion and C5
þ
selectivity. The result for the design of experiment was obtained by using the Design Expert Statsoft software, ‘Statistica’ version 6.0, 2001.
3. Results and discussion
3.1. Optimization of CH4conversion and C5 þ
selectivity by regression analysis
The result for methane conversion according to the experimental design is given inTable 2. The application of RSM yielded the following regression equation, which is an empirical relationship between methane conversion and the test variable in coded unit as given in Eq. (4)
Y ¼228:5459þ9:5251x1þ4:4146x2þ0:1549x3
20:0500x1x220:0042x1x320:0003x2x3
21:2751x2120:1713x 2
220:0003x 2
3 ð4Þ
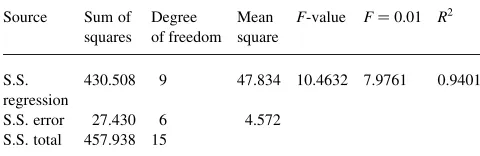
The fitting of the model can be checked by several criteria. The ANOVA tabulated inTable 3pertains to the response of the methane conversion. The determination of coefficient R2 ¼0:94 indicates that only 6% of the total variation did not fit the model. The adequacy of the fitted model was tested by Eq. (4) using static Fisher (F). The value ofFis compared to the table valueFðp21;N2p;aÞ;which is the upper
100 a percent point of the F distribution with p21 and
N2p degrees of freedom, respectively. Since the value
F¼10:4632 exceeded the table valueFð9;6;0:01Þ¼7:9761; the Fisher test also demonstrated the regressions model fitted fairly well with the observed values. Each of the observed values,Yois compared with the predicted value,Yp
calculated from the model, as depicted inFig. 1.
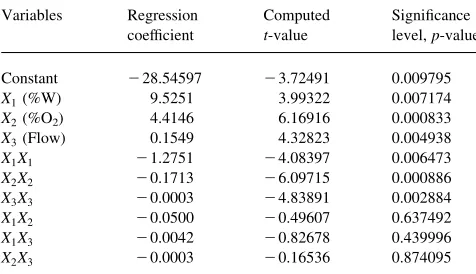
The significance of each coefficient was determined
using the Student t-test and p-value in Table 4. The
corresponding variables will be more significant if the absolute t-value becomes larger and the p-value becomes smaller. It can be seen that the variable with the largest effect was the linear term of vol% of O2, (X2), followed by the quadratic of vol% of O2,ðX2X2Þ;and the quadratic of
total flow of feed gases, ðX3X3Þ: The factor t-test value Table 2
2321Fractional factorial central composite design three variable with the observed responses and predicted values for CH4conversion
Run X1 X2 X3 Yo Yp ðYo2YpÞ
1 1.50 5.00 100.00 12.0 11.62506 0.37494 2 1.50 5.00 300.00 14.0 13.90390 0.09610 3 1.50 15.00 100.00 21.0 20.50652 0.49348 4 1.50 15.00 300.00 25.0 22.28535 2.71465 5 4.50 5.00 100.00 13.0 15.24927 22.24927 6 4.50 5.00 300.00 15.0 15.02810 20.02810 7 4.50 15.00 100.00 23.0 22.63072 0.36928 8 4.50 15.00 300.00 22.0 21.90955 0.09045 9 0.48 10.00 200.00 17.0 18.96329 21.96329 10 5.52 10.00 200.00 23.0 21.69486 1.30514 11 3.00 1.59 200.00 11.0 9.70159 1.29841 12 3.00 18.41 200.00 21.0 22.95656 21.95656 13 3.00 10.00 31.82 19.0 18.17416 0.82584 14 3.00 10.00 368.18 18.0 19.48399 21.48399 15 3.00 10.00 200.00 28.0 28.44354 20.44354 16 3.00 10.00 200.00 29.0 28.44354 0.55646
X1, wt% of tungsten; X2, % oxygen; X3, flow total (ml/min),Yoobserved CH4conversion;Yp;predicted CH4conversion.
Table 3
ANOVA for the methane conversion
Source Sum of squares
Degree of freedom
Mean square
F-value F¼0.01 R2
S.S. regression
430.508 9 47.834 10.4632 7.9761 0.9401
(6.1692) and p-value ðp¼0:000833Þ corresponds to X2, while the t-test values for X2X2 and X3X3 are smaller at
6.0971 and 4.8389, respectively, but the p values are still significant atp¼0:00089 and 0.00288, respectively.
From Fig. 2 (Pareto chart), the most significant parameters are clearly the vol% of O2(X2) and its quadratic effectðX2X2Þ:The quadratic of total flow of feed gases and
quadratic of wt% of W are significant but less important. The significance of wt% of W,ðX1Þand total flow of feed
gases,ðX3Þas well as the interactions between wt% of
W-total flow,ðX1X3Þand wt% of W – vol% of O2,ðX1X2Þare
negligible. The interaction between the vol% of O2and the total flow of feed gases,ðX2X3Þdid not seem to have affected
the methane conversion.
The results for gasoline range (C5
þ
) selectivity according
to the experimental design are given in Table 5. The
application of RSM yielded the following regression
equation, which is an empirical relationship between C5
þ
selectivity and the test variable in coded unit given in Eq. (5)
Y ¼267:0195þ32:0514x1þ8:1699x2þ0:5304x3
þ0:0833x1x220:0008x1x320:0012x2x3
25:1206x2120:5386x 2
220:0012x 2
3 ð5Þ
The fitting of the model can be checked by several criteria. The ANOVA tabulated inTable 6pertains to the response of the C5
þ
selectivity. The determination of coefficient R2¼
0:94 indicates that only 6% of the total variation is not explained by the model. The fitted model was tested with Eq. (5) using staticFfor model adequacy check. The value ofFis compared to the table valueFðp21;N2p;aÞ;which is the upper 100 apercent point of theFdistribution withp21 andN2pdegrees of freedom, respectively. Since the value F¼11:5647 exceeded the table valueFð9;6;0:01Þ¼7:9761; the FisherFtest demonstrated that the experimental results fitted the model well. Each of the observed values Yo is
compared with predicted value Yp calculated from the
model, as shown inFig. 3.
The significance of each coefficient was determined using the Student t-test and p-value in Table 7. It can be seen that the variable with the largest effect was the
quadratic of vol% of O2, ðX2X2Þ with the absolute
Table 5
2321 Fractional factorial central composite design five variable with the observed responses and predicted values of C5
þ
selectivity
Run X1 X2 X3 Yo Yp ðYo2YpÞ
1 1.50 5.00 100.00 36.0 37.43430 21.43430 2 1.50 5.00 300.00 49.0 42.78187 6.21813 3 1.50 15.00 100.00 15.0 11.40692 3.59308 4 1.50 15.00 300.00 19.0 14.25449 4.74551 5 4.50 5.00 100.00 43.0 42.41859 0.58141 6 4.50 5.00 300.00 49.0 47.26616 1.73384 7 4.50 15.00 100.00 18.0 18.89121 20.89121 8 4.50 15.00 300.00 28.0 21.23878 6.76122 9 0.48 10.00 200.00 24.0 29.23453 25.23453 10 5.52 10.00 200.00 37.0 39.29887 22.29887 11 3.00 1.59 200.00 49.0 50.65303 21.65303 12 3.00 18.41 200.00 1.0 6.88037 25.88037 13 3.00 10.00 31.82 30.0 28.53130 1.46870 14 3.00 10.00 368.18 26.0 35.00211 29.00211 15 3.00 10.00 200.00 67.0 66.85374 0.14626 16 3.00 10.00 200.00 68.0 66.85374 1.14626
X1; wt% of tungsten; X2; % oxygen; X3; flow total (ml/min); Yo;observed C5
þ
selectivity;Yp;predicted C5 þ
selectivity. Fig. 1. Comparison between predicted and observed methane conversion.
Table 4
Significance of regression coefficient for methane conversion
Variables Regression coefficient
Computed t-value
Significance level,p-value
Constant 228.54597 23.72491 0.009795
X1(%W) 9.5251 3.99322 0.007174
X2(%O2) 4.4146 6.16916 0.000833
X3(Flow) 0.1549 4.32823 0.004938
X1X1 21.2751 24.08397 0.006473
X2X2 20.1713 26.09715 0.000886 X3X3 20.0003 24.83891 0.002884 X1X2 20.0500 20.49607 0.637492 X1X3 20.0042 20.82678 0.439996 X2X3 20.0003 20.16536 0.874095
t-value¼5.9940 and a significant p-value of 0.0009. This is followed by the quadratic of total flow of feed gases, ðX3X3Þ and the quadratic of wt% of W, ðX1X1Þ:
The quadratic of total flow of feed gases and quadratic of
wt% of W have smaller t values, 5.5219 and 5.1285,
respectively, and the p values of 0.001484 and
0.0002160, respectively, seemed to be significant. From Fig. 4 (Pareto chart), the most significant parameters are clearly the vol% of O2,ðX2Þand its quadratic
effect, ðX2X2Þ: The quadratic of total flow of feed gases, ðX3X3Þ and quadratic of wt% of W,ðX1X1Þare significant
but less important. The significance of wt% of WðX1Þand
total flow of feed gases ðX3Þ as well as the interactions
between vol% of O2and total flow of feed gases,ðX2X3Þand
wt% of W – vol% of O2, ðX1X2Þ appeared low. The
interactions wt% of W – total flow, ðX1X3Þ can be safely
ignored for this study.
Fig. 3. Comparison between predicted and observed C5 þ
selectivity. Table 6
ANOVA for the C5 þ
selectivity
Source Sum of squares
Degree of free-dom
Mean square
F-value F¼ 0.01
R2
S.S. regression
4866.406 9 540.712 11.56472 7.9761 0.945496
S.S. error 280.532 6 46.755 S.S. total 5146.938 15
Table 7
Significance of regression coefficient
Variables Regression coefficient
Computed t-value
Significance level,p-value
Constant 267.0195 22.73460 0.033978
X1(%W) 32.0514 4.20165 0.005675
X2(%O2) 8.1699 3.57000 0.011784
X3(Flow) 0.5304 4.63575 0.003556 X1X1 25.1206 25.12846 0.002160 X2X2 20.5386 25.99403 0.000970 X3X3 20.0012 25.52190 0.001484
X1X2 0.0833 0.25853 0.804639
X1X3 20.0008 20.05171 0.960442
X2X3 20.0012 20.25853 0.804639
Fig. 4. Pareto chart of standardized effects of C5 þ
selectivity.
Fig. 6. 3D graphic surface optimization of CH4conversion versus wt% of
W and vol% of O2.
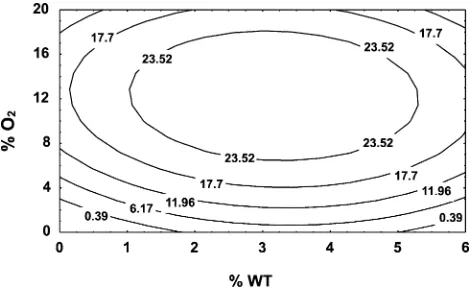
Fig. 5. Contour surface plot of CH4conversion as a function of vol% of O2
3.2. Optimisation of CH4conversion and C5 þ
selectivity by analysing the response surface contour plots
The CH4 conversion and C5
þ
selectivity can also be predicted from the respective contour plots. Each contour curve represents an infinite number of two test variables
and others are maintained at their respective zero level. The maximum predicted conversion is indicated by the surface confined in the smallest ellipse in the contour diagram [29,30].
It is evident from the plot that CH4conversion reached its maximum at a combination of coded level 8 – 16 vol% of O2 and 2.5 – 4.0 wt% of W doped. The model predicted a
maximum CH4 conversion of 25.6% within this range
(Figs. 5 and 6). Similar operating parameters between 4 and
12 vol% of O2 and 2.5 – 4.0 wt% of W will produce C5
þ
selectivity above 57.4% (Figs. 7 and 8).
Figs. 9 and 10depict the relationship between total flow of feed gases and wt% of W doped. Methane conversion above 25.7% could be obtained when W doped is 2.5 – 4.0 wt% of W and total flow is 150 – 250 ml/min. The same factors will lead to C5
þ
selectivity above 57.2% at 2.5 – 4.0 wt% of W and 150 – 250 ml/min (Figs. 11 and 12). The results from RSM using Statistica software are
tabulated in Table 8. The optimum point for methane
conversion is 29.4% when wt% of W doped¼3.2%, vol% of
O2¼12.3%, and total flow of feed gases¼203.9 ml/min.
Fig. 7. Contour surface plot of C5 þ
selectivity as a function of vol% of O2
and wt% of W.
Fig. 8. 3D graphic surface optimization of C5 þ
selectivity versus wt% of W and vol% of O2.
Fig. 9. Contour surface plot of CH4conversion as a function of total flow of
feed gases and wt% of W.
Fig. 10. 3D graphic surface optimization of CH4conversion versus wt% of
W and total flow of feed gases.
Fig. 11. Contour surface plot of C5 þ
The highest C5
þ
selectivity is 70.2% when wt% of W
doped¼3.2%, vol% of O2¼7.6%, and total flow of feed
gases¼208.9 ml/min.
The results inTable 9pertain to the catalytic reaction test at the optimized reaction condition to compare with the modeling result. The experimental values are 27 and 69%
for CH4 conversion and C5
þ
selectivity, respectively. The
results in Table 9 also indicated to achieve a high C5
þ
selectivity the percentage of O2 in the feed gas is very critical; otherwise the oligomerization activity will be suppressed. Meanwhile the % error between the predicted
and experimental results for CH4 conversion and C5
þ
selectivity are 8 and 2%, respectively. The discrepancies between the predicted and experimental results are probably due to the characteristic of the catalysts, which have not
been taken into account by the statistical model. Never-theless, the differences are within the acceptable limit. From these results, it is verified that the statistical model is useful
for the accurate prediction of C5
þ
selectivity and CH4
conversion.
The composition of liquid fuels and research octane number (RON) over 3.0Cu – 3.2W/ZSM-5 catalyst is shown inTable 10. The RON was estimated[31]to be 86.1. The
gasoline composition has a low n-paraffin and high
aromatics content, at 9 and 17%, respectively, while the majority is olefins at 52% as indicated inTable 10.
4. Conclusions
The direct conversion of methane was optimized over Cu – W/ZSM-5 catalyst using ‘Statsoft Statistica’ version 6.0 software. The three independent variables involved in the optimisation are wt% of W doped, vol% of O2, and total flow of feed gases. The Student t-test,p-value and Pareto chart indicated that the variable with the largest effect was vol% of O2 ðX2Þ and its quadratic effect ðX2X2Þ: This is
followed by flow total of feed gasesðX3Þ;wt% of W doped ðX1Þ and its quadratic effects (X3X3 and X1X1). The
interactions between any two of the independent variables can be neglected. From the RSM results the optimal
methane conversion and C5
þ
selectivity of 29.4 and 70.2%, respectively, were obtained. The adequacy of this model is confirmed by means of variance analysis and additional experiment.
Acknowledgements
One of the authors (D.D.A) gratefully acknowledge the financial support received in the form of a research grant (Project No: 02-02-06-0101) and (Project No: 09-02-06-0057-SR005/09-07) from the Ministry of Science, Tech-nology and Environment, Malaysia.
Fig. 12. 3D graphic surface optimization of C5 þ
selectivity versus wt% of W and total flow of feed gases.
Table 8
Optimization results using response surface method
Optimal CH4conversion Optimal C5 þ
selectivity
wt% of W doped 3.2 3.2
vol% of O2 12.3 7.6
Total flow of feed gases (ml/min)
203.9 208.9
Table 9
Comparison between predicted and observed optimized values
% of W doped
% vol of O2
Total flow of feed gases
Predic -ted (%)
Observed (%)
% Error
CH4conversion 3.2 12.3 203.9 29.4 27.0 8.0
C5 þ
selectivity 3.2 7.6 208.9 70.2 69.0 2.0
Table 10
The RON and composition of liquid fuels over 3.0Cu loaded 3.2W/ZSM-5 catalyst
Composition of liquid fuels %
Gasoline range (C5 – 10) 82.8
C11 þ
range 18.2
Composition of gasoline range %
n-Paraffins 9.0
Iso-paraffins 22.0
Olefins 52.0
Aromatics 17.0
References
[1] Han S, Martenak DJ, Palermo RE, Pearson JA, Walsh DE. J Catal 1994;148:134.
[2] Han S, Kaufman EA, Martenak DJ, Palermo RE, Pearson JA, Walsh DE. Catal Lett 1994;29:27.
[3] Szoke A, Solymosi F. Appl Catal A: Gen 1996;142:361.
[4] Pierella LB, Wang L, Anunziata OA. Reac Kin Catal Lett 1997; 60:101.
[5] Weckhuysen BM, Wang D, Rosynek MP, Lunsford JH. J Catal 1988; 175:338.
[6] Anggoro DD. Master Thesis, Universiti Teknologi Malaysia; 1998. [7] Sharif Zain SH. Master Thesis, Universiti Teknologi Malaysia;
1999.
[8] Meriaudeau P, Vu Thi TH, Le Van T. Catal Lett 2000;64:49. [9] Pak S, Tatjana RF, Michael PR, Jack HL. Catal Lett 2000;66:1. [10] Solymosi F, Cserenyi J, Szoke A, Bansagi T, Oszko A. J Catal 1997;
165:150.
[11] Liu W, Xu Y, Wong ST, Wang L, Qiu J, Yang N. J Mol Catal A: Chem 1997;120:257.
[12] Xu Y, Lin L. Appl Catal A: Gen 1999;188:53.
[13] Lu Y, Xu Z, Tian Z, Zhang T, Lin L. Catal Lett 1999;62:215. [14] Kim YH, Borry RW, Iglesia E. Proceeding of the 8th APCChE Seoul,
Korea 1999;199:757.
[15] Ha Vu TT, Tiep Le V, Meriaudeau P, Naccache C. J Mol Catal A: Chem 2002;181:283.
[16] Wang L, Xu Y, Wong ST, Cui W, Guo X. Appl Catal A: Gen 1997; 152:173.
[17] Liu B, Yang Y, Sayari A. Appl Catal A: Gen 2001;214:95. [18] Amin NAS, Anggoro DD. J Nat Gas Chem 2003;12:123.
[19] Li S, Zhang C, Kan Q, Wang D, Wu T, Lin L. Appl Catal A: Gen 1999;187:199.
[20] Xiong ZT, Chen LL, Zhang HB, Zeng JL, Lin GD. Catal Lett 2001;74: 227.
[21] Xiong ZT, Zhang HB, Lin GD, Zeng JL. Catal Lett 2001;74:233. [22] Anggoro DD, Amin NAS. Proceeding of the Regional Symposium
Chemical Engineering, Kuala Lumpur, Malaysia; 2002:577. [23] Larentis AL, de Resende NS, Salim VMM, Pinto JC. Appl Catal A:
Gen 2001;215:211.
[24] Rezzoug SA, Capart R. Energy Conver Mgmt 2003;44:781. [25] Nele M, Vidal A, Bhering DL, Pinto JC, Salim VMM. Appl Catal A:
Gen 1999;178:177.
[26] Yoon WL, Park JS, Jung H, Lee HT, Lee DK. Fuel 1999;78:809. [27] Murphy TD. Chem Engng 1977;6:168.
[28] Burtis CA, Bostick WD, Overton JB, Mrocheek JE. Anal Chem 1981; 53:1154.
[29] Cornell JA. How to apply response surface methodology. USA: American Society for Quality Control; 1990.
[30] Box GEP, Hunter WG, Hunter JS. Statistics for experiment: an introduction to design, data analysis and model building. New York: Wiley; 1978.