Scholarship at UWindsor
Scholarship at UWindsor
Electronic Theses and Dissertations Theses, Dissertations, and Major Papers
2012
Variability of Graphomotor Task Performance in Adults with
Variability of Graphomotor Task Performance in Adults with
ADHD: A Kinematic Approach
ADHD: A Kinematic Approach
Thomas Duda
University of Windsor
Follow this and additional works at: https://scholar.uwindsor.ca/etd
Recommended Citation Recommended Citation
Duda, Thomas, "Variability of Graphomotor Task Performance in Adults with ADHD: A Kinematic Approach" (2012). Electronic Theses and Dissertations. 4802.
https://scholar.uwindsor.ca/etd/4802
by
Thomas A. Duda
A Thesis
Submitted to the Faculty of Graduate Studies through Psychology
in Partial Fulfillment of the Requirements for the Degree of Master of Arts at the
University of Windsor
Windsor, Ontario, Canada
2012
Approach
by
Thomas A. Duda
APPROVED BY:
______________________________________________ Dr. Nancy McNevin
Faculty of Human Kinetics
______________________________________________ Dr. Anne Baird
Department of Psychology
______________________________________________ Dr. Joseph Casey, Advisor
Department of Psychology
______________________________________________ Dr. Josee Jarry, Chair of Defense
Department of Psychology
DECLARATION OF ORIGINALITY
I hereby certify that I am the sole author of this thesis and that no part of this
thesis has been published or submitted for publication.
I certify that, to the best of my knowledge, my thesis does not infringe upon
anyone’s copyright nor violate any proprietary rights and that any ideas, techniques,
quotations, or any other material from the work of other people included in my thesis,
published or otherwise, are fully acknowledged in accordance with the standard
referencing practices. Furthermore, to the extent that I have included copyrighted
material that surpasses the bounds of fair dealing within the meaning of the Canada
Copyright Act, I certify that I have obtained a written permission from the copyright
owner(s) to include such material(s) in my thesis and have included copies of such
copyright clearances to my appendix.
I declare that this is a true copy of my thesis, including any final revisions, as
approved by my thesis committee and the Graduate Studies office, and that this thesis has
ABSTRACT
Attention-Deficit Hyperactivity Disorder (ADHD) is a neurodevelopmental disorder
characterized by symptoms of inattention and/or a combination of hyperactivity and
impulsivity. Motor problems, including poor graphomotor skills, are frequently found in
those with ADHD and have been noted to be undertreated. Variability of performance
within several domains has also been indicated as a hallmark of ADHD. The present
study sought to 1) determine whether the variability of performance observed in other
psychological domains in those diagnosed with ADHD manifests within kinematic
variables of graphomotor output and 2) determine whether a novel writing task
differentially affects the graphomotor output of adults diagnosed with ADHD versus
controls. Findings and implications are discussed.
Keywords: digitizing tablet, stimulant medication, fine motor skills,
DEDICATION
To my wife Laura, without whose love and support, my current path would be
ACKNOWLEDGEMENTS
The successful completion of this document would not have been possible
without the support of several key individuals. I would like to thank my supervisor, Dr.
Joseph Casey, for his advice, feedback, and guidance in managing this complex project. I
would also like to acknowledge my thesis committee members, Dr. Anne Baird and Dr.
Nancy McNevin, for all of their input and support throughout this process.
I would also like to express my appreciation to Vilija Petrauskas for completing
fundamental groundwork to acquire the hardware and software necessary to conduct this
study. Thank you as well to my fellow graduate students who have provided emotional
support as well as advice concerning statistical analyses and the pragmatics of the study.
Finally, I also thank my family – especially my wife Laura – for all of their patience and
support throughout the past two years. I would not have been able to pursue and
TABLE OF CONTENTS
DECLARATION OF ORIGINALITY ... iii
ABSTRACT ... iv
DEDICATION ...v
ACKNOWLEDGEMENTS ... vi
LIST OF TABLES ... ix
LIST OF FIGURES ...x
CHAPTER I. INTRODUCTION Introduction ...1
II. REVIEW OF LITERATURE Diagnostic Criteria ...2
Etiology of ADHD ...3
Impairments Associated with ADHD ...7
Kinematic Analysis of Handwriting ...9
Clinical Research Utilizing Kinematic Analysis ...12
The Present Study ...16
III. DESIGN AND METHODOLOGY Participants ...18
Materials and Apparatus ...19
Demographic Information and ADHD Symptomatology ...19
Estimate of Intellectual Ability ...21
Kinematic Analysis and Digitizing Tablet ...21
Procedures ...23
IV. ANALYSIS OF RESULTS Data Analysis of Assumptions...26
Homogeneity of Variance ...26
Normality and Independence of Observations ...29
Demogrpahic Information and ADHD Symptomatology ...32
Variability of Graphomotor Performance ...38
The Effects of Novelty on Variability ...39
V. CONCLUSIONS AND RECOMMENDATIONS Discussion ...42
Overlap with Past Research ...42
Variability of Graphomotor Performance ...45
Methodological Limitations ...49
Future Research ...50
APPENDICES Appendix A: Interview Questionnaire ...52
Appendix B: Scaled Version of Novel Symbol ...54
REFERENCES ...55
LIST OF TABLES
Table 1. Internal Consistency & Test-Retest Reliability of the BAARS-IV ...21
Table 2. Variance of Data Within Conditions ...28
Table 3. Levene’s Test of Homogeneity of Variance ...29
Table 4. Normality of Data ...31
Table 5. Participant Demographic Information ...34
Table 6. BAARS-IV ADHD Symptomatology ...35
Table 7. Number of Participants with BAARS-IV Scores ≥ 93rd %tile ...35
Table 8. Automatized Writing Fluency – Summary and Source Table ...37
Table 9. Automatized Writing Variability – Summary and Source Table ...39
LIST OF FIGURES
Figure 1. Velocity profile of the word “hello” written fluently ...14
Figure 2. Velocity profile of the word “hello” written with simulated dysfluency ....15
Figure 3. Automatized Writing Fluency of Control & Clinical Participants ...38
Figure 4. Automatized Writing Variability ...39
CHAPTER I
INTRODUCTION
Attention-Deficit Hyperactivity Disorder (ADHD) is a neurodevelopmental
disorder characterized primarily by symptoms of inattention and/or a combination of
hyperactivity and impulsivity (Barkley, 2006). In addition to the diagnostic criteria that
define ADHD, several other impairments have been consistently identified in those with
ADHD. These characteristics include motor skill impairments, such as poor handwriting,
and variability of task performance, which manifests within several domains. One
promising method that has been used to investigate graphomotor functioning (i.e.,
handwriting) is kinematic analysis, which has historically involved the use of digitizing
technology. Kinematic analysis of graphomotor functioning in the ADHD population has
indicated that within the context of medication status (i.e., whether taking prescribed
dosages of stimulant medication or having discontinued medication), children with
ADHD differ in automatized graphomotor fluency when compared to unaffected
children. Similar results have not been documented in adults with ADHD. However, no
study has investigated whether the variability of performance that is observed within the
CHAPTER II
REVIEW OF LITERATURE
Diagnostic Criteria
The most recent version of the Diagnostic and Statistical Manual of Mental
Disorders (DSM-IV-TR; American Psychiatric Association, 2000) estimates the
prevalence of ADHD to be between 3% and 7% of school aged children in the United
States. In adults, the prevalence of ADHD has been estimated at approximately 4% (as
cited in Biederman, 2005). Data demonstrating persistence of ADHD symptomatology
from childhood into adulthood are mixed, with estimates ranging between 4%
(Mannuzza, Klein, Bessler, Malloy, & LaPadula, 1998) and 85% (Barkley, Fischer,
Smallish, & Fletcher, 2002). Although estimations may be conservative in general (Root
& Resnick, 2003), Barkley (2006) has indicated that prevalence estimates of ADHD
differs based on a variety of factors, including sex, age, diagnostic criteria, data collection
methods, and country of origin.
Utilizing criteria described in the DSM-IV-TR, a diagnosis of ADHD can be
given to those who demonstrate either “six (or more)” symptoms of inattention and/or
“six (or more)” symptoms related to hyperactivity and impulsivity that “have persisted
for at least 6 months to a degree that is maladaptive and inconsistent with developmental
level” (American Psychiatric Association, 2000, p. 92). Further, these symptoms must
have been observed before the individual was 7 years old and with impairment occurring
in two or more settings (e.g., at school, in the home, and/or in the work-place). Specific
subtypes of ADHD, which correspond to different combinations of symptomatology,
(ADHD-PI), and ADHD Predominantly Hyperactive-Impulsive Type (ADHD-HI). A
diagnosis of ADHD-C requires that both six or more symptoms of inattention and six or
more symptoms of hyperactivity-impulsivity have been present for at least the past six
months. The ADHD-PI subtype is indicated when six or more symptoms of inattention
are present for at least six months, but fewer than six symptoms of
hyperactivity-impulsivity are present during this same time period. Finally, a diagnosis of ADHD-HI is
appropriate if six or more symptoms related to hyperactivity-impulsivity have been
present for at least the past six months, but fewer than six symptoms of inattention are
present during this same time period.
Etiology of ADHD
The etiology of ADHD is complex in nature, although recent research implicates
neurological and genetic factors as primary agents of pathogenesis (Barkley, 2006). The
advent and subsequent popularity of modern neuroimaging techniques such as magnetic
resonance imaging (MRI) and diffusion tensor imaging (DTI) have enhanced the ability
of researchers to analyze the structural neuroanatomy of individuals in a non-invasive
manner. In the case of ADHD, several consistent findings have emerged with regard to
abnormal structure of the central nervous system (Barkley, 2006). Widespread
reductions of cortical gray matter have been found in the frontal, parietal, temporal, and
occipital lobes of the cerebral cortex in general (Batty et al., 2010; Shaw et al., 2006) and
in frontal and posterior association cortices in particular (Narr et al., 2009). Although
findings vary to some degree between studies, reductions in gray matter volume have
been found in more circumscribed areas of the cortex and subcortical nuclei in both
prefrontal cortices, basal ganglia (caudate nucleus, globus pallidus, putamen, and
substantia nigra), and anterior cingulate cortex (Amico, Stauber, Koutsouleris, & Frodl,
2010; Castellanos, Geidd, Marsh, & Hamburger, 1996; McAlonan et al., 2007; Romanos
et al., 2010; Seidman et al., 2011). Reductions in the infratentorial structural volume of
the cerebellar vermis have also been found in both children (Castellanos et al., 2001;
Durston et al., 2004; Mackie et al., 2007) and adults (Seidman et al., 2011) diagnosed
with ADHD.
Research also indicates that although those diagnosed with ADHD do not
consistently demonstrate global reductions in white matter volume compared to controls
(Amico et al., 2010; Batty et al., 2010; Durston et al., 2004; McAlonan et al., 2007; Narr
et al., 2009), reduced white matter volumes in specific areas of the cerebrum have been
more consistently documented. For example, McAlonan et al. (2007) found that white
matter tracts of the corpus callosum evidenced reduced volume in those diagnosed with
ADHD. This finding is consistent with past studies indicating reduction in white matter
of the corpus callosum in general (Hynd et al., 1991) and the splenium of the corpus
callosum in particular (Semrud-Clikeman et al., 1994). Other studies investigating the
structural integrity of white matter pathways connecting different regions of the cerebrum
suggest that these pathways appear to be compromised in the ADHD population (Konrad
& Eickhoff, 2010). More specifically, the superior longitudinal fasciculus and anterior
corona radiata, which are tracts projecting between the frontal cortex and basal ganglia,
have evinced reduced white matter integrity in children and adults based on
measurements of fractional anisotropy (FA; representing the directionality and shape of
coefficient (ADC; representing the volume of white matter diffusion) (Liston, Cohen,
Teslovich, Levenson, & Casey, 2011). Due to the aforementioned inconsistencies in
white matter volumetric findings in the ADHD literature, however, firm conclusions
concerning the role of white matter pathways in the pathophysiology of ADHD cannot be
drawn at this time.
Although relationships between ADHD symptomatology and structural
abnormalities can only be inferred due to the nature of these studies, functional
neuroimaging techniques, such as functional magnetic resonance imaging (fMRI),
provide additional evidence that structures believed to subserve abilities related to
attention, inhibition, and motor control – abilities that are impaired in those with ADHD
– are the same structures that demonstrate structural abnormalities in ADHD
(Brossard-Racine, Majnemer, & Shevell, 2011; Seidman et al., 2006; Swanson, Castellanos, Murias,
LaHoste, & Kennedy, 1998; Shaw et al., 2006). Compared with healthy children,
children with ADHD show abnormal patterns of activation (i.e., hypo-activation) in the
prefrontal cortex, basal ganglia, and cerebellum when performing tasks related to
attention, inhibition, motor control, and executive function (Bush et al., 1999; Durston et
al., 2003; Posner et al., 2011; Rubia et al., 1999; Teicher et al., 2000; Vaidya et al., 1998;
Yeo et al., 2003). Differences also appear to persist into adulthood. For example,
Cubillo, Halari, Giampietro, Taylor, & Rubia (2011) found that compared with
neurotypical individuals, medication naive adults diagnosed with ADHD in childhood
who continued to demonstrate symptomatology into adulthood were found to have
reduced activation in the orbital frontal cortex, medial frontal cortex, and striatum (i.e.,
inferior and dorsolateral prefrontal cortices during tasks of working memory and
attention.
Although studies have not demonstrated that ADHD occurs as a result of
chromosomal abnormalities, several lines of research (i.e., family, adoption, twin, and
genetic studies) indicate that ADHD has a high degree of heritability (Barkley, 2006).
Highlighting the heritable and familial nature of ADHD – with some heritability rates
estimated to be as high 0.76 (Faraone et al., 2005) – are findings that asymptomatic
siblings of those diagnosed with ADHD demonstrate a trend towards similar volumetric
reductions in cortical regions comparable with those found in their affected siblings
(Durston et al., 2004).
At least seven genes appear to be implicated in the etiology of ADHD (Faraone et
al., 2005), although several other genes are currently under investigation (see
Banaschewski, Becker, Scherag, Franke, & Coghill, 2010, for a review). One example is
the dopamine transporter gene, DAT1, which has received significant attention as
mutations of this gene have been found to be related to presence of ADHD
symptomatology in both adults (Brown et al., 2011) and children (Daly, Hawi, Fitzgerald,
& Gill, 1999).
Dysfunction or imbalance of dopamine (DA), norepinephrine (NE), and
noradrenaline (NA) neurotransmitters have also been implicated in the pathophysiology
of ADHD (Arnsten, Berridge, & McCracken, 2009; Barkley, 2006; Biderman, 2005). In
a recent review of the literature investigating the influences of DA and NA in ADHD, del
Campo, Chamberlain, Sahakian, and Robbins (2011) suggested that DA and NA may
a combination of DA and NA abnormalities may affect functioning of the prefrontal
cortex and by extension abilities related to inhibition, DA alone may affect functioning of
subcortical structures such as the basal ganglia, in turn affecting attentional abilities.
Impairments Associated with ADHD
Beyond the primary symptoms of inattention, hyperactivity, and impulsivity,
decades of research has demonstrated that ADHD is associated with numerous
impairments affecting various domains of activities and functioning. Areas of
impairment include cognitive functioning, language development and expression, motor
skills, emotional regulation, academic performance, consistency of task performance, and
general health and well-being (Barkley, 2006). Of particular interest here are the motor
control problems, which are often under-treated in this population (Fliers et al., 2009),
and the variability of task performance and expression.
Individuals diagnosed with ADHD have been shown to demonstrate variability in
task performance and behaviours within several domains, including emotional expression
(i.e., emotional lability; Barkley & Fischer, 2010; Posner et al., 2011), qualitative and
quantitative handwriting production (Rosenblum, Epsztein, & Josman, 2008), in-phase
bimanual coordination (Klimkeit, Sheppard, Lee, & Bradshaw, 2004), motor force output
(Pereira, Eliasson, & Forssberg, 2000), and fine motor skill movements (Pitcher, Piek, &
Barrett, 2002). Anecdotal reports from teachers and parents also suggest that children
diagnosed with ADHD, as compared to healthy children, display a great deal of
variability in their academic work and the quality with which they complete household
duties (Barkley, 2006). Due to the observation that variability of task performance has
“some believe [variability of task performance] to be a primary deficit in ADHD”
(Barkley, 2006, p. 136).
Although it is still unclear whether or not developmental motor milestones are
generally delayed in children with ADHD (Barkley, 2006), the pervasive nature of motor
difficulties that are observed in this population is highlighted by findings demonstrating
significant comorbidity with Developmental Coordination Disorder, which is
characterized by “marked impairment in the development of motor coordination” that
“significantly interferes with academic achievement or activities of daily living”
(American Psychiatric Association, 2000, pp. 56-57), when compared to the general
population (Kadesjo & Gillberg, 2001; Piek, Pitcher, & Hay, 1999). Indeed, there is
some evidence to suggest that ADHD and Developmental Coordination Disorder (DCD)
share a genetic component (Martin, Piek, & Hay, 2006). Regardless of the presence of
DCD, it is clear that those diagnosed with ADHD demonstrate motor impairments more
frequently than the general population (Brossard-Racine, Majnemer, & Shevell., 2011).
Examples of motor impairments found in those diagnosed with ADHD include poor
handwriting (Brossard-Racine, Majnemer, Shevell, Snider, & Belanger, 2011); decreased
speed and accuracy of complex (but not simple) fine and tactual motor performance
(Meyer & Sagvolden, 2006); and deficits in balance, manual dexterity, coordination, and
fine and gross motor skills (Piek, Pitcher, & Hay, 1999). Highlighting the importance of
impairments in both motor functioning in general and timing of motor behaviour in
particular are studies indicating that these problems are not only found in those diagnosed
with ADHD, but also in siblings without an ADHD diagnosis. For example, Rommelse
and concluded that based on the evidence, “Variability in motor timing appears a useful
endophenotypic candidate: It is clearly associated with ADHD, it is also present in
non-ADHD siblings, and it correlates within families” (p. 131). “Moderate” and statistically
significant positive correlations between severity of ADHD symptomatology and severity
of motor sequelae have also been documented (Rommelse et al., 2009), which provide
additional support for the notion that both motor control dysfunction and variability in
task performance could be considered as primary deficits in those diagnosed with ADHD.
Relevant to the academic success of children is the skill of handwriting. In a
review of the literature investigating the handwriting skills of children diagnosed with
ADHD, Brossard-Racine, Majnemer, Shevell, and Snider (2008) concluded that the
handwriting of individuals in this population can be characterized as impaired, often
illegible, and less organized than the handwriting of control children, which in turn
results in low academic achievement. Poor qualitative writing observed in this
population does not appear to be related to pure visual-perceptual, visual-motor
integration, or linguistic difficulties; instead, poor performance likely involves many
different processes (Brossard-Racine et al., 2008), including dysfunction in basic
parameter setting, such as regulation of force, speed, and size of graphomotor movements
(van Galen, 1991); motor control; and timing aspects of handwriting (Adi-Japha et al.,
2007; Marcotte & Stern, 1997; Schoemaker, Ketelaars, van Zonneveld, Minderaa, &
Mulder, 2005).
Kinematic Analysis of Handwriting
The volitional control of handwriting can be thought of as a complex process
Galen, 1991, p. 165) that are organized hierarchically and in parallel (Plamondon, 1995a)
to produce meaningful visual-spatial output. Using a motor program metaphor,
graphomotor processes begin with the retrieval of a high-level representation of the
desired motor output - which might involve acquiring trajectory based stroke segments
that can be combined to form complex symbols as opposed to retrieving whole letters or
words stored within a visual-spatial “brain dictionary” (Lacquaniti, 1989, p. 287). This in
turn is followed by a conversion of this representation into motor control “commands,”
finally ending with the neuromuscular system responding in the desired manner
(Plamondon, Yu, Stelmach, & Clement, 1991). In addition, the neuromuscular and
higher-order systems make necessary adjustments based on relevant “visual and/or
kinesthetic feedback” (Dooijes, 1983, p. 104). Central nervous system structures likely
involved in these motor output processes include the primary motor cortex, premotor
cortex, supplemental motor area, basal ganglia, cerebellum, and spinal cord (Plamondon,
1995a).
Studies investigating the cognitive, psychomotor, and biophysical processes
involved in graphomotor control generally support this process and its related
components (Meulenbroek & Thomassen, 1993; Meulenbroek & van Galen, 1988;
Portier & van Galen, 1992; Teulings, Thomassen, & van Galen, 1983; van Galen, 1990;
Woch, Plamondon, & O’Reilly, 2011; see Plamondon & Maarse, 1989, for a review and
evaluation of computational motor models of handwriting), with the initial phases of
voluntary motor control represented by measurements of reaction time and the latter
phases represented by measurements of total movement time (Bellgrove et al., 1997) and
(e.g., kinematic analysis), then, can be viewed as a method to make inferences about
these cognitive, psychomotor, and biophysical processes underlying graphomotor
function.
Kinematic analysis involves the quantification of “time changes of position,
velocity, and acceleration” (Viviani & Terzuolo, 1982, p. 431). Although many
technological options are available for kinematic analysis, the use of digitizing tablets to
capture handwriting signals has predominated in graphonomic research of both healthy
and clinical populations over the past 30 years (for a review of early graphomotor
research, including the use of digitizing tablets, see Graham & Weintraub, 1996). In the
domain of graphonomics, kinematic measures can be quantified using parameters of time,
acceleration, velocity, and pen pressure, and variables derived from these basic measures
can be used to (a) describe abilities related to degree of movement automatization and
fluency (Eichhorn et al., 1996; Margolin & Wing, 1983; Mergl, Tigges, Schroter, Moller,
& Hegerl, 1999; Portier & van Galen, 1992; Teulings, Contreras-Vidal, Stelmach, &
Adler, 1997; Yan, Rountree, Massman, Doody, & Li, 2008); (b) quantify the relative
decelerations and accelerations of handwriting movements (Eichhorn et al., 1996; Mergl
et al., 1999; Plamondon & Clement, 1991; van Galen, Portier, Smits-Engelsman, &
Schomaker, 1993); (c) indicate stability, coordination, and consistency of an individual’s
handwriting (Mergl et al., 1999; Schroter et al., 2003; Teulings & Schomaker, 1993;
Slavin, Phillips, Bradshaw, Hall, & Presnell, 1999); (d) indicate the sharing of processing
resources, the difficulty of writing trajectories, and the presence of dysmetria (van Galen,
1991; Teulings, Contreras-Vidal, Stelmach, & Adler, 1997; Phillips et al., 2009); (e)
Nimmo-Smith, 1991; Phillips et al., 1999); and (f) indicate the smoothness and efficiency
of movements (Bellgrove et al., 1997; Phillips et al., 2009). In this sense, the metrics
produced by kinematic analyses of handwriting can be viewed as objective rather than
subjective measurements of graphomotor performance.
Clinical Research Utilizing Kinematic Analysis
The use of digitizing technology to quantify graphomotor processes as an
investigative and potentially diagnostic tool has been conducted with a multitude of
patient populations. Pathologies and disorders investigated include, but are not limited
to, ADHD (e.g., Adi-Japha et al., 2007; Flapper, Houwen, & Schoemaker, 2006;
Schoemaker et al., 2005; Tucha & Lange, 2001, 2004, 2005; Tucha, Paul, & Lange,
2003); Dementia, Alzheimer’s Disease, and Mild Cognitive Impairment (e.g., Bellgrove
et al., 1997; Yan et al., 2008); DCD (e.g., Bo, Bastien, Kagerer, Contreras-Vidal, &
Clark, 2008; Chang & Yu, 2010; Rosenblum & Livneh-Zirinski, 2008; Smits-Engelsman
Niemeijer, & van Galen, 2001); Dysgraphia (e.g., Kushki, Schwellnus, Ilyas, & Chau,
2011; Overvelde & Hulstijn, in press; Rosenblum, Dvorkin, & Weiss, 2006;
Smits-Engelsman & van Galen, 1997); Huntington’s Disease (e.g., Phillips et al., 1996; Phillips,
Chiu, Bradshaw, & Iansek, 1995; Slavin et al., 1999; Yaguez, Canavan, Lange, &
Homberg, 1999); Learning Disability (e.g., Galli et al., 2011; van Roon, Caeyenberghs,
Swinnen, & Smits-Engelsman, 2010); Schizophrenia (e.g., Grootens et al., 2009; Jahn et
al., 2006; Putzhammer et al., 2005; Tigges et al., 2000); and Parkinson’s Disease (e.g.,
Gangadhar et al., 2009; Poluha, Teulings, & Brookshire, 1998; Ponsen et al., 2006; Rand,
Stelmach, & Bloedel, 2000; van Gemmert, Teulings, & Stelmach, 1998). Germane to the
Using qualitative variables such as legibility; spacing, letter size, and alignment
consistency; organization of material within space; and letter insertions, transpositions,
substitutions, and omissions, studies of handwriting produced by children diagnosed with
ADHD indicate that their writing quality is generally poor, immature, and error-prone
when compared with non-ADHD controls (Adi-Japha et al., 2007; Flapper et al., 2006;
Lerer, Artner, & Lerer, 1979; Marcotte & Stern, 1997; Whalen, Henker, & Finck, 1981;
Tucha & Lange, 2001). In addition, poor qualitative performance does not appear to be
the result of purely linguistic, visual, perceptual, or visual motor integration deficits
(Adi-Japha et al., 2007; Marcotte & Stern, 1997) and typically improves after taking prescribed
dosages of stimulant medication (Lerer et al., 1979; Tucha & Lange, 2001; Whalen et al.,
1981). Interestingly, kinematic analyses assessing objective, process related aspects of
handwriting indicate that the handwriting produced by children diagnosed with ADHD is
more dysfluent and thus appears less automatized when taking stimulant medication
compared to when they are not taking prescribed medication, and is more dysfluent when
such children are on stimulant medication than observed in controls (Flapper et al., 2006;
Tucha & Lange, 2001, 2004, 2005). This pattern of fluency and dysfluency related to
medication status, however, has not been observed in adults diagnosed with ADHD under
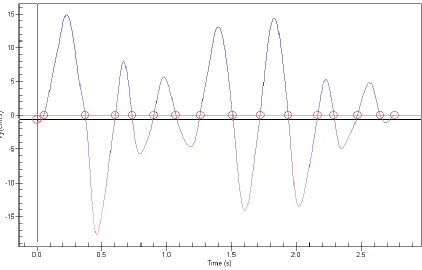
similar conditions (Tucha & Lange, 2004). In these contexts, writing fluency is
operationalized as the number of changes in direction of velocity or acceleration as
recorded by digitizing technology and analyzed by appropriate software. Velocity
profiles of fluent, automatized handwriting appear as smooth asymmetrical bell-shaped
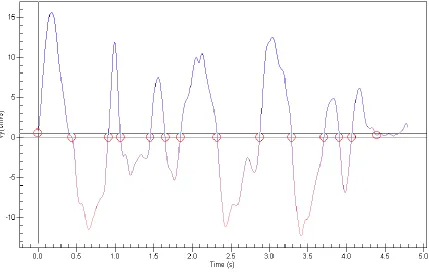
curves with few changes in velocity/acceleration direction, whereas dysfluent,
many changes in the direction of velocity/acceleration. See Figures 1 and 2 for examples
of fluent versus dysfluent vertical velocity profiles, respectively.
Figure 2. Velocity profile of the word “hello” written with simulated dysfluency.
In addition, these studies demonstrated that while off prescribed dosages of stimulant
medication, kinematic measures of graphomotor fluency in affected children were not
significantly different from those of non-ADHD controls. Further, it does not appear that
these findings are due to a direct effect of medication, as fluent movements can be
elicited from children with ADHD taking stimulant medication (Tucha & Lange, 2004).
Rather, this decreased fluency and automaticity may be the result of a secondary effect
resulting from enhanced attention, from greater cognitive control (Tucha & Lange, 2004;
Tucha, Mecklinger, Walitza, & Lange, 2006; Tucha et al., 2003), or from possibly other
cognitive, motor, or psychomotor processes influenced by stimulant medication.
Alternatively, Lange et al. (2007) suggested that children and adults with ADHD may, in
general, “have difficulties in skills whose acquisition starts as a [laboured] and conscious
256). Similarly, Flapper et al. (2006) noted that typically, accuracy is achieved before
speed and fluency when learning a complex task. In turn, children with ADHD would
first need to engage sufficient attentional resources and motor skills for an extended
period of time before generating handwriting that is both fluent and accurate, noting that
both attentional abilities and motor skills are reported to improve with methylphenidate
treatment in adults, adolescents, and children diagnosed with ADHD (Bart, Podoly, &
Bar-Haim, 2010; Lerer et al., 1979; Shafritz, Marchione, Gore, Shaywitz, & Shaywitz,
2004; Stray, Stray, Iverson, Ruud, & Ellersten, 2009; Tucha, Mecklinger, Laufkotter, et
al., 2006; Tucha, Prell, et al., 2006).
The Present Study
There are few studies that have investigated the kinematic aspects of writing in
adults diagnosed with ADHD, with no study specifically examining the potential
variability of task performance within the kinematic aspects of graphomotor skills in
adults diagnosed with ADHD, and no study comparing novel versus putatively
automatized graphomotor processes in this population. As such, using a digitizing tablet
to capture kinematic aspects of handwriting, the present study seeks to determine within
the context of medication status 1) whether the variability of performance observed in
other psychological domains (e.g., task persistence, emotion, and attention) in those
diagnosed with ADHD manifests within kinematic variables associated with consistency,
stability, and coordination during the execution of an automatized graphomotor task; and
2) assess the effects of novelty on consistency measures of graphomotor performance
between adults with and without ADHD. Under the premise that handwriting output is
produces volitional graphomotor output by controlling the velocity of an end-effector via
interactions between higher-order cortical and sub-cortical systems and lower-level
agonist and antagonist neuromuscular systems [Guerfali & Plamondon, 1997;
Plamondon, 1993, 1995a, 1995b, 1998; Plamondon, Feng, & Woch, 2003]) and noting
variability of performance/behaviour demonstrated in other psychological domains in
those diagnosed with ADHD, it is hypothesized that 1) greater intra-individual variability
in kinematic velocity measures will be observed in adults diagnosed with ADHD off
medication when compared to neurotypical adults. Additionally, 2) although no a priori
hypothesis is salient with regard to the effects of novelty on variability measures in those
diagnosed with ADHD, it could be speculated that if variability of performance observed
in adults with ADHD extends to the graphomotor domain, ADHD participants
discontinuing medication will be differentially affected by a novel graphomotor task and
in turn elicit greater levels of inconsistency compared to those without ADHD. Should
statistically and practically significant differences become evident (i.e., differences of
medium to large effect sizes), this would be the first study utilizing kinematic analysis to
explicitly demonstrate variability of performance within the graphomotor domain in
adults diagnosed with ADHD. Significant results indicating variability in kinematic
performance would also add to the current literature indicating that ADHD is not simply
a disorder of childhood, but rather, a disorder in which specific motor control differences
extend into adulthood. Further, the results of this study would support conducting future
research into the use of digitizing technology as an objective diagnostic and descriptive
tool within the ADHD population, which in turn may enhance the specificity and/or
CHAPTER III
DESIGN AND METHODOLOGY
Participants
Power analysis (α = .05, [1 – β] = .80) indicated that using the proposed
methodological design and statistical analysis, 52 total participants would be needed to
detect a statistically significant difference of large effect size. For within-group
differences, power analysis indicated that 16 participants would be needed to detect
differences of large effect size.
Thirty-eight participants were recruited through three sources: control
participants were recruited via the University of Windsor’s Psychology Participant Pool
(n = 31) and clinical participants were recruited through Student Disabilities Services
(Education Development Center) at the University of Windsor and through the private
practice of a local psychiatrist (n = 8). One control participant, however, requested that
their data be removed from the study, resulting in a net of 30 control participants and 38
total participants. To minimize confounds related to extraneous visual and motor
disturbances, participants included only those with normal or corrected to normal vision
and those who did not have an existing neurological condition that would negatively
affect graphomotor performance (e.g., cerebral palsy affecting the upper extremities,
severe tendinitis, or carpal tunnel syndrome). In addition, clinical participants included
only those who were currently taking prescribed dosages of stimulant medication for the
treatment of ADHD symptoms. Participants recruited through the University of
Windsor’s Psychology Participant Pool received course bonus points (1 point for control
participants based on two hours of participation time) for participating in the research
study. Participants recruited through Student Disability Services at the University of
Windsor and the private practice of the local psychiatrist received a $10 gift card and a
chance to win one of two $50 debit cards via entry into a draw.
Materials and Apparatus
Demographic information and ADHD symptomatology. For the purposes of
sample description, participant demographic information including age, sex, handedness,
current medications (including type and dosage), ethnicity, official ADHD diagnosis and
subtype (if applicable), and neurological status was collected from each participant via an
in-person interview (see Appendix A for the interview form used). For participants
diagnosed with ADHD, records pertaining to official diagnoses were reviewed and
specific diagnoses if available (e.g., ADHD-C, ADHD-PI, ADHD-HI, and any comorbid
diagnoses) were also recorded for descriptive purposes. In addition, all participants
completed the Barkley Adult ADHD Rating Scale-IV (BAARS-IV; Barkley, 2011).
Based on DSM-IV diagnostic criteria, the BAARS-IV is a self-report questionnaire
designed to evaluate current and/or childhood ADHD symptoms in adults between the
ages of 18 and 81 years. According to the manual, the normative sample used to develop
the BAARS-IV, which consisted of 1,249 adults between the ages of 18 and 96, “closely
approximated the U.S. adult population based on the U.S. Census from the year 2000
concerning regional distribution, sex, race/ethnic group, marital status, employment
status, total household income, and education” (Barkley, 2011, p. 14). After completion
of the questionnaire, a total ADHD score, symptom count, and subscale scores for both
also contains forms allowing current and childhood symptomatology scores to be derived
based on reports from others through the use of an alternative quick-screen. These were
not utilized in this study). The BAARS-IV also produces subscale scores related to four
recognized ADHD symptom dimensions: Inattention, Hyperactivity, Impulsivity, and
Sluggish Cognitive Tempo (SCT). According to the BAARS-IV manual, ADHD scores
at or above the 93rd percentile may be interpreted as reflecting a significant abnormality
and clinical significance in that domain. Because clinical participants participated in the
research both on and off of their ADHD medication, they were asked to answer the
questionnaire regarding their current symptomatology within the context of being off of
their medication. Finally, if subtype identifier information was unavailable or unknown,
a determination of subtype was made based upon the clinical participant’s self-report
current ADHD symptoms as measured by the BAARS-IV. That is, for clinical
participants only, a subtype identifier of ADHD-PI was given if significant abnormality
was reported only within the Inattention domain, a subtype identifier of ADHD-HI was
given if significant abnormality was reported only within the Hyperactivity or
Impulsivity domains, and a subtype identifier of ADHD-C was given if significant
abnormality was reported within both the Inattention domain and the Hyperactivity or
Impulsivity domains.
Internal consistency reliability of the BAARS-IV was reported by the manual to
be “satisfactory” for current symptom total score and for each subscale/domain score for
both current and childhood reported symptoms. Test-retest reliability was described as
“reasonable” over a 2- to 3-week period. Finally, construct validity, discriminant
test-retest reliability measures for the BAARS-IV, as indicated by the manual (Barkley,
2011), are listed in Table 1.
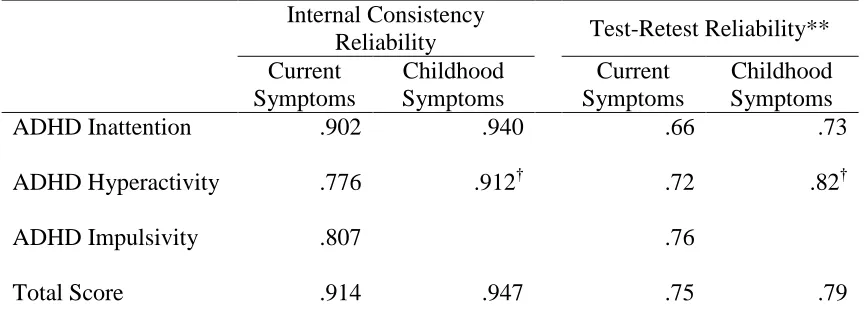
Table 1
Internal Consistency & Test-Retest Reliabilities of the BAARS-IV*
Internal Consistency
Reliability Test-Retest Reliability**
Current Symptoms
Childhood Symptoms
Current Symptoms
Childhood Symptoms
ADHD Inattention .902 .940 .66 .73
ADHD Hyperactivity .776 .912† .72 .82†
ADHD Impulsivity .807 .76
Total Score .914 .947 .75 .79
Note. * Barkley Adult ADHD Rating Scale-IV. ** Test-retest reliability over a 2- to 3-week period. † Represents combined dimension of hyperactivity-impulsivity.
Estimate of intellectual ability. An estimate of IQ was derived using four
subtests of the Wechsler Adult Intelligence Scale-Fourth Edition (WAIS-IV; Wechsler,
2008). Based on practical considerations and the best combination of short form
reliability and validity coefficients (.953 and .940, respectively; see Sattler & Ryan,
2009), the four subtests used for estimating IQ were Block Design (BD), Vocabulary
(VC), Arithmetic (AR), and Coding (CD). IQ estimates were used for descriptive
purposes and for identifying initial group differences between the control group and the
clinical group.
Kinematic analysis and digitizing tablet. A WACOM Cintiq 21UX digitizing
tablet was used to record the handwriting movements of participants. The digitizing
inking pen was used by participants. MovAlyzeR software (NeuroScript, LLC; Tempe,
AZ, USA) was utilized to quantify handwriting movements with a maximum sampling
rate of 200 Hz and x-y coordinates were low-pass filtered at 12 Hz. Handwriting
movements were broken down by MovAlyzeR software into strokes using interpolated
vertical velocity zero crossings. In this sense, a stroke, representing a “unit” of
handwriting, can be defined as “a segment bounded by time moments at which the
vertical component of the velocity changes sign” (Teulings, Thomassen, & van Galen,
1983, p. 168).
Kinematic variables derived using MovAlyzeR software include Relative
intra-individual standard deviation of Peak Velocity (RPV) and Normalized Jerk (NJ). The
RPV variable is a coefficient of variation (CV) that was derived by dividing the absolute
standard deviation of mean peak velocity of each digitized word or symbol by the
average peak velocity of the digitized word or symbol (Mergl et al., 1999). The word
“hello” and the novel symbol “ ” are described below (see Figure B1 in Appendix B
for a scaled version of the novel symbol). The RPV variable reflects stability,
coordination, and consistency of an individual’s handwriting, with less consistently
controlled movements indicated by higher values and more consistently controlled
movements reflected by lower values (Mergl et al., 1999; Schroter et al., 2003). An RPV
value of 0 would indicate completely identical mean peak velocity across all trials of a
writing task.
NJ is a measure of writing smoothness and fluency. High NJ scores indicate
dysfluent movement and low NJ scores indicate smoother, fluent, and more automatized
and in turn automatizes a graphomotor program, dysfluency decreases (Portier & van
Galen, 1992), as will the NJ variable. In turn, the NJ measure should indicate greater
dysfluency when individuals write a novel symbol or grapheme on the digitizing tablet
versus a well-practiced and automatized symbol or grapheme. The NJ variable is similar
to the dysfluency measure of “number of inversions of acceleration” used in much of the
research utilizing kinematics to investigate graphomotor problems in those diagnosed
with ADHD (for examples, see Flapper et al., 2006; Schoemaker et al., 2005; Tucha &
Lange, 2001, 2004, 2005; Tucha et al., 2006; and Tucha et al., 2003) in that NJ “is the
change of acceleration per time” (Teulings et al., 1997, p. 160). NJ, however, has the
advantage of allowing the comparison of words or symbols of varying size and
movement durations because it is normalized (Teulings et al., 1997).
All demographic and research data were kept confidential and secure.
Additionally, participant demographic and research data were de-identified (i.e., coded
with a randomly assigned participant identification number) but still attached to
identifying information for two weeks after the data were collected, thus giving
participants the opportunity to withdraw their data from the study. After this time, the
link connecting identifying personal information with demographic and research data was
removed and only arbitrary participant identification numbers were associated with
demographic and research data.
Procedures
In the following order, participants: 1) took part in an interview with the
researcher to provide demographic and medical information, 2) answered questions
intellectual ability, 4) signed their name on the digitizing tablet 10 times, 5) wrote the
word “hello” in lower-case using cursive handwriting on the digitizing tablet 30 times
(representing the automatized condition), and 6) wrote the novel symbol “ ” on the
digitizing tablet 30 times (representing the novel word condition). A sample of this word
and symbol was visible to the participant on a card throughout the graphomotor task.
Instructions for all tasks were given aurally, with instruction provided visually on the
digitizing tablet throughout.
All data from control participants was collected in one session. Data obtained
from clinical participants was collected on two occasions, once while the participants
were taking prescribed dosages of ADHD medication and a second time after abstaining
from prescribed dosages of ADHD medication for a 24 to 48 hour period (withdrawal of
medication time-frame based on product information indicating extremely low mean drug
plasma concentrations between 24 and 48 hours after taking stimulant medication; U.S.
Food and Drug Administration, 2007). The time-frame between test and retest for this
group was approximately one week (M = 6.75, SD = 0.71). The demographics
questionnaire, BAARS-IV, and WAIS-IV subtests were completed while the clinical
participants were taking prescribed dosages of ADHD medication to minimize potential
discomfort associated with the return of ADHD symptomatology combined with a
relatively long research process. The Current Symptoms form of the BAARS-IV
questionnaire was completed while clinical participants were off of their prescribed
ADHD medication. Experimental task administration within the context of medication
tasks while taking prescribed medication on their first visit, while the other half
completed the writing tasks while taking prescribed medication during their second visit.
To become familiarized with using the digitizing tablet and pen, all participants
began the writing task by signing their name on the digitizing tablet 10 times.
Subsequently, participants began writing experimental trials. No specific instructions
were given related to the quality of the handwriting participants were to produce beyond
pointing to the sample and telling the participants to “Write the word hello in cursive and
lower case as it is written on the card. Just write how you typically write.” When the
researcher was pressed further for additional instruction, participants were only told to
“Simply write how you typically write in cursive.” In the case of the novel symbol,
participants were instructed as follows: “Here is another symbol for the word ‘hello.’
Please write the symbol as demonstrated on the card.” If participants questioned whether
neatness was required, the investigator stated, “Just write it how you would write any
other word, but make it look like the symbol as demonstrated on the card.” Because
handwriting is variable within individuals, even when writing the same grapheme,
participants wrote each word and symbol 30 times in order to acquire a statistically stable
sample of handwriting. Finally, all participants were given the ability to manipulate the
position of the tablet to one that was comfortable for writing, as well as position the cards
CHAPTER IV
ANALYSIS OF RESULTS
All data analyses were performed using IBM SPSS Statistics, Version 20.0.
Unless otherwise noted, an alpha level of .05 was used to determine statistical
significance. In addition, interpretations of effect sizes using ω2 were based on Kirk’s
(2003) guidelines, such that 0.010 was interpreted as a small association, 0.059 as a
medium association, and 0.138 or larger as a large association.
Data Analysis of Assumptions
Prior to hypothesis testing, the data were analyzed to determine adherence to the
assumptions of ANOVA, repeated measures ANOVA, and mixed design ANOVA.
Cumulatively, tested assumptions included normality of distribution and homogeneity of
variance. The assumptions of sphericity and homogeneity of variance/covariance
matrices by group were not analyzed due to the research design only incorporating two
levels of repeated measures. Assumptions were analyzed using the variables Estimated
IQ, Current Total ADHD Score, Childhood Total ADHD Score, NJ under the
automatized writing task condition, and RPV under both the automatized and novel
writing task conditions, with group membership (i.e., control versus clinical participants)
as the independent variable (IV).
Homogeneity of variance. Homogeneity of variance was assessed by first
identifying outlier variables (i.e., data with derived z-scores greater than |2.5|) and next
using Levene’s test of equality of error variances, with statistical significance of the latter
(i.e., p < .05) reflecting a potential violation of this assumption. The following outliers
and one clinical participant within both the NJ DV during automatized graphomotor
execution while on ADHD medication as well as within the NJ DV during automatized
graphomotor execution while off ADHD medication. In turn, all subsequent analyses of
assumptions were conducted with and without the inclusion of outliers for comparative
purposes. A significant Levene’s statistic was found between the variances of the ADHD
group on medication and control participants within the NJ DV during the automatized
writing task. No other statistical significance was found using Levene’s test, indicating
that the variation within conditions was roughly equivalent for all other comparisons.
When outliers were removed from the dataset, homogeneity of variance statistics
improved for the NJ DV during the automatized writing task when comparing control
participants versus clinical participants on ADHD medication, but statistical significance
persisted. Removing the outlier found within the Estimated IQ DV did not affect the
non-significant finding of Levene’s test of homogeneity of variance, and in fact moved
the data closer towards heterogeneity of variance.
It is important to note that ANOVA may be robust to violations of homogeneity
of variance when comparison groups are equal or nearly equal in size (i.e., the larger
group contains less than 1.50 times the number of participants than the smaller group)
and when the variance distribution between the largest and smallest variances is not
greater than a 4:1 ratio. The control group was 3.75 times larger than the clinical group
and 4.29 times larger than the clinical group for comparisons in which outliers were
removed. In addition, when outliers were retained, the variance distribution between the
largest and smallest variance in NJ data during the automatized writing task comparing
data was removed, the variance ratio in this comparison decreased substantially to almost
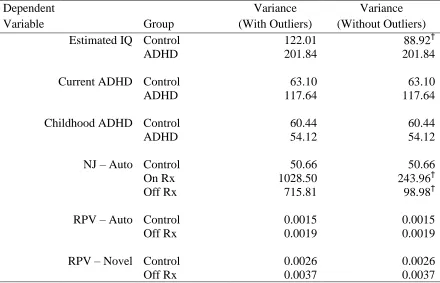
5:1. Variance data are presented in Table 2 and the results of homogeneity of variance
testing are summarized in Table 3.
Table 2
Variance of Data Within Conditions
Dependent
Variable Group
Variance (With Outliers)
Variance (Without Outliers) Estimated IQ Control
ADHD
122.01 201.84
88.92† 201.84
Current ADHD Control ADHD
63.10 117.64
63.10 117.64
Childhood ADHD Control ADHD
60.44 54.12
60.44 54.12
NJ – Auto Control 50.66 50.66
On Rx 1028.50 243.96†
Off Rx 715.81 98.98†
RPV – Auto Control 0.0015 0.0015
Off Rx 0.0019 0.0019
RPV – Novel Control 0.0026 0.0026
Off Rx 0.0037 0.0037
Note. IQ = Estimated Full Scale IQ; NJ = Normalized Jerk; RPV = Relative
Table 3
Levene’s Test of Homogeneity of Variance
F df Sig.
Dependent Variable
Group
Comparison w w/o w w/o w w/o
Estimated IQ Control vs. ADHD 0.58 1.56 1, 36 1, 35 .45 .22
Current ADHD
Control vs. ADHD 0.14 0.14 1, 36 1, 36 .71 .71
Childhood ADHD
Control vs. ADHD 0.04 0.04 1, 36 1, 36 .85 .85
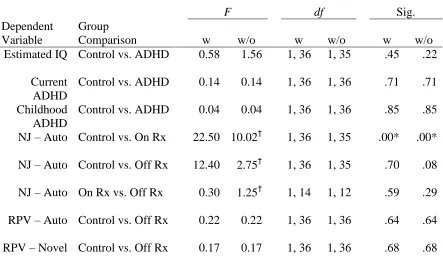
NJ – Auto Control vs. On Rx 22.50 10.02† 1, 36 1, 35 .00* .00*
NJ – Auto Control vs. Off Rx 12.40 2.75† 1, 36 1, 35 .70 .08
NJ – Auto On Rx vs. Off Rx 0.30 1.25† 1, 14 1, 12 .59 .29
RPV – Auto Control vs. Off Rx 0.22 0.22 1, 36 1, 36 .64 .64
RPV – Novel Control vs. Off Rx 0.17 0.17 1, 36 1, 36 .68 .68
Note. Analyses of the assumption of homogeneity of variance within the data. IQ = Estimated Full Scale IQ; NJ = Normalized Jerk, RPV = Relative Intraindividual Peak Velocity; Auto = automatized writing condition; Rx = ADHD participants’ medication status (On or Off medication); w = results with outliers; w/o = results without outliers. * = statistical significance (p < .05) and violation of the assumption of homogeneity of variance. † = a change in value from “with outliers” to “without outliers.”
Normality and Independence of Observations. The assumption of normality
was tested by analyzing skewness, kurtosis, and Shapiro-Wilk statistics. With the
inclusion of outlier scores, skewness z-scores were outside conventional cut-offs of
significance (i.e., skewness greater than |2|) for the NJ DV within the control group under
the automatized condition as well as for the NJ DV within the clinical group off ADHD
medication, both of which indicated a positive skew and a potential violation of the
kurtosis greater than |3|) for the NJ DV under the automatized writing task for controls,
clinical participants on ADHD medication, and clinical participants off ADHD
medication, indicating significant leptokurtic kurtosis. The Shapiro-Wilk statistic was
also statistically significant for these same cells as well as for the Current Total ADHD
Score as measured by the BAARS-IV. Within the RPV DV, no significant skewness or
kurtosis was observed, and the Shapiro-Wilk statistic was non-significant for all data
cells for this variable. This in turn indicated that RPV results represented the only
normally distributed experimental data. Removing outlier data resulted in normalizing
the distribution of data with regard to skewness and kurtosis for all data cells with the
exception of the NJ DV under the automatized writing task within the control group,
which retained its significantly positive skew and significantly leptokurtic distribution.
In addition, the NJ DV under the automatized writing task continued to produce a
significant Shapiro-Wilk statistic within the clinical participant group on ADHD
medication.
ANOVA is said to be robust to violations of normality when sample sizes are
large and group sizes are roughly equivalent. Noting the relatively small sample size and
large group size differences within the sample, the violations of normality found within
the NJ DV while retaining outlier variables would significantly impact the reliability of
the ANOVA F statistic for all comparisons involving the NJ DV. Removing outlier data
normalized the distribution of NJ results for clinical participants off ADHD medication,
but not for NJ results for the control group or clinical participants on ADHD medication.
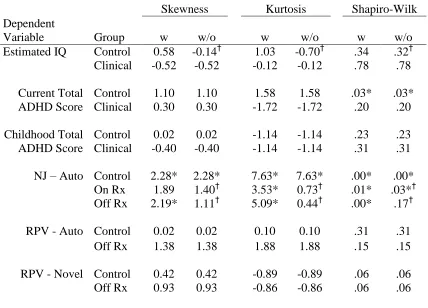
Table 4
Normality of Data
Skewness Kurtosis Shapiro-Wilk
Dependent
Variable Group w w/o w w/o w w/o
Estimated IQ Control
Clinical 0.58 -0.52 -0.14† -0.52 1.03 -0.12 -0.70† -0.12 .34 .78 .32† .78 Current Total ADHD Score Control Clinical 1.10 0.30 1.10 0.30 1.58 -1.72 1.58 -1.72 .03* .20 .03* .20 Childhood Total ADHD Score Control Clinical 0.02 -0.40 0.02 -0.40 -1.14 -1.14 -1.14 -1.14 .23 .31 .23 .31
NJ – Auto Control 2.28* 2.28* 7.63* 7.63* .00* .00*
On Rx 1.89 1.40† 3.53* 0.73† .01* .03*†
Off Rx 2.19* 1.11† 5.09* 0.44† .00* .17†
RPV - Auto Control 0.02 0.02 0.10 0.10 .31 .31
Off Rx 1.38 1.38 1.88 1.88 .15 .15
RPV - Novel Control 0.42 0.42 -0.89 -0.89 .06 .06
Off Rx 0.93 0.93 -0.86 -0.86 .06 .06
Note. Analyses of the assumption of normality of distribution within the data. NJ = Normalized Jerk; RPV = Relative Intraindividual Peak Velocity; Auto = Automatized writing task; Rx = ADHD participants’ medication status (On or Off medication); w = results with outliers; w/o = results without outliers. * = statistical significance (p < .05) and violation of the assumption of normality. † = a change in value from “with outliers” to “without outliers.”
Finally, data were gathered from participants in individual sessions. Combined
with the general novelty of the experimental tasks utilized, lack of known organized
communication between participants, and the manner in which data were gathered, it is
unlikely that participants’ scores were systematically related.
Taken together, the non-normally distributed data on the NJ DV for control
heterogeneity of variance found comparing these two groups increases the risk of Type 1
errors when conducting analyses based on NJ data. In addition, largely unequal sample
sizes and variance distributions greater than 4:1 make conclusions drawn from NJ DV
results during the automatized writing task tenuous due the additional violation in the
assumption of normality. Again, removing outlier data improved the normality of the
data, but did not eliminate non-normality entirely. Given the above stated issues
associated with the data and the assumptions of ANOVA, 1) all subsequent analyses were
conducted without the presence of outlier scores on the NJ DV and 2) nonparametric
statistical analyses were also conducted for comparisons between control and clinical
participants on ADHD medication that involve using the NJ DV in order to provide
support for, or against, significant findings that were found using parametric statistics.
Demographics and ADHD Symptomatology
Data pertaining to participant demographics, estimated IQ, and presence of
ADHD symptomatology were collected for the purposes of sample description.
ANOVAs were performed to determine significant initial group differences when
appropriate.
In the overall sample, more participants were right-handed (84.21%) than
left-handed (15.79%), more women (78.95%) participated in the study than men (21.05%),
and a majority of the participants self-identified as Caucasian (71.05%). Between the
control and clinical participant groups, a greater proportion of clinical participants were
left-handed (37.50%) than control participants (10.00%). Fortunately, kinematic
variables have not been shown to be affected by handedness alone (Mergl et al., 1999).
the control participant sample (10.00%). A slightly greater representation of
non-dominant ethnic/racial group members was also observed in the clinical participant
sample (33.33%) versus the control participant sample (20.00%).
Overall, control participants (M = 27.56, SD = 11.91) were younger than clinical
(M = 35.00, SD = 9.08) participants, but not significantly, F(1, 36) = 2.69, p = .110, and
with a small effect size, ω2 = .043. There was, however, a broader age range in control
participants (age range: 18.58–54.08 years) versus clinical participants (age range: 23.25–
46.60 years). Control (M = 94.17, SD = 11.05) and ADHD (M = 94.88, SD = 14.21)
participants performed nearly identically on the general test of intellectual ability as a
group, F(1, 36) = 0.02, p = .880, ω2 = .000, with both groups falling within the average
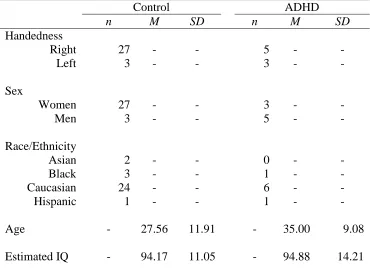
Table 5
Participant Demographic Information
Control ADHD
n M SD n M SD
Handedness
Right 27 - - 5 - -
Left 3 - - 3 - -
Sex
Women 27 - - 3 - -
Men 3 - - 5 - -
Race/Ethnicity
Asian 2 - - 0 - -
Black 3 - - 1 - -
Caucasian 24 - - 6 - -
Hispanic 1 - - 1 - -
Age - 27.56 11.91 - 35.00 9.08
Estimated IQ - 94.17 11.05 - 94.88 14.21
Note. Estimated IQ = estimate of general intellectual ability. ADHD = clinical participants diagnosed with ADHD.
Participant ratings of ADHD symptomatology as measured by the BAARS-IV are
summarized in Table 6. Clinical participants rated current ADHD symptomatology (M =
48.88, SD = 7.86) as occurring significantly more frequently than control participants (M
= 30.00, SD 7.94), F(1, 36) = 35.80, p < .001, with an observed large effect size, ω2 =
.478. In addition, clinical participants reported significantly more symptoms of ADHD
that occurred during childhood (M = 50.88, SD = 7.36) than did control participants (M =
30.67, SD = 7.77), F(1, 36) = 43.56, p < .001, also with a large effect size, ω2 = .528.
Table 6
BAARS-IV ADHD Symptomatology
Control Clinical
M SD M SD
Current Symptom Total ADHD Score:
30.00 7.94 48.88 7.86
Childhood Symptom Total ADHD Score:
30.67 7.77 50.88 7.36
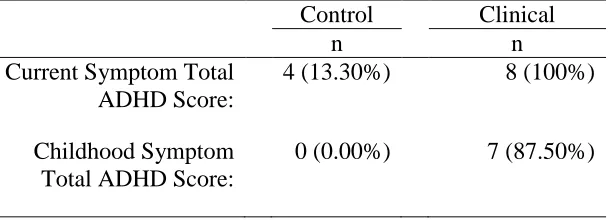
As shown in Table 7, a greater proportion of clinical participants also reported
clinically significant levels of current (100%) and childhood (87.50%) ADHD
symptomatology compared to control participants (significant levels of current ADHD
symptomatology = 13.3%, significant levels of childhood ADHD symptomatology =
0%). Taken together, it can be reasonably concluded that clinical participants reported
significantly higher levels of current and childhood ADHD symptoms than control
participants. Finally, ADHD subtypes diagnosed in clinical participants included
ADHD-C (n = 5), ADHD-PI (n = 1), and ADHD-HI (n = 2).
Table 7
Number of Participants with BAARS-IV Scores ≥ 93rd %tile
Control Clinical
n n
Current Symptom Total ADHD Score:
4 (13.30%) 8 (100%)
Childhood Symptom Total ADHD Score:
Kinematic Analyses
Overlap with past research. Due to multiple comparisons and the relatively low
risk involved with rejecting a true null hypothesis, a Bonferroni correction was used for
all statistical comparisons. As such, the alpha level for statistical comparisons made to
determine support for past research was adjusted to .02. Two One-Way ANOVAs were
used to compare the handwriting fluency of controls with clinical participants both on
ADHD medication as well as off ADHD medication. Between group comparisons based
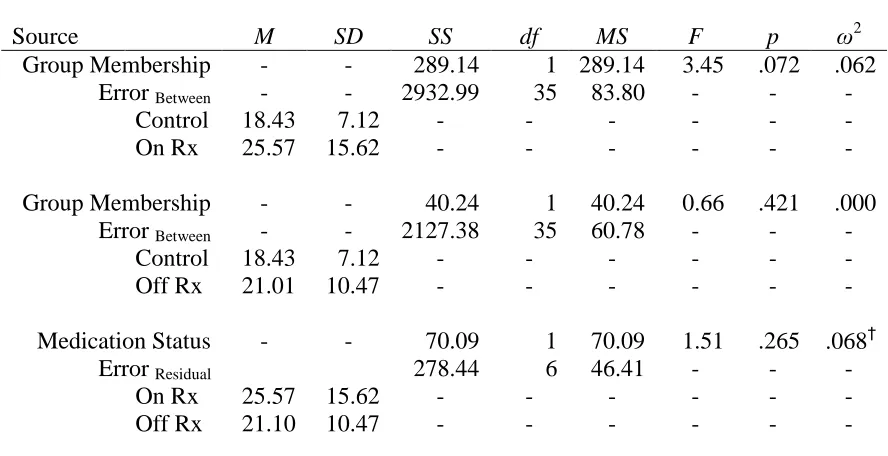
on fluency measures detected no statistically significant differences between control (M =
18.43, SD = 7.12) and clinical participants taking ADHD medication (M = 25.57, SD =
15.62), F(1, 35) = 3.45, p = .072, but did demonstrate a medium effect size, ω2 = .062.
This non-significant finding was consistent with previous research. Nonparametric
statistical analysis (i.e., the Mann-Whitney U Test) also indicated that this difference was
not statistically significant, p = .435, and that the null hypothesis should be retained. The
handwriting fluency scores of clinical participants off ADHD medication (M = 21.10, SD
= 10.47) compared to those of control participants (M = 18.43, SD = 7.12) were not
significantly different, F(1, 35) = 0.66, p = .421, and demonstrated an uninterpretable
effect size, ω2 = .000. Combined, these non-significant findings are consistent with
previous research.
A repeated measures One-Way ANOVA was used to examine automatized
handwriting fluency (i.e., NJ) of clinical participants taking ADHD medication versus
those same participants discontinuing their ADHD medication for 24 hours. The results
comparing the handwriting fluency of clinical participants on ADHD medication (M =
identify a statistically significant difference, F(1, 6) = 1.51, p = .265. This result is
consistent with previous findings in that handwriting fluency of clinical participants did
not differ significantly based on medication status. Although not a statistically
significant difference, a medium effect size was found, ω2partial = .068. See Table 8 for a
summary of automatized fluency results as well as source data for statistical comparisons
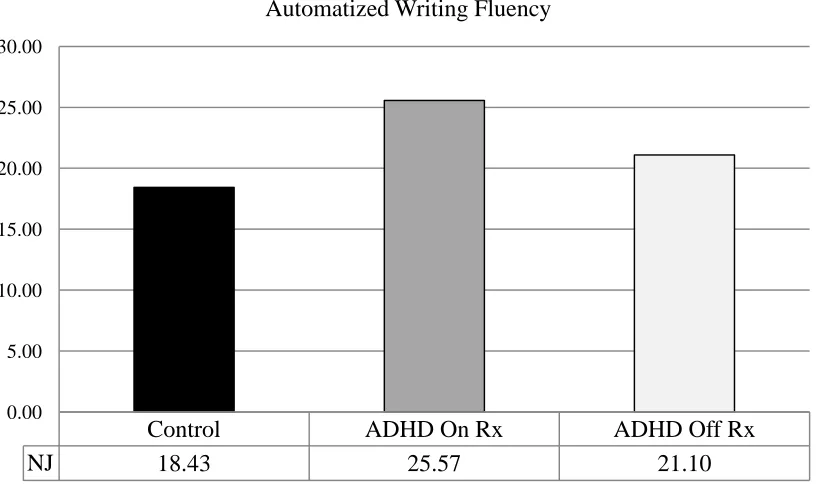
and Figure 3 for a graphical comparison of the automatized writing fluency of control
participants versus clinical participants both on and off ADHD medication.
Table 8
Automatized Writing Fluency – Summary and Source Table
Source M SD SS df MS F p ω2
Group Membership - - 289.14 1 289.14 3.45 .072 .062
Error Between - - 2932.99 35 83.80 - - -
Control 18.43 7.12 - - - -
On Rx 25.57 15.62 - - - -
Group Membership - - 40.24 1 40.24 0.66 .421 .000
Error Between - - 2127.38 35 60.78 - - -
Control 18.43 7.12 - - - -
Off Rx 21.01 10.47 - - - -
Medication Status - - 70.09 1 70.09 1.51 .265 .068†
Error Residual 278.44 6 46.41 - - -
On Rx 25.57 15.62 - - - -
Off Rx 21.10 10.47 - - - -
Note. On Rx = ADHD/Clinical participants on ADHD medication; Off Rx =
Figure 3. Automatized writing fluency of control and clinical participants. NJ = Normalized Jerk. Higher values of NJ indicate more dysfluent writing, whereas lower values of NJ indicate more fluent and automatized writing. ADHD On Rx =
ADHD/Clinical participants on ADHD medication; ADHD Off Rx = ADHD/Clinical participants off ADHD medication.
Variability of graphomotor performance. The alpha level was set at .05 to
indicate statistical significance for the following comparisons. A One-Way ANOVA was
used to analyze the kinematic variability of automatized handwriting performance (i.e.,
RPV) of healthy control participants with that of ADHD participants that discontinued
ADHD medication for 24 hours. No main effect was found related to group membership
and variability of graphomotor performance, F(1, 36) = 0.37, p = .545, and no
interpretable effect size was found, ω2 = .000, indicating that clinical participants not
taking ADHD medication (M = 0.12, SD = 0.06) demonstrated similar variability in
automatized graphomotor performance to control participants (M = 0.13, SD = 0.04). See
Table 9 for a summary of graphomotor variability findings as well as source information.
Control ADHD On Rx ADHD Off Rx
NJ 18.43 25.57 21.10
0.00 5.00 10.00 15.00 20.00 25.00 30.00