Adaptive Pattern Inference from System Logs
to Infer System Insights and User Behavior
Ashish Jadhav, Prof. Krishnamoorthy, Pradip Mukhopadhyay, N. Srinivas
M.Tech , Dept. of CSE, Vellore Institute of Technology, Vellore, India
Assistant Professor, Dept. of CSE, Vellore Institute of Technology, Vellore, India
Senior Engineer, NetApp Pvt. Ltd , India
Member of Technical Staff, NetApp Pvt. Ltd, India
ABSTRACT: In this era of post digitization organizations are generating, processing, and retaining data at a rate that often exceeds their ability to analyze it effectively; at the same time, the insights derived from these large data sets are often key to the success of the organizations, allowing them to better understand how to solve hard problems and thus gain competitive advantage. Here we are trying to use publicly available machine learning algorithms to analyze usage pattern of a general storage element manager. To infer system insights from the log, we are using industry standard open source elastic search to monitor and analyze user behavior. Using crowd sourcing as paradigm we are inferring useful information, which is a feedback to the system, to improve multiple aspects like usability, traceability, supportability. Thus, the novelty of the approach is, it is purely open source based and it can be generalized for any kind of log analysis and prediction.
KEYWORDS:Elastic search, Logstash, Kibana, Log Mining,
I. INTRODUCTION
First phase of SDLC (software development cycle) is requirement analysis i.e. to develop any software, first question to answer is what user is expecting from the product. Better we understand the requirements, better will be product. But requirements change over time. There’s often a disconnect between user’s expectation, what the engineering delivers and the way the product is used. The method proposed here, is one such attempt to minimize this disconnect. Product Managers hence have the onus on them to monitor usability and supportability aspects of the product and keep this feedback loop active. While there are traditional techniques like Brainstorming, Document Analysis, Focus Group, Interface Analysis, Interview, Observation, Prototyping, Requirements Workshop, Reverse Engineering, Survey etc. the proposal here is an automated approach to bridge this gap using the system logs. Proposed method is an approach for log analytics for achieving the same goal of inferring user behavior, i.e. trying to find out the answer for the question, how the user is using the product?
occurred while performing any action; and trying to analyze the reason behind the failure i.e. here we trying to find 0*1 (sequence of failures followed by a success).From this, we can figure out the reason behind frequent failure of workflows, which will provide recommendations that improves the value, support teams bring on to the table.
For log analysis, we are using combination of three open source tools; which are Elasticsearch, Logstash, Kibana, popularly known as ELK stack. Logstash is used as log parser which has some good features like some filters for log parsing has been provided implicitly we should use them wisely to get structured data from log. Whereas Elasticsearch is used as data store which has features like inbuild inverted indexing and it has very powerful full text search engine which will be useful for textual analysis. Kibana is used as visualizer which gives powerful yet simple features for plotting.
II. LITERATURESURVEY
[1]. Mining modern repositories with elastic search ( OleksiiKononenko-University of Waterloo, et al) this paper explains the usage of elastic search for development of a tool called DASH that allows Mozilla developers see the “live” picture of the patch review process. By switching to Elastic search, they have remarkably improved DASH’s performance which rendered the tool suitable for the real-time use
[2]. Feasibility analysis of big log data real time search based on HBase and Elastic Search (Jun Bai-Dept. of Mech. &Electr. Eng., et al) This paper presents a real-time big data search method: First, Flume agent from the end user's machine collect log events, then Elastic Search per the search conditions are needed row key list; finally, HBase using these row key directly from the database to get the data, the paper-based hardware to create a virtual machine environment, the experiment proved, with the search for more log events, the search response time does not increase linearly.
[3]. Indexing Linked Bibliographic Data with JSON-LD, BibJSON and Elastic search (Thomas Johnson) This paper presents a novel solution for representing and indexing bibliographic resources that retains the data integrity and extensibility of Linked Data while supporting fast, customizable indexes in an application-friendly data format. The methodology makes use of JSON-LD to represent RDF graphs in JSON suitable for indexing with Elastic search [4]. Substring filtering for low-cost Linked Data interfaces (Joachim Van Herwegen, et al) In this paper, they discuss the client/server setup and compare the performance of sparql queries on multiple implementations, including Elastic Search and case-insensitive fm-index. Their evaluations indicate that these improvements allow for faster query execution without significantly increasing the load on the server. Offering the substring feature on tpf servers allows users to obtain faster responses for filter-based sparql queries. Furthermore, substring matching can be used to support other filters such as complete regular expressions or range queries.
[5]. Influence Rank: A machine learning approach to measure influence of Twitter users (Ashish Nargundkar, Y. S. Rao) system comprises of a regression based machine learning approach with Influence Rank as the predictor variable against the set of proposed features.
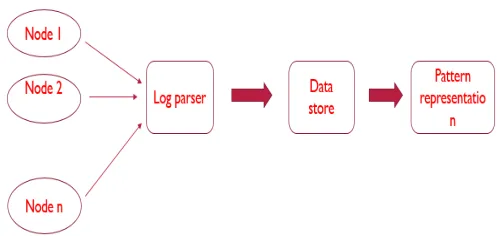
III.ARCHITECTURE
Log parser is central repository for capturing log from multiple nodes. This infrastructure can scale at run time. The log can be parsed with the help log parser, which includes custom parsers as well. And as logs are semi structured we can mould it into structured format by parsing tha log and extracting the only required portion from that and rest can purged out. Then parsed log can be fed to the data store, in our case we are using elasticsearch as data repository. Here we can query and obtain some assocition amoung data and and create multiple views of same schema, so that the data can be visualized from various dimensions. As elasticsearch has a web based application for visualization i.e kibana, where one can pivot the data in all possible ways and represent obtained knowledge by drawing various charts like pie chart, stack chart, histrogram etc. Once the obtained knowledge is represented in charts one can eaasily do statastical anlysis on the parsed data and conclude the analysis. In kibana one can export the result in the from of excel sheet also.
IV.WORKFLOW
STEP 1: Collect log in Debug mode from multiple clients and feed it to Logstash. STEP 2: Write config file for parsing in Logstash
STEP 3: As Logstash has predefined filters which are useful for standard logs like apache etc. so for more refining we should write customized parser to tune semi structured data to structured data.
STEP 4: Create a timeline so that it will be easy to track clients sequence of actions
STEP 5: Create a schema which gives structured information about all API calls, what inputs are passed to those API and result status of API call i.e. whether PASS or FAIL
STEP 6: From timeline, group all possible API calls together to form a transaction and run some association rule mining algorithm, such as FP_GROWTH to get all API’s which occurring together in a single action performed STEP 7: From timeline, find out all API calls with status as failed and find out all possible workflows which includes failed API calls.
STEP 8: Create a schema for failed workflows with their result status vector. STEP 9: Push all schema created to Elasticsearch.
V.METHODOLOGY
STEP 1: Create a table-1
Seq. No
API Total Input Result
Status
Response time
1
Get-API-A
Aa=2; Ab=2; Ac=3;
Passed 230ms
2
Create-A
A-name=abc; a-set=3; a-max=10;
Failed 94ms
3
Get-API-B
Ba=5; Bb=10; Bc=10;
passed 400ms
. . . . .
n
Get-API-Z
Za=3; Zb=4; Zc=10;
Passed 380ms
STEP 2: From table-1 find out
a. Which APIs are called frequently.
b. For each API find out frequency of their attributes occurrence and value assigned to that attribute.
STEP 3: If
frequency of occurrence of a value for an attribute >= threshold value (70%).Then, set that value of attribute as a default value in UI.
STEP 4: Find out most commonly called group of API’s which are called together:
a. from table-1 create transactions of length 3 to 9 for API’s called in sequential order.
b. run any association rule mining algorithm on those transactions like FP-growth and get combination of API’s which are called together.
STEP 5: Create Table-2
Comb. No
Combination of API’s
Frequency length validity
1 Get-API-A,
Create-B, Update-A;
10 3 valid
2 Get-API-B,
Create-A, Update-C, Delete-D, Create-E
5 5 Invalid
STEP 6: If,
API.result _status == failed Then,
STEP 7: From the list of failed API’s create table-3
STEP 8: From table -2 and table-3 find out the combination which contains failed API’s
STEP 9: Find most frequently failed workflows with the reason and find out reason behind failure of workflows
VI.CONCLUSION
The main objectives of the paper were usability and supportability which have been hence achieved.
Usability was achieved by analyzing the user logs and finding out which options/fields the user frequently makes use of.
These options were smart defaulted in the GUI thus surging the usability.
In addition to this, user time spent on each page was analyzed and these frequently used pages were cached so that it becomes easier for the user to access them.
These frequently used pages could also be added as shortcuts on the UI.
Also, supportability was achieved by analyzing frequently failing workflows and reasoning out the cause of the failure. These reasons were notified to the user so that the user avoids the failed workflows in the future.
REFFERNCES
[1].Pinjia He; Jieming Zhu; Shilin He; Jian Li; Michael R. Lyu “An Evaluation Study on Log Parsing and Its Use in Log Mining” 2016 46th Annual IEEE/IFIP International Conference on Dependable Systems and Networks (DSN)
[2]. PrernaJuneja; DivyaKundra; Ashish Sureka “Anvaya: An Algorithm and Case-Study on Improving the Goodness of Software Process Models Generated by Mining Event-Log Data in Issue Tracking Systems” 2016 IEEE 40th Annual Computer Software and Applications Conference (COMPSAC)
[3]. OleksiiKononenko-University of Waterloo, CanadaOlgaBaysal-University of Waterloo, CanadaReid Holmes-University of Waterloo, CanadaMichael W. Godfrey-University of Waterloo, Canada ,” Mining modern repositories with elastic search
[4]. Jun Bai-Dept. of Mech. &Electr. Eng., Northern BeiJing Vocational Educ. Inst., Beijing, China “ Feasibility analysis of big log data real time search based on HBase and Elastic Search” ICSE Companion 2014, pp. 344-353, 2014.
[5]. Thomas Johnson “Indexing Linked Bibliographic Data with JSON-LD, BibJSON and Elasticsearch5.Substring filtering for low-cost Linked Data interfaces
[6]. Influence Rank: A machine learning approach to measure influence of Twitter users(Ashish Nargundkar, Y. S. Rao)
[7]. M. Mittal, A. Sureka, "Process mining software repositories from student projects in an undergraduate software engineering course", Companion Proceedings of the 36th International Conference on Software Engineering ser. ICSE Companion 2014, pp. 344-353, 2014.
[8]. M. Gupta, A. Sureka, "Process cube for software defect resolution", Proceedings of the 2014 21st Asia-Pacific Software Engineering Conference, vol. 01, pp. 239-246, 2014
[9]. R. K. L. Ko, S. S. Lee, V. Rajan, "Understanding cloud failures" in Spectrum, vol. 49, no. 12, pp. 84-84, December 2012, IEEE.
[10]. R. K. L. Ko, M. A. Will, "Progger: A Efficient Tamper-Evident Kernel-Space Logger for Cloud Data Provenance Tracking", Proceedings of the 7th IEEE International Conference on Cloud Computing (CLOUD'14), June 2014.
[11]. H. Mi, H. Wang, Y. Zhou, R. Lyu, H. Cai, "Toward fine-grained unsupervised scalable performance diagnosis for production cloud computing systems", IEEE Transactions on Parallel and Distributed Systems, vol. 24, pp. 1245-1255, 2013.
Sr.no API-name Reason of
failure
Frequency
1 API-D Entry doesn’t
found
3
2 API-F Doesn’t support
protocol
2