University of Windsor University of Windsor
Scholarship at UWindsor
Scholarship at UWindsor
Electronic Theses and Dissertations Theses, Dissertations, and Major Papers
2014
Simulation of Electrohydraulic Forming Using Anisotropic,
Simulation of Electrohydraulic Forming Using Anisotropic,
Rate-dependent Plasticity Models
dependent Plasticity Models
Amir Hassannejadasl
University of Windsor
Follow this and additional works at: https://scholar.uwindsor.ca/etd
Recommended Citation Recommended Citation
Hassannejadasl, Amir, "Simulation of Electrohydraulic Forming Using Anisotropic, Rate-dependent Plasticity Models" (2014). Electronic Theses and Dissertations. 5205.
https://scholar.uwindsor.ca/etd/5205
This online database contains the full-text of PhD dissertations and Masters’ theses of University of Windsor students from 1954 forward. These documents are made available for personal study and research purposes only, in accordance with the Canadian Copyright Act and the Creative Commons license—CC BY-NC-ND (Attribution, Non-Commercial, No Derivative Works). Under this license, works must always be attributed to the copyright holder (original author), cannot be used for any commercial purposes, and may not be altered. Any other use would require the permission of the copyright holder. Students may inquire about withdrawing their dissertation and/or thesis from this database. For additional inquiries, please contact the repository administrator via email
Simulation of Electrohydraulic Forming Using
Anisotropic, Rate-dependent Plasticity Models
by
Amir Hassannejadasl
A Dissertation
Submitted to the Faculty of Graduate Studies
through the Department of Mechanical, Automotive & Materials Engineering in Partial Fulfillment of the Requirements for
the Degree of Doctor of Philosophy at the University of Windsor
Windsor, Ontario, Canada 2014
ii
Simulation of Electrohydraulic Forming Using Anisotropic,
Rate-dependent Plasticity Models
by
Amir Hassannejadasl
APPROVED BY:
___________________________________________ Dr. P.D. Wu, External Examiner
McMaster University
______________________________________________ Dr. S.F. Golovashchenko, Industrial Advisor Ford Research & Advanced Engineering, Dearborn, MI
______________________________________________ Dr. S. Cheng
Department of Civil and Environmental Engineering
______________________________________________ Dr. N. Zamani
Department of Mechanical, Automotive & Materials Engineering
______________________________________________ Dr. W. Altenhof
Department of Mechanical, Automotive & Materials Engineering
______________________________________________ Dr. D.E. Green, Advisor
Department of Mechanical, Automotive & Materials Engineering
iii
Declaration of Previous Publication
This dissertation includes one original paper that will be published in the proceedings of the ICTP2014 conference (Nagoya, Japan). Two journal papers were written and are ready to be submitted for publication. However, due to co-authorship limitation and requirements, these papers are on hold at the present time and they will be submitted as soon as the other partner of this project (University of Waterloo) receives their final publication approval.
Thesis Chapter Publication title/full citation Publication status
Chapter 4 Prediction of DP600 flow surfaces at various strain-rates using Yld2004-18p yield function
“accepted for Publication”
I certify that I have obtained a written permission (Appendix-A3) from the copyright
owner(s) to include the above published material in my dissertation. I certify that the above material describes work completed during my registration as graduate student at the University of Windsor.
I declare that, to the best of my knowledge, my dissertation does not infringe upon anyone’s copyright nor violate any proprietary rights and that any ideas, techniques,
quotations, or any other material from the work of other people included in my dissertation, published or otherwise, are fully acknowledged in accordance with the standard referencing practices. Furthermore, to the extent that I have included copyrighted material that surpasses the bounds of fair dealing within the meaning of the Canada Copyright Act, I certify that I have obtained a written permission from the copyright owner(s) to include such material(s) in my dissertation.
iv
Abstract
Electrohydraulic forming (EHF) is a pulsed forming process in which two or more electrodes
are positioned in a chamber filled with a liquid and a high-voltage discharge between the
electrodes generates a high-pressure to form the sheet. Deformation history of a sheet material in
EHF process shows substantial changes in the strain rate of the material during the forming
process. In this research, the mechanical properties of DP600, TRIP780, and AA5182-O were
obtained at different strain rates. Uniaxial tensile tests showed significant strain-rate sensitivity in
all three material orientations (RD, DD, and TD) for DP600 and TRIP780. In contrast,
AA5182-O exhibits almost near-zero strain-rate sensitivity. Several anisotropic yield functions were
calibrated at various strain rates to evaluate the effect of strain rate on the flow surface shape. By
comparing the quasistatic and updated flow surfaces of DP600 and TRIP780 predicted by
Yld2000-2d, results show a relatively considerable effect of updating anisotropy coefficients for
higher strain rates ( ).
Several rate-dependent anisotropic material models (plane stress and general) were developed,
by combining updated anisotropic yield functions and a rate-dependent hardening model (KHL).
The developed models were implemented as user-defined material subroutines (VUMATs) based
on implicit stress integration algorithm for ABAQUS/Explicit code to simulate electrohydraulic
free-forming (EHFF) and die-forming (EHDF) processes. EHF simulations were completed,
using Eulerian elements and ignition-and-growth model. The EHFF process was simulated for
four different geometries (representing four different strain paths). Also, the EHDF process was
simulated using a conical die The EHFF simulation results for the DP600 biaxial specimen
showed that von Mises predicts a maximum effective plastic strain around greater than
Yld2000-2d for the same amount of applied energy.
The EHDF simulation result for DP600 showed that with the same applied energy magnitude,
von Mises overpredicts major, minor and through-thickness shear strains and consequently effective plastic strain ( higher) compared to Yld2004-18p. Results showed that of the
effective plastic strain occurs under a proportional biaxial strain path before contacting the die.
Also, results showed that von Mises overpredicts maximum absolute compressive
v
Acknowledgements
I would like to acknowledge my dear advisor, Dr. Daniel Green who substantially helped and guided me to complete this work. Dr. Green; I would like to say it was a great opportunity for me to work with you and I really appreciate all your great support throughout the duration of this work.
I would also like to express my gratitude to my best friend/colleague, Chris Maris for his kind and unbelievable support and assistance. Chris; I was very lucky to have such a nice and mature friend as at the desk next to mine.
I would like to express my appreciation to Dr. Sergey Golovashchenko who technically guided me during this project. His expertise and knowledge was really amazing and I learnt a lot from him.
I would also like to thank my favorite professor, Dr. William Altenhof, who always generously contributed his exceptional knowledge and expertise to me and our team.
vi
Table of Contents
Declaration of Previous Publication ... iii
Abstract ... iv
Acknowledgements ... v
List of Tables ... x
List of Figures ... xii
1 Introduction ... 1
2 Literature Review ... 7
2.1 Introduction ... 7
2.2 High speed metal forming ... 8
2.2.1 High strain rate metal forming processes ... 8
2.2.2 Electrohydraulic forming (EHF) ... 11
2.3 Constitutive model ... 15
2.3.1 Anisotropic yield functions ... 16
2.3.2 Flow rule ... 24
2.3.3 Rate-dependent hardening models ... 26
2.4 Experiments; high strain rate tests ... 31
3 Rate-dependent Constitutive Model ... 35
3.1 Anisotropic yield functions ... 35
3.1.1 Hill 1948 (Hill48) ... 35
3.1.2 Hill 1990 (Hill90) ... 37
3.1.3 Barlat 1989 (Barlat89) ... 39
3.1.4 Barlat 1996 (Yld96) ... 40
3.1.5 Barlat 2003 (Yld2000-2d) ... 42
3.1.6 Barlat 2005 (Yld2004-18p) ... 44
3.2 Experimental work ... 47
3.2.1 Sheet materials ... 47
3.2.2 Quasi-static, intermediate and high strain rate tests ... 48
vii
3.3 Anisotropy coefficients ... 61
3.3.1 Evolution of flow stresses ... 61
3.3.2 Calculation of biaxial flow stress at higher strain rates ... 67
3.3.3 Determination of anisotropy coefficients for different yield functions ... 72
3.3.4 Updating Yld2000-2d anisotropy coefficients w.r.t. strain rate ... 85
3.4 Rate-dependent hardening models ... 88
3.4.1 Johnson-Cook (JC) ... 88
3.4.2 Khan-Huang-Liang (KHL) ... 89
3.4.3 Surajit Kumar Paul (SKP) ... 90
3.5 Determination of constants for different hardening models ... 91
4 Effect of Updating Anisotropy Coefficients on the Flow Surface ... 97
4.1 Planar Distribution of Anisotropic Data (uniaxial flow stress and r-value) ... 97
4.1.1 Uniaxial Anisotropic Data Formulation ... 100
4.1.2 Predicted Anisotropic Data (flow stress and r-value) ... 106
4.2 Effect of Updating Anisotropy Coefficients on the Flow Surface ... 119
4.2.1 Comparison between the Updated and Quasistatic Yld2000-2d ... 120
4.2.2 Comparison between the Updated and Quasistatic Hill48-r.value ... 121
4.2.3 Comparison between the Updated Hill`s family and Updated Barlat`s family 121 4.2.4 Comparison between the Updated Yld2000-2d and von Mises ... 123
4.2.5 Comparison between the Updated and Quasistatic Yld2000-2d at different levels of normalized shear stress ... 124
5 Rate-dependent Implicit Stress Integration Scheme ... 144
5.1 Introduction ... 144
5.2 Stress Integration ... 146
5.2.1 Derivatives of Hardening Functions ... 153
5.2.2 Derivatives of Yield Functions ... 156
5.3 Transverse Shear Stiffness... 160
5.4 Verification of the User Material Subroutine (VUMAT) ... 161
5.4.1 Uniaxial tension at various strain rates ... 162
5.4.2 Biaxial loading at various strain rates ... 164
viii
5.4.4 Combined tension-shear ... 168
6 Finite Element Simulation of Electrohydraulic Forming ... 171
6.1 Introduction ... 171
6.2 Experimental work ... 172
6.2.1 EHF Tooling ... 173
6.2.2 Sheet material, geometry and preparation ... 175
6.2.3 Deformed EHF Specimens... 177
6.2.4 Strain measurements ... 178
6.3 Finite element modelling ... 179
6.3.1 Single element model ... 179
6.3.2 EHF model ... 179
6.4 Results and Discussion ... 189
6.4.1 Single element results ... 189
6.4.2 EHFF Results and discussion ... 196
6.4.3 EHDF Results ... 222
6.4.4 Experimental and numerical energy ... 230
6.4.5 Computation time ... 232
7 Overall Summary and Conclusions ... 234
7.1 Summary ... 234
7.2 Conclusions ... 235
7.2.1 Material characterization tests ... 235
7.2.2 Yield function and hardening model calibration ... 236
7.2.3 Effect of Updating anisotropy coefficients on the flow surface ... 236
7.2.4 Finite element simulation ... 237
7.3 Recommendations for selecting an appropriate constitutive model for DP600, TRIP780 and AA5182-O ... 240
7.4 Future work... 242
ix
Appendices ... 253
A1. Anisotropy coefficients identification of Yld2004-18p ... 253
A2. Implicit integration algorithm for implementation of rate-dependent hardening model (VUMAT) ... 255
x
List of Tables
Table 2.1 Mathematical formulation of phenomenological rate-dependent hardening
models ... 29
Table 3.1. Chemical composition of DP600, TRIP780, and AA5182-O ... 47
Table 3.2. DP600 input data at various strain rates; for calibration of different yield functions ... 74
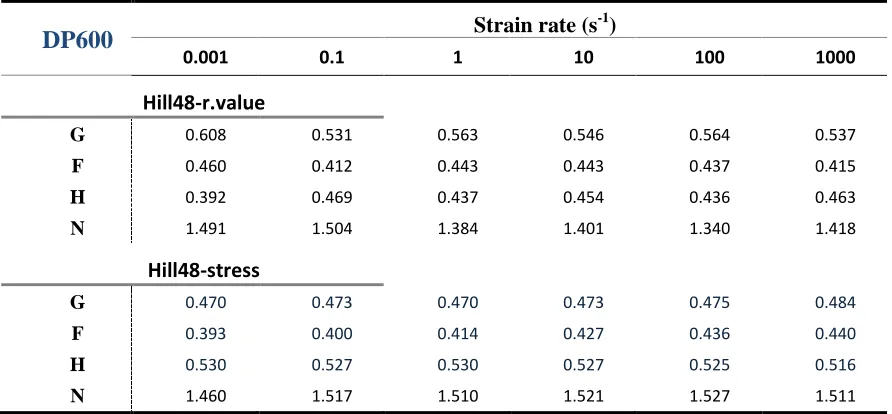
Table 3.3. Hill48 coefficients for DP600 at various strain rates ... 74
Table 3.4. Hill90 coefficients for DP600 at various strain rates ... 75
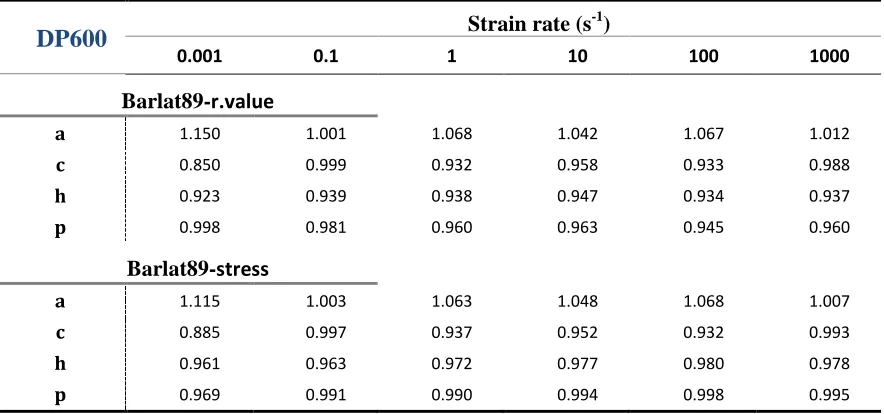
Table 3.5. Barlat89 coefficients for DP600 at various strain rates (exponent a = 6) ... 75
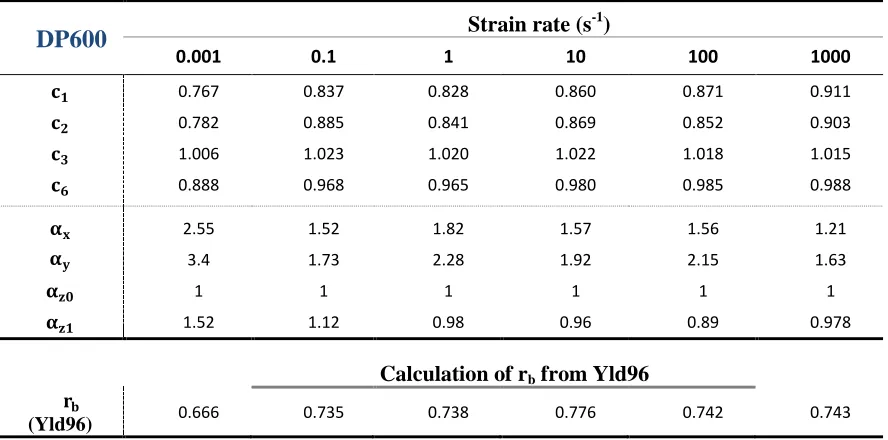
Table 3.6. Yld96 coefficients for DP600 at various strain rates (exponent a = 6)... 76
Table 3.7. Yld2000-2d coefficients for DP600 at various strain rates (exponent a = 6) .. 76
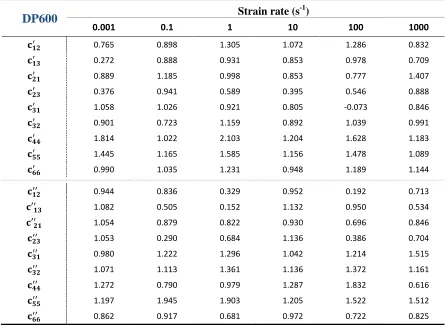
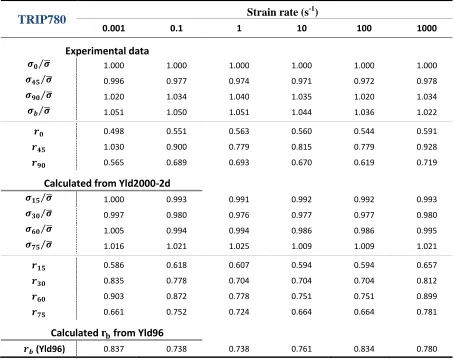
Table 3.8. Yld2004-18P coefficients for DP600 at various strain rates (exponent a = 6) 77 Table 3.9. TRIP780 input data at various strain rates; for calibration of different yield functions ... 78
Table 3.10. Hill48 coefficients for TRIP780 at various strain rates ... 78
Table 3.11. Hill90 coefficients for TRIP780 at various strain rates ... 79
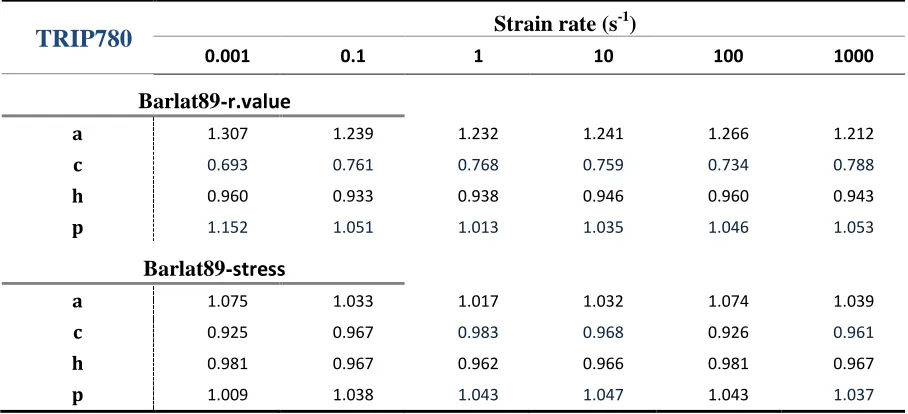
Table 3.12. Barlat89 coefficients for TRIP780 at various strain rates (exponent a = 6) .. 79
Table 3.13. Yld96 coefficients for TRIP780 at various strain rates (exponent a = 6) ... 80
Table 3.14. Yld2000-2d coefficients for TRIP780 at various strain rates (exponent a = 6) ... 80
Table 3.15. Yld2004-18P coefficients for TRIP780 at various strain rates (exponent a = 6) ... 81
Table 3.16. AA5182 input data at various strain rates; for calibration of different yield functions ... 82
Table 3.17. Hill48 coefficients for AA5182-O at various strain rates ... 82
Table 3.18. Hill90 coefficients for AA5182-O at various strain rates ... 83
xi
Table 3.20. Yld96 coefficients for AA5182-O at various strain rates (exponent a = 8) ... 84
Table 3.21. Yld2000-2d coefficients for AA5182-O at various strain rates (exponent a = 8) ... 84
Table 3.22. Yld2004-18P coefficients for AA5182-O at various strain rates (exponent a = 8) ... 85
Table 3.23. 4th-order equations fitted toYld2000-2d coefficients for DP600 ... 87
Table 3.24. 4th-order equations fitted toYld2000-2d coefficients for TRIP780 ... 87
Table 3.25. 4th-order equations fitted toYld2000-2d coefficients for AA5182-O ... 87
Table 3.26. Constants in the JC hardening model for DP600, TRIP780, and AA5182-O 91 Table 3.27. Constants in the KHL hardening model for DP600, TRIP780, and AA5182-O ... 92
Table 3.28. Constants in the SKP hardening model for DP600, TRIP780, and AA5182-O ... 92
Table 6.1. Ignition-and-growth parameters for Comp-B ... 184
Table 6.2. DP600 experimental and numerical input energy ... 232
xii
List of Figures
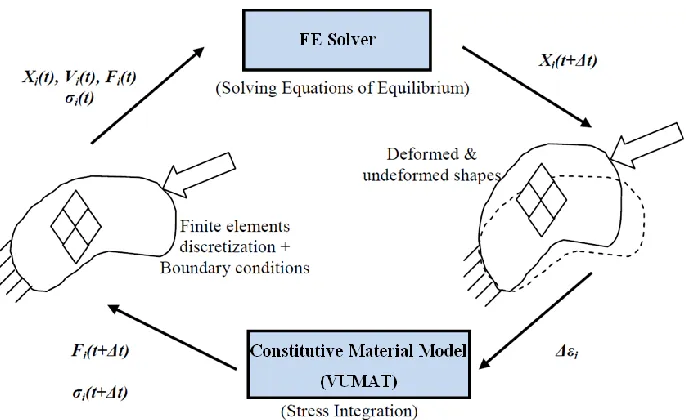
Figure 1-1 Role of constitutive material model in nonlinear FE analysis ... 2
Figure 2-1 Schematic of EHF process and related tools ... 12
Figure 2-2. Schematic of flow curves at quasi-static and high strain rate regimes ... 28
Figure 3-1 a) ASTM-E8 and b) miniature dog-bone specimen geometries (mm), (Rahmaan et al., 2014) ... 48
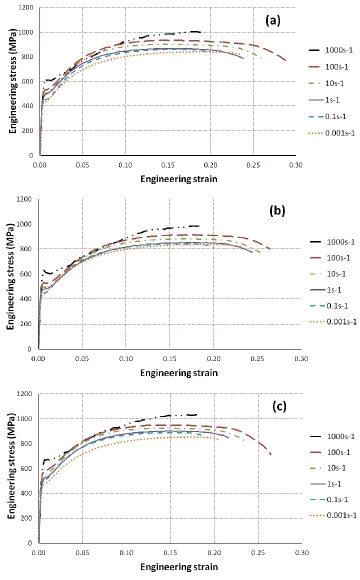
Figure 3-2 DP600 engineering stress-strain curves at various strain rates in; a) RD b) DD c) TD ... 50
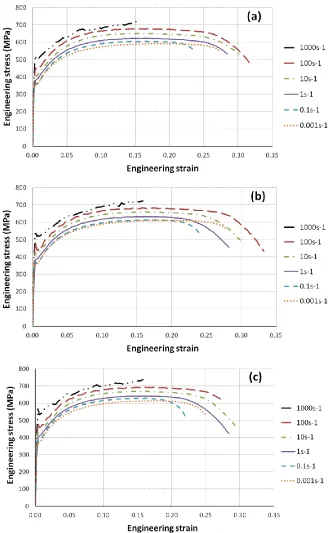
Figure 3-3 TRIP780 engineering stress-strain curves at various strain rates in; a) RD b) DD c) TD ... 51
Figure 3-4 AA5182-O engineering stress-strain curves at various strain rates in; a) RD b) DD c) TD ... 52
Figure 3-5 DP600 true stress versus effective plastic strain curves obtained at various strain rates in RD, DD, and TD ... 53
Figure 3-6. TRIP780 true stress versus effective plastic strain curves obtained at various strain rates in RD, DD, and TD ... 54
Figure 3-7. AA5182-O true stress versus effective plastic strain curves obtained at various strain rates in RD, DD, and TD ... 55
Figure 3-8. Biaxial and uniaxial true stress versus effective plastic strain curves at
- for a) DP600 b) TRIP780 c) AA5182-O ... 56
Figure 3-9. DP600 width versus longitudinal true strain curves obtained from uniaxial tension in RD, DD and TD at various strain rates ... 58
Figure 3-10. TRIP780 width versus longitudinal true strain curves obtained from uniaxial tension in RD, DD and TD at various strain rates ... 59
Figure 3-11. AA5182-O width versus longitudinal true strain curves obtained from uniaxial tension in RD, DD and TD at various strain rates ... 60
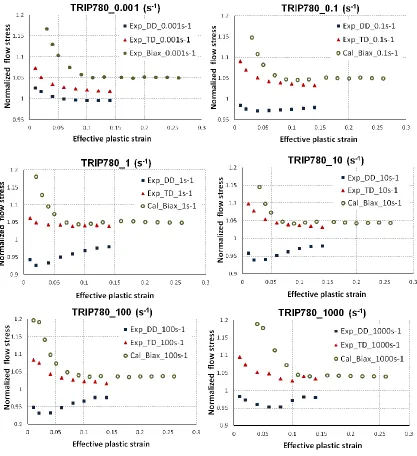
Figure 3-12. Evolution of DP600 uniaxial and biaxial flow stresses normalized to the uniaxial flow stress in the RD at various strain rates ... 64
xiii
Figure 3-14. Evolution of AA5182-O uniaxial and biaxial flow stresses normalized to the
uniaxial flow stress in the RD at various strain rates ... 66
Figure 3-15. Calculation of DP600 biaxial flow curves at strain rates of - ... 69
Figure 3-16. Calculation of TRIP780 biaxial flow curves at strain rates of - ... 70
Figure 3-17. Calculation of AA5182-O biaxial flow curves at strain rates of - ... 71
Figure 3-18. Anisotropy variation w.r.t. strain rate for DP600; a) normalized flow stress b) r-value ... 72
Figure 3-19. Anisotropy variation w.r.t. strain rate for TRIP780; a) normalized flow stress b) r-value ... 72
Figure 3-20. Anisotropy variation w.r.t. strain rate for AA5182-O; a) normalized flow stress b) r-value ... 73
Figure 3.21. Variation of Yld2000-2d anisotropy coefficients w.r.t. strain rate for DP600 ... 86
Figure 3.22. Variation of Yld2000-2d anisotropy coefficients w.r.t. strain rate for TRIP780 ... 86
Figure 3.23. Variation of Yld2000-2d anisotropy coefficients w.r.t. strain rate for AA5182-O... 86
Figure 3-24. Flow curves predicted by JC, KHL, and SKP models for DP600 ... 94
Figure 3-25. Flow curves predicted by JC, KHL, and SKP models for TRIP780 ... 95
Figure 3-26. Flow curves predicted by JC, KHL, and SKP models for AA5182-O ... 96
Figure 4-1. Orthotropy axes of the rolled sheet metals ... 97
Figure 4-2. a) Uniaxial flow stress corresponding to a direction in the plane of the sheet metal, b) Tensile specimen extracted at the angle ; measured from the rolling direction ... 98
Figure 4-3. Measured and predicted anisotropy of the flow stress and the r-value; for DP600 at - ... 109
xiv
Figure 4-5. Measured and predicted anisotropy of the flow stress and the r-value; for DP600 at - ... 110
Figure 4-6 Measured and predicted anisotropy of the flow stress and the r-value; for DP600 at - ... 110
Figure 4-7 Measured and predicted anisotropy of the flow stress and the r-value; for DP600 at - ... 111
Figure 4-8 Measured and predicted anisotropy of the flow stress and the r-value; for DP600 at - ... 111
Figure 4-9 Measured and predicted anisotropy of the flow stress and the r-value; for TRIP780 at - ... 112
Figure 4-10 Measured and predicted anisotropy of the flow stress and the r-value; for TRIP780 at - ... 112
Figure 4-11 Measured and predicted anisotropy of the flow stress and the r-value; for TRIP780 at - ... 113
Figure 4-12 Measured and predicted anisotropy of the flow stress and the r-value; for TRIP780 at - ... 113
Figure 4-13 Measured and predicted anisotropy of the flow stress and the r-value; for TRIP780 at - ... 114
Figure 4-14 Measured and predicted anisotropy of the flow stress and the r-value; for TRIP780 at - ... 114
Figure 4-15 Measured and predicted anisotropy of the flow stress and the r-value; for AA5182-O at - ... 115
Figure 4-16 Measured and predicted anisotropy of the flow stress and the r-value; for AA5182-O at - ... 115
Figure 4-17 Measured and predicted anisotropy of the flow stress and the r-value; for AA5182-O at - ... 116
Figure 4-18 Measured and predicted anisotropy of the flow stress and the r-value; for AA5182-O at - ... 116
xv
Figure 4-20 Measured and predicted anisotropy of the flow stress and the r-value; for AA5182-O at - ... 117
Figure 4-21 Anisotropy variation for DP600 as predicted by Yld2000-2d at various strain rates; a) normalized flow stress b) r-value ... 118
Figure 4-22 Anisotropy variation for TRIP780 as predicted by Yld2000-2d at various strain rates; a) normalized flow stress b) r-value ... 119
Figure 4-23 Anisotropy variation for AA5182-O as predicted by Yld2000-2d at various strain rates; a) normalized flow stress b) r-value ... 119
Figure 4-24 Flow surface for DP600 predicted by Yld2000-2d at various strain rates; using initial and updated anisotropy coefficients... 126
Figure 4-25 Flow surface for TRIP780 predicted by Yld2000-2d at various strain rates; using initial and updated anisotropy coefficients... 127
Figure 4-26 Flow surface for AA5182-O predicted by Yld2000-2d at various strain rates; using initial and updated anisotropy coefficients... 128
Figure 4-27 Flow surface for DP600 predicted by Hill48.r-value at various strain rates; using initial and updated anisotropy coefficients... 129
Figure 4-28 Flow surface for TRIP780 predicted by Hill48.r-value at various strain rates; using initial and updated anisotropy coefficients... 130
Figure 4-29 Flow surface for AA5182-O predicted by Hill48.r-value at various strain rates; using initial and updated anisotropy coefficients ... 131
Figure 4-30 Comparison between the flow surfaces for DP600 predicted by Hill`s and Barlat`s families at various strain rates; using updated anisotropy coefficients ... 133
Figure 4-31 Comparison between the flow surfaces for TRIP780 predicted by Hill`s and Barlat`s families at various strain rates; using updated anisotropy coefficients ... 135
Figure 4-32 Comparison between the flow surfaces for AA5182-O predicted by Hill`s and Barlat`s families at various strain rates; using updated anisotropy coefficients ... 137
Figure 4-33 Comparison between the flow surfaces for DP600 predicted by Yld2000-2d and von Mises at various strain rates; using updated anisotropy coefficients for Yld2000-2d... 138
Figure 4-34 Comparison between the flow surfaces for TRIP780 predicted by Yld2000-2d and von Mises at various strain rates; using updated anisotropy coefficients for
xvi
Figure 4-35 Comparison between the flow surfaces for AA5182-O predicted by Yld2000-2d and von Mises at various strain rates; using updated anisotropy coefficients for
Yld2000-2d ... 140
Figure 4-36 Flow surfaces for DP600 predicted by Yld2000-2d with contours of normalized shear stress in 0.1 increments from 0 to 0.5 at various strain rates; using initial and updated anisotropy coefficients ... 141
Figure 4-37 Flow surfaces for TRIP780 predicted by Yld2000-2d with contours of normalized shear stress in 0.1 increments from 0 to 0.5 at various strain rates; using initial and updated anisotropy coefficients ... 142
Figure 4-38 Flow surfaces for AA5182-O predicted by Yld2000-2d with contours of normalized shear stress in 0.1 increments from 0 to 0.5 at various strain rates; using initial and updated anisotropy coefficients ... 143
Figure 5-1 Schematic of a multi-steps return mapping procedure for AFR in the 2D stress space ... 151
Figure 5-2. Schematic of the single element model for the uniaxial tension in a) RD b) TD ... 163
Figure 5-3. Comparison between experimental and predicted DP600 uniaxial flow
curves; at various strain rates, a) RD b) TD... 164
Figure 5-4. Schematic of the single element model for biaxial tension... 165
Figure 5-5 Comparison between experimental and predicted DP600 biaxial flow curves; at various strain rates ... 165
Figure 5-6. Comparison between experimental and predicted uniaxial and biaxial DP600 flow curves; a) - b) - c) - ... 166
Figure 5-7. Schematic of the cantilever beam model ... 167
Figure 5-8. Effective stress variation along the top surface of a DP600 beam ... 168
Figure 5-9. Effective stress contours in the deformed DP600 beam; a) VUMAT,
b)ABAQUS built-in material model ... 168
Figure 5-10. Schematic of the combined tension-shear model ... 169
Figure 5-11. Comparison between the predicted flow stresses obtained by the VUMAT and the ABAQUS built-in material model; at two different sets of velocities ... 169
xvii
Figure 6-2. Different geometries of specimens used in EHFF; a) uniaxial b) intermediate draw c) plane strain d) biaxial ... 177
Figure 6-3. Safe EHFF specimens for DP600 (top) and AA5182-O (bottom); a) uniaxial b) intermediate draw c) plane strain d) biaxial ... 178
Figure 6-4. Safe EHDF DP600 specimen ... 178
Figure 6-5. Mechanism of shockwave generation by; a) underwater electrical discharge b) UNDEX ... 181
Figure 6-6. Section-view of the EHF finite element model; a) EHFF b) EHDF ... 182
Figure 6-7. Predicted effective plastic strain for DP600 using Yld2000-2d and von Mises yield functions; a) biaxial, b) plane strain, and c) relative error ... 190
Figure 6-8. Predicted effective plastic strain for DP600 using Yld2000-2d and Hill48 yield functions; a) biaxial, b) plane strain and c) relative error ... 191
Figure 6-9 Predicted effective plastic strain for TRIP780 using Yld2000-2d and von Mises yield functions; a) biaxial, b) plane strain and c) relative error ... 192
Figure 6-10. Predicted effective plastic strain for TRIP780 using Yld2000-2d and Hill48 yield functions; a) biaxial, b) plane strain and c) relative error ... 193
Figure 6-11. Predicted effective plastic strain for AA5182-O using Yld2000-2d and von Mises yield functions; a) biaxial, b) plane strain and c) relative error ... 194
Figure 6-12. Predicted effective plastic strain for AA5182-O using Yld2000-2d and Hill48 yield functions; a) biaxial, b) plane strain and c) relative error ... 195
Figure 6-13. Measured and predicted data for DP600 uniaxial EHFF specimen; a) major strain, b) minor strain, c) thickness and d) height ... 198
Figure 6-14 Measured strain distribution and predicted strain path for an element at the centre of the gauge section for DP600 uniaxial EHFF specimen ... 199
Figure 6-15. Effective plastic strain and effective strain rate histories for an element at the centre of the DP600 uniaxial EHFF specimen ... 199
Figure 6-16. Measured and predicted data for AA5182-O uniaxial EHFF specimen; a) major strain, b) minor strain, c) thickness and d) height ... 201
Figure 6-17. Measured strain distribution and predicted strain path for an element at the centre of the gauge section for AA5182-O uniaxial EHFF specimen ... 202
xviii
Figure 6-19. Measured and predicted data for DP600 intermediate draw EHFF specimen; a) major strain, b) minor strain, c) thickness and d) height ... 204
Figure 6-20. Measured strain distribution and predicted strain path for an element at the centre of the gauge section for DP600 intermediate draw EHFF specimen ... 205
Figure 6-21. Effective plastic strain and effective strain rate histories for an element at the centre of the DP600 intermediate draw EHFF specimen... 205
Figure 6-22. Measured and predicted data for AA5182-O intermediate draw EHFF
specimen; a) major strain, b) minor strain, c) thickness and d) height ... 207
Figure 6-23. Measured strain distribution and predicted strain path for an element at the centre of the gauge section for AA5182-O intermediate draw EHFF specimen ... 208
Figure 6-24. Effective plastic strain and effective strain rate histories for an element at the centre of the AA5182-O intermediate draw EHFF specimen ... 208
Figure 6-25. Measured and predicted data for DP600 plane strain EHFF specimen; a) major strain, b) minor strain, c) thickness and d) height ... 210
Figure 6-26. Measured strain distribution and predicted strain path for an element at the centre of the gauge section for DP600 plane strain EHFF specimen ... 211
Figure 6-27. Effective plastic strain and effective strain rate histories for an element at the centre of the DP600 plane strain EHFF specimen ... 211
Figure 6-28. Measured and predicted data for AA5182-O plane strain EHFF specimen; a) major strain, b) minor strain, c) thickness and d) height ... 214
Figure 6-29. Measured strain distribution and predicted strain path for an element at the centre of the gauge section for AA5182-O plane strain EHFF specimen... 215
Figure 6-30. Effective plastic strain and effective strain rate histories for an element at the centre of the AA5182-O plane strain EHFF specimen ... 215
Figure 6-31. Measured and predicted data for DP600 biaxial EHFF specimen; a) major strain, b) minor strain, c) thickness and d) height ... 217
Figure 6-32. Measured strain distribution and predicted strain path for an element at the centre of the DP600 biaxial EHFF specimen ... 218
Figure 6-33. Effective plastic strain and effective strain rate histories for an element at the centre of the DP600 biaxial EHFF specimen ... 218
xix
Figure 6-35. Measured strain distribution and predicted strain path for an element at the centre of the AA5182-O biaxial EHFF specimen ... 221
Figure 6-36. Effective plastic strain and effective strain rate histories for an element at the centre of the AA5182-O biaxial EHFF specimen ... 221
Figure 6-37. Effective plastic strain contours predicted by Yld2000-2d for DP600; a) uniaxial, b) intermediate draw, c) plane strain and d) biaxial ... 222
Figure 6-38. Measured and predicted data for DP600 in EHDF; a) major strain, b) minor strain and c) height ... 224
Figure 6-39. Measured strain distribution and predicted strain path for an element at 5mm distance from the centre of DP600 specimen in EHDF ... 226
Figure 6-40. Effective plastic strain and effective strain rate histories for an element at 5mm distance from the centre of DP600 specimen in EHDF ... 227
Figure 6-41. Shear strain and minimum principal stress histories for an element at 5mm distance from the centre of DP600 specimen in EHDF ... 229
Figure 6-42. Pressure distribution history through the water during EHDF (pressure unit in GPa) ... 231
1
1
Introduction
Finite element (FE) simulations can be used to investigate sheet metal forming processes for many reasons such as analysing stress, strain and temperature distributions, predicting material flow and deformation history, and predicting potential locations of strain localization and failure. FE simulations can significantly reduce the time and cost to design and optimize manufacturing processes. The development of modern computational techniques, especially the advancement of commercial finite element
codes have made modelling and simulation indispensable components of product design and optimization in an integrated manufacturing environment. In FE simulations of sheet
metal forming processes, the accuracy of the predicted results can be influenced by many parameters such as the constitutive material model which represents the elasto-plastic behaviour of the material, tribological and contact conditions, and numerical factors such as element type and formulation. The computation time and geometrical representations should also be considered for reliable and cost effective FE simulation. In the first few decades of FE simulation development, attention was focused on improving the formulations, methodology, algorithm, and computational efficiency. As these issues were gradually resolved and the FE approach was used for a broader range of applications, substantial efforts were put into developing and modifying different constitutive material models. Many material models were developed to represent the behaviour of a variety of materials.
2
generally used to express all stress, strain, and internal state variables. The constitutive material model plays a critical role in many sheet metal forming areas such as formability analysis, defect analysis (such as wrinkling and earing), localization and failure analysis, and prediction of springback. The material model affects many aspects of a sheet forming analysis because it is used to update the stress and all internal state variables based on the deformation rate tensor. Due to the path-dependency (nonlinearity and irreversibility) nature of plastic deformation, the incremental formulation scheme is the most convenient approach for writing all elasto-plastic constitutive material equations. Therefore, for any
constitutive material equation implemented into a FE code, the relation between the strain increment (or deformation rate) and stress increment must be derived (so-called incremental plasticity). The overall response is determined incrementally by integrating the rate-type constitutive and field equations along a given path of loading or deformation. Figure 1-1 shows the role of a general constitutive model in predicting the material deformation in nonlinear FE analysis.
Figure 1-1 Role of constitutive material model in nonlinear FE analysis
3
orientations, and the strain rate and/or temperature dependent hardening (flow stress) behaviour. Many factors should be considered when selecting a constitutive material model for a FE sheet metal forming analysis. First, the nature of the actual forming process must be carefully analyzed to recognize the parameters which are effective in the elasto-plastic mechanical responses (deformation history) of the material during the plastic deformation. For instance, it is now well known that the mechanical response of many materials including the initial yield stress, flow stress, and ductility, can change significantly with strain rate and temperature. Accordingly, the sensitivity of the
mechanical response to strain rate should be considered in the simulations of rate-dependent (dynamic) forming processes, such as electrohydraulic forming (EHF). At the same time, the constitutive material equation should not be so complicated that it requires an excessive number of coefficients, because the experimental tests to calibrate the model, the numerical implementation, and the computational procedures will be expensive. The robustness of a constitutive material model can be assessed with a thorough comparison to experimental findings. An appropriate material model should provide the best possible fit to the actual material properties at a reasonable cost.
Generally, constitutive material models can be categorized into either micro-structural or phenomenological models. Micro-structural models are based on some description of the crystal structure and crystallographic texture. These types of models often produce accurate results, but usually require numerous complex experimental tests and the computing time needed to carry out these computations is prohibitive in the design stage of a forming process. Phenomenological constitutive models generally include an anisotropic yield function, a flow rule, and a hardening model. These models are assumed to be well described with a flow surface that evolves during plastic deformation. In spite of the limitations of a single flow surface associated with isotropic hardening, this approach is appealing at the forming process design stage, because they require less and
simpler experimental tests and also shorter computation times compared to micro-structural models.
4
experimentally. Recently, it was demonstrated that in addition to flow stresses, the mechanical properties associated with the material anisotropy behaviour changed with strain rate (Lee et al., 2010). Among material parameters, the flow stresses and r-values under different loading conditions influence the initial anisotropic state of the sheet material. The initial anisotropy of a material is represented by the flow surface shape which determines residual stress and strain distributions in the sheet when the forming process is completed. Therefore, an accurate description of the anisotropy behaviour of sheet materials can be one of the most effective parameters in the simulation of sheet
metal forming processes.
For decades, many researchers have reported changes in the hardening behaviour of a variety of materials as a function of strain rate. The changes in hardening behaviour have a significant effect on the flow surface evolution of the material. But, to the best of the author`s knowledge, researchers do not take strain-rate sensitivity into consideration when calibrating anisotropic yield functions. Despite the importance of accurately capturing the evolution of the flow surface by correlating the anisotropic yield functions to strain rate, a comprehensive study to evaluate simultaneously the influence of the strain rate in both material anisotropy and hardening behaviour has not been completed to date. The variation in the material anisotropy coefficients with strain rate can potentially alter the flow surface shape, which consequently changes the residual stress and strain in the as-formed part in a rate-dependent forming analysis. Therefore, the author proposes to investigate the effect of both anisotropy and hardening changes of material as a function of strain rate in the simulation of sheet metal forming processes.
In this work, the mechanical properties (including flow stresses and r-values) of three sheet materials (DP600, TRIP780, and AA5182-O) were obtained at different strain rates
5
of the materials, three different rate-dependent hardening models (Johnson-Cook, JC; Khan-Huang-Liang, KHL; and Surajit Kumar Paul, SKP) were calibrated.
After a thorough review of different constitutive models, several associative rate-dependent material models (based on associated flow rule, AFR) were developed. The new material models, which are a combination of updated anisotropic yield functions, (the anisotropy coefficients are updated depending on the strain rate) and rate-dependent hardening model, were developed to predict both anisotropic and rate-dependent hardening characteristics as accurately as possible. It should be mentioned that the “updated” expression implies that the anisotropy coefficients were updated to the
corresponding values for the current strain rate, by applying 4th-order strain rate dependent polynomial functions instead of the initial constant anisotropy coefficients. In developing the rate-dependent material models, an effort was made to maintain the numerical implementation as efficient as possible.
Among all the anisotropic yield functions and hardening models, Yld2000-2d (for plane stress conditions) and Yld2004-18p (for general stress state conditions) as yield functions were selected to combine with KHL as hardening model to develop rate-dependent anisotropic user-defined material subroutines (VUMATs). Finally, an implicit stress integration algorithm, using the multi-step return mapping method, was used to develop rate-dependent anisotropic constitutive material models. The developed implicit integration method has a general form that can be implemented with any quadratic or non-quadratic yield function paired with any rate-dependent hardening model. The developed models were implemented asVUMATs for ABAQUS/Explicit code to simulate electrohydraulic forming of both DP600 and AA5182-O sheet materials under different process conditions, using Eulerian elements and the ignition-and-growth model to simulate the pulsed pressure wave in EHF. The simulation results under different EHF conditions using the developed material models were then compared with experimental
6
This dissertation is subdivided into the following sections:
• Chapter 1. Introduction
• Chapter 2. Literature review
• Chapter 3. Rate-dependent constitutive model
• Chapter 4. Effect of updating anisotropy coefficients on the flow surface
• Chapter 5. Rate-dependent implicit stress integration scheme
• Chapter 6. Finite element simulation of electrohydraulic forming
7
2
Literature Review
2.1
Introduction
The automotive and aerospace industries have been requesting material suppliers to
develop lighter and stronger materials at reasonable production costs for decades. However, many of the developed low-cost and light-weight materials, such as aluminum alloys and advanced high strength steels (AHSS) have limited formability in conventional forming processes. Researchers have shown that, to overcome this barrier, non-traditional forming operations can be designed for these types of materials instead of merely substituting these alloys. High speed metal forming processes are recognized as a potential replacement for conventional forming processes to increase material formability.
One of the main barriers to the industrial implementation of high speed metal forming processes is the lack of experience to predict sheet material behaviour under large plastic deformation. Numerical simulations of sheet metal forming processes are routinely used to achieve substantial time and cost reductions in the design process. When a sheet is accelerated in a forming process, the strain rate effect becomes important. Therefore, it is vital to consider the strain rate effect to accurately predict the deformation history and final shape in simulations of high speed metal forming processes.
Among all the parameters in the simulation of a forming process, the constitutive model has a very significant effect on the accuracy of numerical results. Three major concepts are involved in a constitutive model: the yield function, the flow rule, and the
8
constitutive equations of high strain rate plasticity. Incremental constitutive equations are obtained based on the minimum plastic-work theory and have been widely used in advanced computational plasticity for decades (Hill, 1986; Chung and Richmond, 1993; Yoon et al., 1999a and 1999b). This chapter also contains a review of the experimental and numerical work on high speed metal forming processes, and intermediate and high speed material characterization tests.
2.2
High speed metal forming
2.2.1 High strain rate metal forming processes
According to work done by many researchers (Wood, 1967; Daehn, 2006; Ferreira et al., 2004; Golovashchenko et al., 2003), high strain rate forming can improve formability, suppress wrinkling, decrease springback and lead to more uniform strain distributions in sheet metal parts. For decades, one of the main desires of the automotive industry has been to improve the fuel economy of the vehicles. One of the most effective ways of reducing fuel consumption is to reduce the weight of the vehicle body, by replacing mild steels with advanced high strength steels (AHSS) or light-weight alloys such as aluminum (Cheah and Heywood, 2011). The main concern with the implementation of AHSS and aluminum alloys is their lower formability compared to typical steels. To overcome this barrier, the automotive industry has been investigating various forming techniques which can enhance material formability.
According to many investigations on metallic alloys (Balanethiram and Daehn, 1994; Mynors and Zhang, 2002; Golovashchenko et al., 2003; Imbert et al., 2005, Psyk et al., 2011), it was observed that sheet formability can exceed the conventional limits in high velocity forming processes. Pulsed forming processes such as explosive forming (EF), electromagnetic forming (EMF), and electro-hydraulic forming (EHF) are the most common high speed or high strain rate metal forming technologies (Benedict, 1987; Amstead et al., 1987; Groover, 2007). From a manufacturing point of view, the use of
9
highlighted when very large dies are needed for low volume productions, particularly in the aerospace industry. Moreover, the elimination of the hard tooling from one side of the sheet reduces the friction and strain gradients and thus delays strain localization in the corner areas of complex dies (Golovashchenko et al., 2003). Furthermore, pulsed forming processes typically require less lubrication than conventional stamping (Mynors and Zhang, 2002).
What distinguishes EF, EMF, and EHF processes from each other is the source of the forming energy and the method of energy transformation into the sheet. In explosive
forming, an explosive charge, which is generally submerged in water, provides the energy to form the sheet material. In both EMF and EHF, the required energy is stored in high voltage capacitors. In EMF, the energy is released through a multi-turn coil positioned close to the sheet that is to be formed. The rapid increase of current in the coil induces an eddy current which generates significant repulsive forces and consequently accelerates the sheet. Instead of using coils, EHF uses (at least one pair) electrodes submerged in water to transfer the energy from the capacitors to the sheet. The discharge of energy across the electrodes creates a plasma channel that generates a high pressure wave in the water, which in turn accelerates the sheet.
EHF is superior to EF due to its shorter cycle duration and much safer process. However, in view of the significant amount of energy in chemical explosives, the EF process is more practical to form larger parts, particularly in aerospace and military applications. Compared to EMF, EHF is more suitable for industrial applications, since it is applicable to almost all metallic materials. EMF cannot be used with materials that have poor electrical conductivity and in contrast with EHF, EMF requires expensive and complex coils that need to be replaced after only a few cycles.
Needleman (1991) showed that in high velocity metal forming processes necking was postponed due to inertial effects (referred to as inertial stabilization), by reducing the
stress-triaxiality factor in the necked region. During the 1990’s Balanethiram and Daehn (1992, 1994), and Balanethiram et al. (1994) showed that for AA6061 aluminum alloy,
10
through-thickness compressive and shear stresses (so-called “inertial ironing” effect) that were created as a results of the dynamic sheet/die interaction under pulsed die-forming conditions. Vohnout and Daehn (2002) reported formability enhancement in 6111-T4 and 5754-O aluminum sheets in the EMF process after applying a certain quasi-static pre-strain in uniaxial tension.
Golovashchenko et al. (2003) also observed formability improvement in high velocity forming due to dynamic sheet-die interaction. In a pulsed forming process before the sheet contacts the die, the sheet is accelerated into an open space of the die cavity and the
strain-rate sensitivity as well as inertial effects contribute toward material formability improvement. The advantages of a pulsed forming process become evident when the sheet approaches its final shape and impacts the die surface. More recently, Seth et al. (2005) reported a remarkable formability improvement in low carbon steel sheets that were accelerated by an EMF coil toward missile-shaped and wedge-shaped punches. Due to the low electrical conductivity of dual phase steels, the efficiency of the EMF technique is limited for these material types unless a driver with high electrical conductivity is used as an interface.
Imbert et al. (2005) reported a formability enhancement of AA5754 and AA5182 aluminum sheet alloys in EMF in the die-forming condition, while the formability improvement was negligible in free-forming. Similar to Balanethiram and Daehn (1992, 1994), Imbert showed that the significant formability improvement was due to the bending-unbending effect as a consequence of the sheet/die interaction; however their simulation of the experiments used a rate-independent constitutive material model. An abrupt change of stress state was observed, from plane stress to a three-dimensional stress state, incorporating through-thickness shear and compressive stresses due to sheet-die interaction. The through-thickness stresses were shown to suppress the nucleation and coalescence of voids within the sheet metal, and consequently postpone the onset of
necking and failure.
Olivera et al. (2005) reported a moderate formability improvement in AA5754 and
11
far from the fractured zone. Golovashchenko et al. (2007) reported almost 250% elongation increase in AA6111-T4 and AA5754 sheets in EMF compared to conventional forming, when formed into conical and v-shape dies. Dariani et al. (2009) reported significant formability improvement in the high strain rate regime compared to low and intermediate strain rates for AA6061-T6 and 1045 steel. Golovashchenko et al. (2011a) showed that in addition to the formability improvement in pulsed forming, a more uniform strain distribution though a much broader area of the sheet can be achieved. The uniform strain distribution can be beneficial to form very complex geometries, where the
material in pulsed forming can flow easier into difficult to form regions compared to conventional forming by introducing a two-step forming process. This easier flow of material allows the usage of less ductile materials to be formed into complex shapes. Liu et al. (2011) showed formability enhancement of sheets that were prestrained quasi-statically and then subject to EMF compared to the forming limits obtained in a conventional hydraulic bulge test.
2.2.2 Electrohydraulic forming (EHF)
In EHF, two or more electrodes are positioned in a chamber filled with a liquid (generally water), a voltage discharge between the electrodes generates a high-pressure and high-temperature plasma channel. The plasma channel expands and creates a shockwave that propagates through the water and accelerates the sheet toward the die cavity (Figure 2-1). Generally, an EHF process is completed in less than a millisecond depending on the sheet material type, the position of the electrodes, the input energy magnitude and duration, and the chamber geometry.
12
Chachin (1978) conducted several lab-scaled and preliminary industrial applications of the EHF. In a combined conventional-pulsed forming study, Sandford (1970) developed a technology where the sheet was first preformed in a quasi-static hydroforming process before being completely filled into the die cavity with EHF. Daehn (2006) provided and overview of the experimental and development work that has been done more recently in high speed forming.
Figure 2-1 Schematic of EHF process and related tools
The automotive industry has recently shown increased interest in the EHF process.
13
the sheet are converted into ellipses, which divide into smaller volumes and finally close towards the end of the process.
Golovashchenko (2007) observed a circular split failure mode in the apex region of the die formed samples in EHF. Strains measured in some circle grids far from the fractured zone moderately exceeded the quasi-static forming limit, which was attributed to inertia in the plastic flow instability, as described by Drucker (1959). More recently, Rohatgi et al. (2011a; 2011b) experimentally quantified the deformation behaviour of AA5182-O and DP590 during EHF using high-speed cameras and the digital image correlation (DIC)
strain analysis technique. The measurements (sheet velocity and strain rate) of the in-process parameters helped to understand the roles of strain rate and sheet-die interaction in sheet formability enhancement at intermediate and high strain rates. They recorded a maximum velocity and strain rate of and , respectively, during electrohydraulic die-forming (EHDF). Unfortunately the conical die angle they used was so high, that they were not able to capture an effective dynamic sheet/die interaction
during EHDF. Melander et al. (2011) developed a finite element model to simulate EHFF and EHDF of sheet steels which used an isotropic yield function (von Mises) and they calibrated the parameters in the JC model according to experimental uniaxial tensile tests for a range of strain rates up to . They used acoustic elements to simulate the
liquid medium within the EHF chamber.
Substantial efforts have been dedicated to the analysis of pulsed forming processes, and EHF in particular. However, a detailed understanding of the reasons leading to the increased formability of sheet materials in high rate forming into a die cavity has not yet been accomplished due to the complexity of the effects taking place. In order to capture the mechanics of the sheet’s deformation into the die cavity, the development of the
14
computation time required for the analysis of the EHF process. A very fine mesh in a small discharge channel and in the area around it requires a very small time step in an explicit integration procedure, and most of the computation time is consumed before any pressure has been applied to the sheet. This approach provides full details on the pressure propagation mechanism, but practically, it required the researchers (Golovashchenko et al., 2011a; 2011b; 2013) to employ a shell model of the deformed sheet (Theory of Shells, LS-DYNA manual, 2006). The use of shell elements to model the sheet limits the analysis to a plane-stress formulation that omits the through-thickness stresses from the
analysis and excludes the dynamic sheet-die interaction. The plane stress formulation makes it impossible to analyse the mechanics of the coining effect or to predict the correct strain rate variation when the sheet hits the die, which is recognized as the main phenomenon that helps to improve material formability. Also, in these simulations an isotropic yield function (von Mises) was paired with the Johnson-Cook hardening model. Hence, in addition to the formability enhancement mechanisms, the effect of anisotropy at high strain rates was ignored in numerical simulations. The simulation and experimental results showed that, the sheet/die interaction creates very high strain rates in EHF. Numerical results showed a peak strain rate of approximately , in EHF,
when the sheet was able to completely fill the die cavity, but less than when
the die was not completely filled.
Also, Golovashchenko et al. (2013) reported the formability limits of different dual phase steels (DP500, DP590, DP780, and DP980) in EHF compared to the conventional quasi-static limiting dome height (LDH) test. Substantial formability improvement was observed by comparing the maximum strains resulting from EHF into conical and v-shaped dies to the maximum strains obtained in LDH tests. The relative improvement in plane strain formability in EHF conditions was between 63% and 190%, depending on the grade of dual phase steel.
15
was less than what was observed in a single pulsed forming process, but still greater than the quasi-static conventional forming limits. Also, Gillard et al. (2013) distinguished between two different failure modes in EHF experiments using a conical die: a quasi-static failure mode, where the crack propagates through the pole of the dome-shaped specimen, occurred when the sheet was not able to completely fill the die cavity, and a dynamic fracture mode, in which the crack propagates circumferentially in the area away from the pole of the cone-shaped specimen, occurred when the energy level was high enough for the sheet to completely fill the die cavity.
Most recently, Maris (2014) designed and optimized several specimen geometries to obtain the experimental FLC under electrohydraulic free-forming conditions. A series of EHF tests for DP600 and AA5182-O, covering the entire range of deformation modes (uniaxial, intermediate draw, plane strain, and biaxial) were conducted under proportional loading paths. The strains were measured throughout necked specimens (no edge cracking or splitting was observed in the deformed specimens). Comparison of the measured strains of the electrohydraulic free-formed specimens with the quasi-static FLC, showed that the formability improvement depends on the material grade. For instance, some formability improvement was reported for AA5182-O, whereas no formability improvement was observed for DP600.
Although very complex and comprehensive FE models were recently developed to simulate the EHF process (Golovashchenko et al, 2013), the effect of material anisotropy was not considered in the high strain rate regime in any of the above-mentioned work. An extensive review of the literature has shown that, in all of the up-to-date pulsed forming FE simulations, only an isotropic yield function (von Mises) combined with the JC rate-dependent hardening model has been used (Imbert et al., 2005; Melander et al., 2011; Golovashchenko et al., 2013).
2.3
Constitutive model
deep-16
drawing, rolling, cold, warm and hot-forming, forging, and extrusion). Among all of the parameters that affect the quality of FE analysis, the constitutive material model is known to be the predominant factor. An appropriate set of constitutive equations should be able to replicate the deformation behaviour of the material under different loading conditions. Generally a phenomenological constitutive model consists of a yield function, a flow rule, and a hardening model. A constitutive model should be selected depending on the available experimental data associated with the material behaviour, the deformation history of the part during the actual forming process, and the knowledge of the user.
2.3.1 Anisotropic yield functions
A flat rolled sheet can be significantly anisotropic due to complex phenomena occurring during the thermo-mechanical processing of the sheet and especially during the
cold-rolling. The anisotropy depends on the initial anisotropy of the as-rolled sheet and the complex plastic deformation during the actual forming operation. The initial
anisotropy of the rolled sheet is typically an orthotropic symmetry but when the principal axes of deformation are not co-linear with the principal axes of orthotropy, the deformation-induced anisotropy becomes non-symmetrical. Accordingly, the implementation of material anisotropy into a FE code can be very complex. But, in order to reduce computation times and simplify the numerical analysis of industrial forming operations, the progressive change of material anisotropy during an industrial forming process is usually assumed to be negligible compared to the initial anisotropy induced by the cold-rolling process.
17
material anisotropy is able to evolve throughout the deformation history, which makes this approach unique. However, in these models the material characterization is complex and computationally time-intensive, so they are rarely used for industrial-scale metal forming applications. There have been many attempts to simplify the polycrystal approach to overcome these drawbacks. A single grain behaviour has been used in FE simulations (Lequeu et al., 1987; Arminjon, 1991; Darrieulat and Piot, 1996; Maniatty and Yu, 1996; Gambin and Barlat, 1997). Also, a unified polycrystal behaviour was associated to the grain orientation distribution of the material by Toth et al. (1991),
Arminjon and Imbault (1994), and Van Houtte (1994).
The second approach is phenomenological, where the plastic behaviour of the material is described by a flow surface that evolves during plastic deformation. In this approach, the yield function is not necessarily associated with the microstructure of the material, but is rather associated with the anisotropy of the flow stress and the anisotropy of the plastic flow (or plastic strain). The anisotropy of the flow stress can be determined by measuring the flow stress in different material orientations (rolling, RD, diagonal, DD, and transverse, TD directions). The anisotropy associated with the plastic flow is generally described by the Lankford coefficient (r-value), which is defined as the ratio of the width strain to the thickness strain during a tensile test. In addition to the anisotropy, the Bauschinger effect, hydrostatic stress, etc., are other parameters that affect the plastic yielding of sheet metals. Based on many experimental observations, Bishop and Hill (1951a and 1951b), and Hecker (1976) showed that the assumption of a yield surface as the potential for plastic strain is valid for polycrystals and single phase materials. For many years, the evolution of the flow surface was a topic of great interest in both theoretical and experimental research. For many metal forming simulations, the flow surface is assumed to expand isotropically during plastic deformation. This assumption is numerically very efficient and it is verified for many single phase materials subjected to
relatively smooth and continuous loading paths. Compared to crystal plasticity models, phenomenological models are easier to implement into FE codes, computationally more
18
Hill (1948, 1950) introduced the first phenomenological anisotropic yield function, as an expansion of the von Mises (1928) quadratic yield function. Hill`s function has been widely used in FE analysis of forming simulations since it is applicable to three-dimensional stress states and represents linear relationships between stresses and strain increments. Acceptable results are obtained for steel sheets using this function, but observations showed that Hill`s theory does not correlate with the behaviour of aluminum alloys (Mellor and Parmar, 1978; Mellor, 1981). Hill`s yield function was not able to describe the plastic flow of materials that display so-called “anomalous behaviour”.
Therefore, several researchers such as Gotoh (1977), Hill (1979, 1990, 1993), Barlat and Lian (1989),Weixan (1990), Montheillet et al. (1991), Lin and Ding (1996), Barlat et al. (1991, 1997, 2003, 2005) have developed different non-quadratic yield functions to improve the plastic behaviour for aluminum alloys. Phenomenological yield functions have been reviewed in more detail by Zyczkowski (2001), Banabic (2001), Yu (2002) and Barlat et al. (2004).
The linear transformation of the stress tensor has received much attention as a particular case of transformation theory. Sobodka (1969) and Boehler and Sawczuck (1970) were among the first to apply linear transformations to the stress tensor. Later on, Barlat and Lian (1989) combined the principal values of these transformed stress tensors with an isotropic yield function to describe the anisotropic behaviour of materials for the plane stress conditions. Barlat et al. (1991) and Karafillis and Boyce (1993) extended this approach to three-dimensional stress states by proposing a general yield function. Cazacu and Barlat (2004) showed that this theory is general and is compatible with a wide range group of materials, such as HCP metals. Since, many of the above-mentioned yield functions were not able to accurately capture the anisotropic behaviour of aluminum sheets, Barlat et al. (2003) introduced a plane stress yield function that is expressed by two linear transformations of the stress tensor (Yld2000-2d). Also, Bron and Besson
(2004) extended Karafillis and Boyce`s (1993) function to two linear transformations. Barlat et al. (2005) proposed a new yield function (Yld2004-18P) that is able to describe
19
In most non-quadratic yield functions (Logan and Hosford, 1980; Hosford, 1992; Hosford, 1996; Barlat et al., 1991, 1994, 1996, 2003, 2005), the exponent of the function is associated with the material crystal structure, and is equal to and for BCC and FCC
materials, respectively. Recent progress in developing advanced anisotropic yield functions shows that the order of anisotropic yield functions becomes higher to more accurately describe the plastic behaviour of metal sheets. Higher order yield functions have more variables which require calibration from different types of experiments.
Many of the above yield functions were implemented in different metal forming FE simulations for a wide variety of metals by applying the isotropic hardening assumption (Chung and Shah, 1992; Yoon et al., 1999a and 1999b; Tugcu and Neale, 1999; Andersson et al., 1999; Inal et al., 2000; Worswick and Finn, 2000; Yoon et al., 2000). The effect of anisotropic yield functions has been limited to the FE simulation of conventional metal forming processes. To the best of the author`s knowledge, no anisotropic yield function has ever been calibrated and applied to simulate a high speed metal forming process such as EHF. An extensive literature review failed to identify any
research that considered the changes of the material anisotropy according to the strain rate. Several of the most frequently-used phenomenological anisotropic yield functions for sheet metals have been reviewed in this section. More details about the formulation and calibration procedure of some of them are presented here.
2.3.1.1Hill 1948 (Hill48)
Hill's (1948) quadratic yield function (Hill48) is no doubt the most widely used anisotropic yield functions. The plane stress form of this function can be written as
( ) ( ) (2-1)
20 2.3.1.2Hosford 1979
Hosford (1979) introduced an anisotropic yield function based on Hershey`s (1954) idea, which uses principal stresses to describe isotropic polycrystalline metals. This function is an extended form of Hosford`s (1972) non-quadratic yield function which is applicable to three-dimensional stress states.
| | | | | | (2-2)
where , , and are principal stresses and is generally equal to and for BCC or FCC metals, respectively.
2.3.1.3Hill 1979 (Hill79)
Hill (1979) proposed a general non-quadratic yield function for aluminum alloys, based
on Hosford`s (1979) idea.
| | | | | | | |
| | | | (2-3)
where, similar to Hill48, F, G, H, L, M, and N are anisotropy coefficients. m is determined based on the experimental uniaxial and biaxial data.
2.3.1.4 Barlat and Lian 1989 (Barlat89)
Barlat and Lian (1989) introduced a non-quadratic yield function (Barlat89) applicable to anisotropic polycrystals, but is limited to the plane stress condition.
| | | | ( )| | ̅ (2-4)
where and are written as
√( )
21
where a, c, h and p are the material anisotropy coefficients, which can be obtained either from measured flow stresses or r-values. The equations related to these coefficients are presented in Chapter 3.
2.3.1.5Hill 1990 (Hill90)
Hill (1990) proposed another non-quadratic yield function (Hill90) to improve upon
the drawbacks of Hill`s 1979 function, which is only applicable to the plane stress condition.
| | ( ) | | | |( ) ⁄
{ ( ) ( ) } ( )
(2-6)
where is the equibiaxial flow stress, is the shear flow stress, is the angle between the first principal stress and the axis of orthotropy, and and are the anisotropy
coefficients.
2.3.1.6Barlat 1991 (Yld91)
Barlat et al. (1991) proposed a non-quadratic yield function (Yld91) for orthotropic materials, which is applicable to three-dimensional stress states.
| | | | | | ̅ (2-7)
where are known as the principal values of an isotropic plasticity equivalent (IPE). A
linear transformation of the stress tensor is defined as
(2-8)