COMFORT TEMPERATURE IN AIR CONDITIONED OFFICE BUILDINGS:
CASE STUDY OF INDONESIA AND SINGAPORE
S.A. Damiati
1,4, S.A. Zaki
1, S. Wonorahardjo
2, N.H. Wong
3, H.B. Rijal
41 Malaysia-Japan International Institute of Technology, Universiti Teknologi Malaysia, Malaysia sheikh.kl@utm.my
2 School of Architecture Planning and Policy Development, Institut Teknologi Bandung, Indonesia 3 Department of Building, National University Of Singapore, Singapore
4 Department of Restoration Ecology & Built Environment, Tokyo City University, Japan
ABSTRACT
Air-conditioning system has been a basic feature in many office buildings, especially in tropical climate where buildings are exposed to solar radiation all year round. However, air conditioning is a leading source of energy consumption. Efficient energy consumption is highly desirable for commercial, for-profit entities occupying offices. A field study in two countries; Indonesia and Singapore, has been conducted to investigate office building occupants’ thermal comfort. In 2015, questionnaire survey as well as physical parameter measurements were collected from each country. Analysis shows that occupants of air-conditioned building with window-opening behaviour has higher comfort temperature, compared to cooling mode only. The results of this study could be used to better understand comfort temperature in tropical countries.
Keywords— Thermal comfort, Office building, Tropical climate, Air conditioning, Mixed mode
1. INTRODUCTION
Nearly half of the total electricity usage in buildings was for the sake of providing a thermally comfortable air condition, as reported from air-conditioning (AC) usage in tropical countries [1],[2]. Energy consumption increases as lower temperature setting are used. In some countries, this has lead to “minimum temperature setting campaigns” such as Japan’s Cool Biz, promoting minimum AC setting of 28°C for cooling [3], and the Malaysian government promoting a minimum temperature of 24°C in its offices [4]. However, building occupants’ comfort should be taken into account concurrently with these energy saving measures. This is also considered important in office buildings since workers’ productivity would be at stake [5]. Meanwhile, there was no such temperature recommendation for energy-saving campaigns in Indonesia and Singapore, two south-east Asian countries with tropical climate.
Preceding research studies has been conducted on office workers in other climatic conditions. A survey in 2006 concluded that 81% of workers in the UK find it difficult to concentrate on their work, taking up to 25% longer time to complete tasks if the ambient temperature is higher than the
norm, while 24°C is the maximum air temperature recommended by the World Health Organisation for workers’ comfort [6]. Thermal comfort is also the second highest cause of worker dissatisfaction, with 50% of workers dissatisfied with thermal environmental conditions [7].
Meanwhile in tropical climate, there were some instances when people actually feel cold inside of an air-conditioned buildings, despite having a warm outdoor climate [8]. The evidence of overcooled buildings issues were shown through previous climate-chamber field studies in the hot humid climate of Hongkong by Chan et al. [9], Mui [10], Lai et al. [11], Lee et al. [12] and 12 years ago in Singapore by Sekhar [13]. Overcooled office buildings is a serious issue because of the resource consumption through energy waste, HVAC operation and maintenance, as well as environmental damage. Continuous feedback is needed to ensure technology is used efficiently, meets society’s needs, and does not cause harm.
Addressing the overcooling issue, the objectives of this study were: 1) to investigate comfort temperature of office buildings with mechanical air conditioning system in Indonesia and Singapore; 2) to compare comfort temperatures expressed in 4 thermal index: air temperature, globe temperature, mean radiant temperature, and operative temperature; and 3) to compare the comfort temperature results with related available guidelines.
2. INVESTIGATION METHOD
2.1. Location and investigated buildings
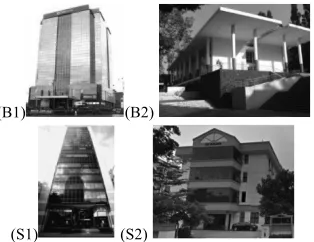
(B1) (B2)
(S1) (S2)
Fig. 1 Office buildings facade in Bandung: B1 and B2 and Singapore: S1 and S2
As seen in Fig. 1, there were four buildings included in this study; two buildings in each country. In Indonesia, these were an office in the urban area of Bandung (B1); and a building inside of Institut Teknologi Bandung, Ganesha Campus (B2). In Singapore there were Tong Building (S1); and TSK Building (S2). All of the buildings provides air conditioning for the occupants, although occupants’ access to temperature control settings were different. B1 and S1 both use centralized AC system, while B2 and S2 use split unit AC where the occupants have more control over temperature settings and the flexibility to turn AC on or off. More preliminary design parameters of each buildings are listed in Table 1. This study covers both medium high-rise buildings (B1 and S1) and low-rise buildings (B2 and S2).
Table 1 General information of investigated buildings
Items/ Buildings B1 B2 S1 S2
Ventilation type
AC Central
AC split-unit + windows
AC central AC split-unit
Total Storey 12F + 1B 2F + 1 B 19F + 1 B 4
Orientation N-W S-N S-E N-E
Overhang roof n/a available n/a n/a
Façade
Curtain walls + ACP
Operable glass windows
Curtain walls
Curtain walls + ACP
AC: Air Conditioning, F: Floor, B: Basement, N: North, S: South, E: East, W: West, ACP: Aluminium Composite Panels
2.2. Thermal measurements
Since thermal comfort affected by physical and personal parameters, both were measured simultaneously in this study. There was no interference or control over the thermal environment, since this study aims to investigate occupant response to typical conditions. Air temperature, globe temperature, and relative humidity were measured every 10 seconds using HOBO thermo recorders. The basic function of this instrument is to record air temperature and relative humidity and also comes with two external data channels. One of these channels attached to TMC-HD1 external air temperature sensor tipped with a 40mm black sphere to measure globe temperature. Outdoor temperature were also recorded using the same instrument, equipped with solar-radiation shield, located outside of the investigated building. Simultaneously, air velocity was measured in 10 second intervals using hot wire anemometer attached with an
omnidirectional probe. Both equipment are illustrated in Fig. 2.
Each equipments’ sensor was set up in a retort stand, attached to a clamp, approximately 1.1 meters height above floor level. The measurments include both movable and static stands. The static stand would be
attached with anemometer and placed in the middle of the measured room. Meanwhile, the movable stand would placed about 1 meter away from the subject who is answering the questionnaire survey. The stand would be moved after approximately 20 minutes, after the subject finished filling up questionnaire. Surface temperatures were measured from each cardinal directions inside of the room, using the IR-300 infrared thermometer. Specifications of each mentioned instruments as listed on Table 2.
Table 2 Specification of the instruments
Instrument Resolution Accuracy
Thermometer with data logger
(HOBO U12-13) 0.05°C ±0.25 oC [0°C to 50°C]
Anemometer
(Kanomax 6501-0G) 0.01 m/s
± 0.0125 m/s [0.10 to 30.0 m/s]
Infrared Thermometer (IR-300) 0.1°C ±0.3°C [-55°C to 220°C]
2.3. Thermal comfort survey
Personal parameters such as occupants’ metabolic rate, clothing insulation value, and thermal perceptions were surveyed through questionnaires. The questionnaire collected information such as socio-demographics, thermal sensation, acceptability, preference, overall comfort vote, adaptive behavior, and clothing worn on that time. Thermal Sensation Vote (TSV) in this study uses the ASHRAE-55 seven point scale [17], which was translated to local language for each surveys in Indonesia, as shown in Table 3. Another scale used in this study was the 4-point air movement vote.
340 questionnaires were distributed to four groups of occupants in four different buildings in Bandung and Singapore, and 255 responses were collected. In Bandung, there were 16 and 20 subjects from offices B1 and B2 repectively; while in Singapore there were respectively 8 and 6 respondents from offices S1 and S2. Basic infomation such as age and gender were obtained from the questionnaire. The combined male to female ratio across all study locations is 52:48, which is quite balanced. 48% of occupants were aged between 20-29 years old, 34% between 30-39 years old, 12% between 40-49 years old, and 6% are more than 50 years old.
All field measurements mentioned in this study were conducted between January and March 2015. Physical thermal environment parameters were measured during three to five days in each location. At the measured days, the questionnaires were distributed every morning (10:00-11:00) and afternoon (14:00-15:00). All of the physical data
Fig. 2 Retort stands with thermo
from each instruments during these hours was taken as an average value for each thermal index. Due to permission issues, the duration and repetition quantity of subjective questionnaire survey were different between each country. The respondents in Singapore only gave their thermal votes once in the first day of measurements, while Indonesian respondents voted 6 to 10 times throughout the study.
Table 3 Scale and translation
Thermal sensation vote Air movement vote
Scale English Indonesian Scale English Indonesian
-3 Cold Sangat dingin 1 No movement Tidak ada
-2 Cool Dingin 2 Weak Lemah
-1 Slightly cool Agak dingin 3 Moderate Sedang
0 Neutral Netral 4 Strong Kencang
1 Slightly warm Agak hangat
2 Warm Hangat
3 Hot Panas
2.3. Calculation of mean radiant and operative temperature
Mean radiant temperature (Tmrt) and operative temperature
(Top) are derived from air temperature (Ta), globe
temperature (Tg), and air velocity (Va). Other than globe
thermometer method, there is also the integral radiaton measurement method to obtain mean radiant temperature. However a recent study by Thorsson et al. revealed that there is only relatively small differences between both methods, even in an outdoor setting [18]. This study therefore uses the globe thermometer method and calculates Tmrt using Equation (1) [19].
𝑇!"#= 𝑇!+273 !+1.1×10
! 𝑉 !!.!
𝜀𝐷!.! 𝑇!−𝑇!
! !
−273 (1)
𝜀 refers to emissivity of the globe, taken as 0.95 for a black globe, and D diameter of the globe which is 0.04 meter. Top is a combination of air temperature and mean radiant
temperature, a weighted average value of both to express their joint effect. The weighting factors are radiative and convective heat transfer coefficients at the occupant’s clothed surface. At indoor condition when air speeds around 0.10 m/s, Top is approximated with Equation (2) [20].
𝑇!"=0.5 𝑇!+𝑇!"# (2)
3. RESULTS AND DISCUSSIONS
3.1. The modes
During field measurement, the occupants in B2 opened windows while using air conditioning. Initially this could be seen as adaptive behavior in an air-conditioned building, but it may also categorizes this building as using “concurrent mixed mode” ventilation. According to CBE definitions, concurrent mixed-mode is air-conditioning system and operable windows operate in the same space and at the same time [21]. Because B2 was recorded to have opened windows during field measurement, it is
assumed that the occupants use natural ventilation simultaneously with air conditioning. From this realization we decided to differentiate the four air-conditioned buildings into Mixed-Mode (MM): office B2; and Cooling (CL): office B1, S1, and S2.
3.2. Evaluation of thermal environment
Thermal environment data in both outdoor and indoor space of each buildings were compiled and analysed. Mean outdoor temperatures ranged between 27.2 to 30.1°C in Bandung, closely mirroring Singapore’s 27.0 to 30.3°C. Indoor air temperature in office S1 Singapore which was using centralized AC system showed an average minimum temperature of 21.6°C, 3 degrees lower than the mean indoor air temperature for all offices. The highest mean indoor temperature recorded was 27.7°C in office B2, Bandung, which used split-unit AC together with operable windows. Globe temperature were recorded to be slightly higher than air temperature had an average value of 25°C (Table 4). Average air velocity in all offices were less than 0.20 m/s, as expected in indoor condition.
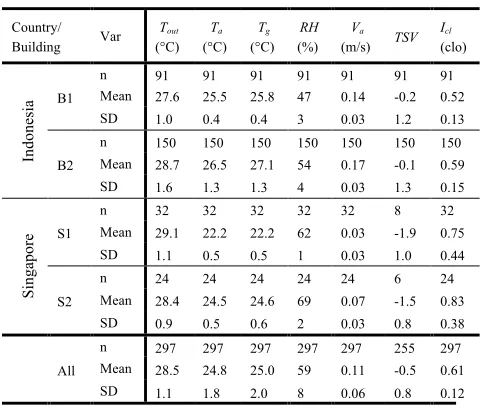
Table 4 Mean and standard deviation of objective and subjective evaluation data
Country/ Building Var
Tout
(°C) Ta
(°C) Tg
(°C) RH (%)
Va
(m/s) TSV Icl
(clo)
In
do
ne
si
a B1
n 91 91 91 91 91 91 91
Mean 27.6 25.5 25.8 47 0.14 -0.2 0.52
SD 1.0 0.4 0.4 3 0.03 1.2 0.13
B2
n 150 150 150 150 150 150 150
Mean 28.7 26.5 27.1 54 0.17 -0.1 0.59
SD 1.6 1.3 1.3 4 0.03 1.3 0.15
Si
ng
ap
or
e S1
n 32 32 32 32 32 8 32
Mean 29.1 22.2 22.2 62 0.03 -1.9 0.75
SD 1.1 0.5 0.5 1 0.03 1.0 0.44
S2
n 24 24 24 24 24 6 24
Mean 28.4 24.5 24.6 69 0.07 -1.5 0.83
SD 0.9 0.5 0.6 2 0.03 0.8 0.38
All
n 297 297 297 297 297 255 297
Mean 28.5 24.8 25.0 59 0.11 -0.5 0.61
SD 1.1 1.8 2.0 8 0.06 0.8 0.12
Tout: Outdoor air temperature, Ta: Indoor air temperature, Tg: Globe
temperature, RH: Indoor relative humidity, Va: Air velocity, TSV: Thermal
sensation vote, Icl: Clothing insulation value, n: Number of sample, SD:
Standard deviation
To investigate the relation between indoor air temperature and the other 3 thermal index: globe temperature, mean radiant temperature, and operative temperature; correlation coefficients were calculated. They are all equal to one, indicating all of them are significantly correlated (Table 5). Unlike Tmrt and Topwhich were obtained from calculation,
Ta and Tg were directly measured with instruments. As
representative, Fig. 3 shows scatter-plot between Ta and Tg.
There is almost no difference between them, except the linear regression line was slightly tilted because Tg usually
a bit higher than Ta. From regression analysis we obtained
the following equation to predict Tg by Ta:
𝑇!=1.072 𝑇!−1.469
n: Number of sample, R2: Coefficient of determination, S.E.: Standard Error of the regression coefficient, p: Significant level of regression coefficient.
Table 5 Correlation coefficients of Ta and other thermal index
Mode Items Ta: Tg Ta: Tmrt Ta: Top
CL (B1,S1,S2)
r 1.00 0.99 0.99
n 147 147 147
MM (B2)
r 1.00 0.98 1.00
n 150 150 150
CL: Cooling, MM: Mixed-mode, Ta: Indoor air temperature, Tg: Globe temperature, Tmrt: Mean radiant temperature, Top: Operative temperature, r: Correlation coefficient,
n: Number of sample. Note: all correlation coefficients are significant (p<0.001)
Fig. 3 Relation between globe temperature and indoor air temperature
3.3. Evaluation of thermal sensation
Individual votes of occupants thermal sensation were taken as an average value from each buildings and categorized into modes. Mean TSV from all buildings was -0.5, with 0.77 standard deviation (Table 4). According to ISO 7730-2005, this is classified as category B, where predicted mean vote (PMV) is in between ±0.5 and percentage of dissatisfied occupants is predicted to be less than 10% [22]. However by analyzing each building’s daily results separately, most of the average votes are negative on the 7 point scale, indicating that respondents experience cool thermal sensations overall. The lowest was -1.9 from office S1 with mean clothing insulation value 0.75 clo and 0.12 clo standard deviation. The only positive average TSV values were from first and third measurement sessions in office B2 Bandung, 0.74 and 0.11 when average Ta were at
27.7°C and 27.1°C. TSV from each modes was correlated to all thermal index, and the results on Table 6 shows that correlation coefficient in CL mode were the same, 0.40 for all indexes. Compared to CL, results from MM respondents shows higher correlation coefficient between TSV and 4 thermal index, with only slight differences between each index.
Table 6 Correlation coefficients of TSV and 4 thermal index
Mode Items TSV: Ti TSV:Tg TSV:Tmrt TSV:Top
CL (B1,S1,S2)
r 0.40 0.40 0.40 0.40
n 105 105 105 105
MM (B2)
r 0.53 0.54 0.52 0.53
n 150 150 150 150
CL: Cooling, MM: Mixed-mode, Ta: Indoor air temperature, Tg: Globe
temperature, Tmrt: Mean radiant temperature, Top: Operative temperature, TSV:
Thermal sensation vote, r: Correlation coefficient, n: Number of sample. Note: all correlation coefficients are significant (p<0.001)
3.4. Comfort temperature
Neutral temperature refers to the air temperature, which on average, a large sample of people would feel “just right” or “neutral” [23]. In this study neutral temperature is referred to as comfort temperature, because both require occupants’ neutral thermal comfort vote. As seen on Table 3, the range of climatic parameters were quite narrow and it would be unreliable to use the regression method with TSV results [20]. Another way to calculate comfort temperature based on actual votes is by using the Griffiths’ method [20], [24], [25]:
𝑇!=𝑇+(0−𝑎𝑇𝑆𝑉) (4)
Tc indicates comfort temperature (°C), expressed in four
thermal indices, by substituting the T which is temperature (°C) with Ta, Tg, Tmrt, and Top; to obtain Tci, Tcg, Tcmrt, and
Tcop accordingly. a indicates Griffith’s constant, which is
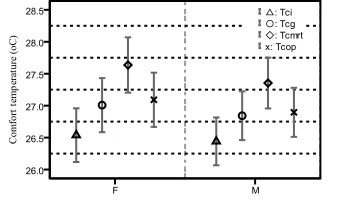
the rate of thermal sensation change with room temperature. In this case 0.5 is used as the constant, as applied by Humphreys et al. at 7-point thermal sensation scale [25]. All individual votes and temperature data were substituted into the equation to calculate individual comfort temperatures. Average comfort air temperature (Tci) in
Bandung offices were 26°C in B1 and 26.8°C in B2; while in Singapore it was 25.6°C in S1 and 26.7°C in S2 respectively. As seen on Fig. 4, there are negligible differences between comfort temperatures by gender. Most error bars of each index overlap each other except for Tcmrt
and Tci of male respondents.
Fig. 4 Average comfort temperatures by gender, with 95% confidence interval
3.5. Comparison of comfort temperatures by modes
Table 7 Average comfort temperatures in CL and MM
Mode
(Building) Variable n Mean (°C) SD (°C)
CL (B1,S1,S2)
Tci 105 26.0 2.3
Tcg 105 26.3 2.3
Tcmrt 105 26.6 2.3
Tcop 105 26.3 2.3
MM (B2)
Tci 150 26.8 2.2
Tcg 150 27.4 2.2
Tcmrt 150 28.1 2.2
Tcop 150 27.5 2.2
CL: Cooling, MM: Mixed-mode, Tca: Comfort air temperature, Tcg: Comfort
globe temperature, Tcmrt: Comfort mean radiant temperature, Tcop: Comfort
operative temperature, n: Number of sample, SD: Standard deviation
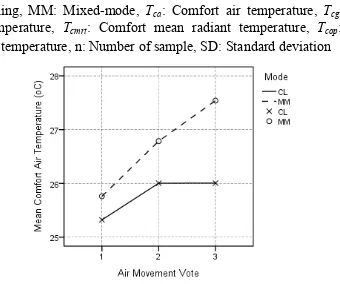
Fig. 5 Comparison of mean comfort temperature and mean air movement votes by modes
Because the windows are opened, it is possible that the occupants sensed higher air movement speed. This is in spite of the instruments recording air velocities of lower than 0.20 m/s, which could be due to the limited number of instruments, being positioned in the centre of the room and away from the windows at the perimeters. From Fig. 5, air movement vote seems to have positive correlation with comfort temperature in mixed-mode operation, but not as significant in fully air-conditioned operation. Even though in mixed mode (window-opening), there is no vote for “4. Strong air movement”, but there are votes for “1. No air movement” (refer to Table 3).
3.6. Comparison of comfort temperature with related guideline and standard
So far there is no adaptive international standards to define comfort temperature zones for heated or cooled modes, since outdoor air inflitration is assumed to be minimized. There is still a correlation found between indoor and outdoor air temperature in buildings with HVAC systems [28], [29]. Normally people adapt to their regional thermal environments as well as their accomodations and working places. An adaptive comfort temperature zone by CIBSE guidelines for heated or cooled ventilation mode is used to compare the results of this study, as shown in Equation (5) [29].
𝑇!"#$=0.09 𝑇!"+22.6 (5)
Tcomf is comfort temperature (°C) and Trm is outdoor daily
running mean temperature (°C). Results from equation (5), including ±2𝐾 upper and lower limits were plotted on Fig. 6. The comfort air temperature and comfort globe
temperature in this study was plotted based on mean outdoor temperature during field measurement hours. Most of this study’s datapoints fall within these limits, but those indicating higher comfort temperates can be attributed to regional differences, due to the CIBSE’s European database.
Fig. 6 Comparison of individual mean comfort temperatures with CIBSE Guide
There is no local standards about thermal comfort in office buildings in Indonesia, while Singapore uses a standard regulation SS 554:2009, which recommends indoor operative temperature between 24 to 26°C, with an acceptable limit of at least 8 hours [30]. In comparison with the standard, comfort temperatures in S1 and S2 falls within the acceptable limit stipulated for operative temperature. However overcooling issues seems apparent at these buildings, especially office S1 where the occupants have fewer adaptive options. The mean indoor air temperatures recorded to be the lowest compared to other buildings, while the mean of clothing insulation values were rather high in comparison to others. On side note, the design of building façade might also affect its default indoor condition. As listed on Table 1, all subject buildings in this study use curtain walls on its façade, except for B2, which uses operable glass windows and overhang roof, the latter useful for sunshading in tropical climates. These features possibly has made it possible for the B2 office to be occasionally operated in free running mode.
4. CONCLUSIONS
A combined analysis of thermal comfort case study of air-conditioned office buildings in Bandung and Singapore leads to these findings:
• Air temperature, globe temperature, mean radiant temperature, and operative temperature has no significant difference in expressing comfort temperature with Griffiths’ method. From this result we concluded it is safe to use only one of these indexes, because of the lack of difference between them.
• By grouping the buildings into mixed mode (MM) and cooling (CL), occupants of mixed mode has slightly higher operative comfort temperature between 25.3 – 29.7°C; while in cooling mode, operative comfort temperature was between 24.0 – 28.6°C. There is an indication of overcooling case in fully air-conditioned mode.
20 22 24 26 28 30 32
26 27 28 29 30
Com
fort
te
m
p. (°
C)
Running mean outdoor temp. Trm (°C) Comfort Temp. Zone (CIBSE Guide) Comfort air temp.
• Compared to relevant guidelines by CIBSE, about half of the mean individual comfort temperatures fell above the upper limits. Since CIBSE guide was developed based on European data, this means comfort temperature might be affected by different characteristics of tropical climates, despite of HVAC system in the buildings.
ACKNOWLEDGEMENTS
We would like to thank all people who participated in the survey, also management staffs of CIMB Niaga and ITB. First author developed this paper during the stay at Tokyo City University as a researcher, on attachment program funded by JAIF. This research was financially supported by Grant-in-Aid from AUN/SEED Net Collaborative Research Program (4B155) from JICA.
REFERENCES
[1] Suruhanjaya Tenaga Energy Commission, Malaysia
Energy Statistics Handbook. 2014.
[2] T. H. Karyono and G. Bahri, “Energy efficient strategies for JSX building in Jakarta , Indonesia,” in International Conference “Passive and Low Energy Cooling for the
Built Environment,” 2005, pp. 207–211.
[3] M. Haneda, “Workplace productivity and environmental impacts of Cool Biz office,” 2010.
[4] L. C. Lau, K. T. Tan, K. T. Lee, and A. R. Mohamed, “A comparative study on the energy policies in Japan and Malaysia in fulfilling their nations’ obligations towards the Kyoto Protocol,” Energy Policy, vol. 37, no. 11, pp. 4771–4778, 2009.
[5] S. Tanabe, Y. Iwahashi, S. Tsushima, and N. Nishihara, “Thermal comfort and productivity in offices under mandatory electricity savings after the Great East Japan earthquake,” Archit. Sci. Rev., vol. 56, no. 1, pp. 4–13, Feb. 2013.
[6] World Green Building Council, “Health, Wellbeing & Productivity in Offices,” London; Athens; Sydney; Manila; Sofia; Bogota, 2014.
[7] S. Schiavon and K. H. Lee, “Dynamic predictive clothing insulation models based on outdoor air and indoor operative temperatures,” Build. Environ., vol. 59, pp. 250–260, Jan. 2013.
[8] S. C. Sekhar, “Thermal comfort in air-conditioned buildings in hot and humid climates - why are we not getting it right?,” Keynote Indoor Air 2014, 2015. [9] W. T. D. Chan, J. Burnett, R. J. de Dear, and C. H. S. Ng,
“A large-scale survey of thermal comfort in office premises in Hong Kong,” ASHRAE Trans., pp. 1172– 1180, 1998.
[10] K. W. H. Mui and W. T. D. Chan, “Adaptive comfort temperature model of air-conditioned building in Hong Kong,” Build. Environ., vol. 38, no. 6, pp. 837–852, Jun. 2003.
[11] A. C. K. Lai, K. W. Mui, L. T. Wong, and L. Y. Law, “An evaluation model for indoor environmental quality (IEQ) acceptance in residential buildings,” Energy Build., vol. 41, no. 9, pp. 930–936, 2009.
[12] M. C. Lee, K. W. Mui, L. T. Wong, W. Y. Chan, E. W. M. Lee, and C. T. Cheung, “Student learning performance and indoor environmental quality (IEQ) in air-conditioned university teaching rooms,” Build.
Environ., vol. 49, pp. 238–244, Mar. 2012.
[13] S. C. Sekhar, K. W. Tham, and D. Cheong, “Ventilation characteristics of an air-conditioned office building in Singapore,” Build. Environ., vol. 37, no. 3, pp. 241–255, Mar. 2002.
[14] M. Kottek, J. Grieser, C. Beck, B. Rudolf, and F. Rubel, “World Map of the Köppen-Geiger climate classification updated,” Meteorol. Zeitschrift, vol. 15, no. 3, pp. 259– 263, Jun. 2006.
[15] Bureau of Statistics, “Bandung Dalam Angka (Bandung in Numbers),” Press release, 2003. [Online]. Available: http://www.bandung.go.id/. [Accessed: 26-Jan-2015]. [16] Meteorological Services Division National
Environmental Agency, “Records of Climate Station Extreme,” 2012. [Online]. Available: http://www.nea.gov.sg/. [Accessed: 26-Jan-2015]. [17] ASHRAE, ANSI/ASHRAE Standard 55-2010. Atlanta,
Atlanta: American Society of Heating, Refrigerating and Air-Conditioning Engineers, Inc., 2010.
[18] S. Thorsson, F. Lindberg, I. Eliasson, and B. Holmer, “Different methods for estimating the mean radiant temperature in an outdoor urban setting,” vol. 1993, no. October, pp. 1983–1993, 2007.
[19] ASHRAE, ASHRAE Handbook: fundamentals, SI. Atlanta, GA: American Society of Heating, Refrigerating and Air-Conditioning Engineers, Inc., 2005.
[20] F. Nicol, M. A. Humphreys, and S. Roaf, Adaptive
thermal comfort : principles and practice. London ; New
York: Routledge, 2012.
[21] Center for the Built Environment (CBE) - University of California Berkeley, “About Mixed-Mode,” 2013.
[Online]. Available:
http://www.cbe.berkeley.edu/mixedmode/aboutmm.html. [Accessed: 20-Mar-2015].
[22] ISO 7730, “Ergonomics of the Thermal Environment - Analytical Determination and Interpretation of Thermal Comfort Using Calculation of the PMV and PPD Indices and Local Thermal Comfort Criteria,” vol. 3rd ed., pp. 605–615.
[23] R. Hyde, Climate responsive design : a study of buildings
in moderate and hot humid climates, First Edit. London:
E & FN Spom, 2000.
[24] I. Griffiths, “Thermal comfort in buildings with passive solar features: Field studies,” Rep. to Comm. Eur.
Communities, vol. EN3S-090, 1990.
[25] M. A. Humphreys, H. B. Rijal, and J. F. Nicol, “Updating the adaptive relation between climate and comfort indoors; new insights and an extended database,” Build.
Environ., vol. 63, pp. 40–55, May 2013.
[26] K. Ridge, “Thermal comfort in the humid tropics: Field experiments in air conditioned and naturally ventilated buildings in Singapore,” pp. 259–265, 1991.
[27] R. Daghigh, N. Adam, K. Sopian, and B. Sahari, “Thermal comfort of an air-conditioned office through different windows-door opening arrangements,” Build.
Serv. Eng. Res. Technol., vol. 30, no. 1, pp. 49–63, 2009.
[28] R. De Dear, “A global database of thermal comfort field experiments,” ASHRAE Trans. Symp., vol. 104, no. 7, pp. 1141–1152, 1998.
[29] M. A. Humphreys and J. F. Nicol, “Chapter 1, Environmental Criteria for Design,” in Environmental
Design: CIBSE Guide A, London, UK: CIBSE, 2006.
[30] SPRING Singapore, SINGAPORE STANDARD SS 554 :
2009 Indoor air quality for air-conditioned buildings.