78:1 (2016) 175–179 | www.jurnalteknologi.utm.my | eISSN 2180–3722 |
Jurnal
Teknologi
Full Paper
FACTORS IDENTIFICATION ON OPTIMIZATION
OF BALL PLACEMENT TOOL FOR
FLIP-CHIP-BALL-GRID-ARRAY PRODUCT
Annuar Ismail
a, Rozzeta Dolah
a, Zenichi Miyagi
ba
UTM Razak School of Engineering and Advance Technology,
Universiti Teknologi Malaysia, Jalan Semarak, Kuala Lumpur,
Malaysia
b
Department of Mechanical Engineering, Meiji University, 1-1-1
Higashi-Mita, Tama-Ku, Kawasaki-Shi, Kanagawa-Ken,
214-8571 Japan
Article history Received 30 March 2015 Received in revised form
27 May 2015 Accepted 15 December 2015
*Corresponding author
[email protected]
Graphical abstract
Abstract
Market demand on system-on-chip (SoC) using ball-attach technologies, it is time for ball-attach module to have an improvement on their capabilities within limited resources (man and machine). This paper identifies caused of factor which contributes more time to production time. Justification on improving ball-attach module cycle time during high volume activities is explained.
Keywords: Ball-attach, product conversion, equipment optimization
Abstrak
Permintaan pasaran terhadap SoC menggunakan technologi ball-attach, inilah masanya modul ball-attach harus memperbaiki keupayaannya di dalam sumber yang terhad (manusia dan mesin). Di dalam kertas ini, kita akan tentukan kesan-kesan faktor yang menyumbang lebihan masa kepada waktu pengeluaran. Apakah justifikasi untuk memperbaiki kitaran-masa pada modul ball-attach ini semasaaktiviti pada pengeluaran yang tinggi.
Kata kunci: Ball-attach, penukaran product, mengoptimumkan kelengkapan
© 2016 Penerbit UTM Press. All rights reserved
1.0 INTRODUCTION
The improvement manufacturing system in
semiconductor is needed to enhance each process and equipment. For semiconductor industry with micro sensitive product, the system also requires to improve its capability during high volume production demand with multiple of product that also need to suit with limited equipment and operation [1].
In this paper, problem statement focused on system-on-chip (SoC) using ball-grid-array (BGA) as part of surface-mounted-technology (SMT) increasing their demand by most processor’ manufacturer [2].
proposing unnecessary activities to eliminate as change-over (conversion) reduction strategy. Remain issue in ball-attach module is equipment is giving low run-up time (available time for production), the engineering solution have to define the root cause and rectified for long term solution.
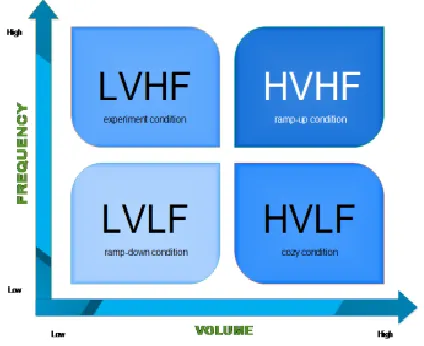
Figure 1 Matrix diagram on relation between production volume and change-over frequency
This paper will conduct data studies for routine downtime activity for ball-attach module operation to define the case. Next, the conclusion will be made as summary from the study.
2.0 EXPERIMENTAL
Ball-attach-module operation is an example of surface-mount-equipment (SME) process and module for identified potential improvement.
Figure 1 matrix of relation between production volume and change-over frequency in ball-attach-module production mode is defined using the matrix applied in Table 1 below to understand the time used for production suits with change-over or conversion activities collect from not-running time record log. Both Figure 1 and Table 1 also explain on ball-attach modules during not-running time by certain production situation where the production volume is determined by the number of process carrier which is similar type like Auer Boat [6] that manage daily running.
Some of manufacturing companies define this as high volume which has high mixed to presume a high number of product type. But Table 1 in this paper particularly using a different approach of definition about high frequency compared with high mixed. High mixed describe about multiple product type, but the high frequency could be a multiple batches of a single product type and activities. Thus in this paper, the constructed matrix explains:
1) HVHF is “High Volume, High Frequency” means where the production loading is more 1250 process carriers and the number of product conversion is more than 2 time per shift this condition define as very busy situation;
2) LVHF “Low Volume, High Frequency” means where the production loading below average or less than 625 process carriers and but the number of product conversion activity remain high, this condition define as engineering evolution and sampling test activities;
3) HVLF “High Volume, Low Frequency” means where the production loading is more than 1250 process carriers and the product conversion is less, in this condition is define as very stable situation; while
4) LVLF “Low Volume, Low Frequency” means less production loading and less product conversion, in this condition is define as very less activity.
Table 1 Distribution of “not-running activity” utilized time during production loading
HVHF LVHF HVLF LVLF Sum.
(hrs.) Mean (hrs.) Cumulative (%) Min.
(hrs.) Max. (hrs.) (hrs.) Min. Max. (hrs.) (hrs.) Min. Max. (hrs.) (hrs.) Min. Max. (hrs.) Schedule: product conversion
time 2.50 7.00 2.50 7.00 2.50 3.50 2.50 3.50 31.00 3.88 46%
Schedule: setup time 1.00 3.00 0.50 3.00 0.50 1.50 0.50 1.50 11.50 1.44 64% Unscheduled: down-time 1.00 2.50 1.00 2.00 1.00 2.00 0.30 1.50 11.30 1.41 81% Schedule: house-keeping 0.50 1.50 0.50 1.50 0.50 1.00 0.50 1.00 7.00 0.88 91% No operator 0.50 1.00 0.50 1.00 0.50 1.00 0.50 1.00 6.00 0.75 100% Note: HV Above 1250 numbers of process carriers per product.
LV Below 625 numbers of process carriers per product.
Figure 2 is constructed to define the contribution from the not-running time running for 1 working shift within 12 hours in ball-attach module is a scheduled product conversion is giving (3.88 hours for single activities) 46 percent more than others including unscheduled equipment downtime. It could return in double utilized production running time if took more than one product conversion activities per equipment.
Even if consider conversion time during LFLF at Table 1 during ramp-down production period, product change-over (conversion) still contribute high lack of production available time. In this stage, conversion time is significant factor as priority to improve conversion activities. The next part of this paper investigates the potential equipment tools at ball-placement module.
3.0 RESULTS AND DISCUSSION
3.1 Define Loss of Not-Running Time Activities
In this part, the root-cause and contribution factors that contribute to product conversion time which highly utilize more hours for not-running time activities is investigated.
Sub-module in ball-attach assembly has 3 process step, there are 1) Fluxing, 2) Ball Placement and then 3) Reflow oven. During conversion all process have to going through product change-over activities according to product specification require to use including removing and installing part, calibration, setup and buy-off. But in this paper processes involved flip-chip-grid-array (FCBGA) package on ball-placement equipment is focused. From the other sub-module, ball-attach process has ball placement assembly equipment that requires specifically
hardware product tool to install manually.
Figure 2 Not-running activities utilized time during production loading with-in 1 working shift (12 hours) in ball-attach module
At this stage ball-placement equipment capabilities determine by cycle time in this case we are using talk-time as a method,
Let “Ta” is total available time is 10.2 hours per shift = 612 minutes; and “D” is product demand per shift = 625 carrier per equipment.
𝑇 =𝑇𝑎
𝐷 =
612
625 = 0.9792 minutes per carrier (1)
The variable time in takt-time equation (1) is measuring total available time 85% of equipment up-time of total equipment running.
𝐷 =𝑇𝑎
𝑇 =
(612 − 120)
0.9792 = 502 carrier per shift (2)
Then equation (2) showed 2 hours taken to perform product change-over then carrier producing less due to activities. This 2 hours allocated by manufacturing Industrial Engineering (IE) as current standard practice for ball-attach module product change-over time. If the time extend, the available time become less and the same time it could less your productivity. Both equations formulated a liner graph, the higher non-production such as product change-over time used then less production carrier produced.
In this paper, preventive maintenance activity is not under study because it is the periodic tasks. On the other hand, product change-over activities is used due to high occurrence in daily routine task. In this paper, it can only be suggested that the equipment of preventive maintenance could understate their time allowed high run-up period during ramp-up period.
3.2 Factor Identification on Prolong Activity of Ball-Placement Equipment
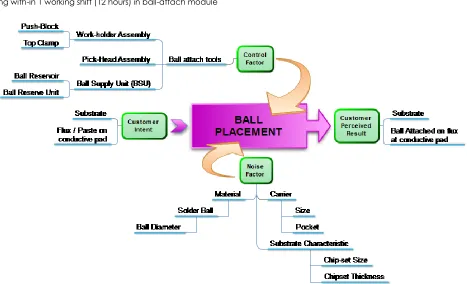
To identify which factor that contributed, the analyses begin with isolating which part involved in the process. Identify which is requiring for substrate needs ball attach to printing flux on conductive pad after ball-placement process.
Figure 3 shown ball-placement equipment contain few tool define as control factor and noise factor is the process applied to make SMT substrate attaching ball onto conductive pad. The next experiment should avoid noise factor involve with product specification likely with product reliability and quality. In this project we’ll not disturb product architecture that already been predetermine.
From information just related with control factor that most of the equipment product tool is involved in change-over time analysis. In this experiment, we involved all technicians (8 respondents) in particular ball-attach operation participate during every conversion and analysis uninstall and install duration time. The analysis actually needs to understand gap and variance of time by individual performance. That assessment on human is technically measuring on human ability that working method.
Figure 4 Distribution of time during ball-placement product change-over activity
Figure 4, is a base-finding on individual time assessment on product change-over by equipment technicians. The activity shows slightly isolated distribution, within normal gap between ~3 minutes. The engineering report attached with conversion may cause by product tooling failure such as damage or unpaired product it could take few minutes to replace the part. The gap of skill is found very minimum on the factor of human. It was irrelevant to justify the product change-over is caused by skilled or experience person. Another related 5M+E factor such as material and measurement is not being covered with radar troubleshooting as it is not interfere the predetermine product specification that has already been defined for customer. A couple with environmental factor has no sign of information that can cause product change-over extend time.
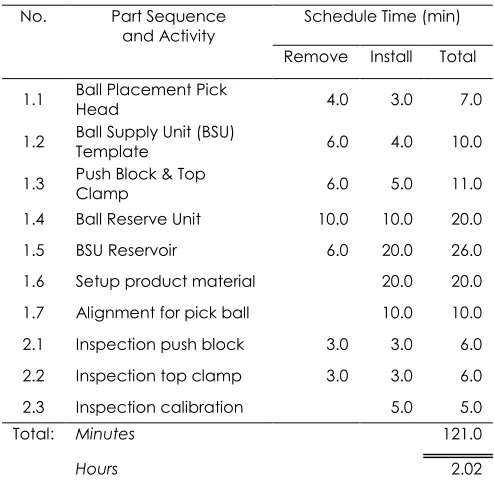
Table 2 Ball-placement equipment part and activity during product change-over
No. Part Sequence
and Activity Schedule Time (min)
Remove Install Total
1.1 Ball Placement Pick Head 4.0 3.0 7.0
1.2 Ball Supply Unit (BSU) Template 6.0 4.0 10.0
1.3 Push Block & Top Clamp 6.0 5.0 11.0
1.4 Ball Reserve Unit 10.0 10.0 20.0 1.5 BSU Reservoir 6.0 20.0 26.0 1.6 Setup product material 20.0 20.0 1.7 Alignment for pick ball 10.0 10.0 2.1 Inspection push block 3.0 3.0 6.0 2.2 Inspection top clamp 3.0 3.0 6.0 2.3 Inspection calibration 5.0 5.0
Total: Minutes 121.0
Besides that, another 5M+E analysis factor toward machine and method portion has been conducted. Thus, we use the same data collection on every technician during product change-over activity. We have to identify which potential part and activity that contribute to high non-production time for ball-placement equipment.
Table 2 listed parts and activities such as calibration or alignment which have to perform during product change-over. Total estimated time is about ~2 hour’s maximum for conversion activity as explained in part 3.1 above. The individual assessments also conclude which are the most factors in ball-placement activity taken more time for certain product conversion. From that assessment, high assist time on part of change-over activity has been studied.
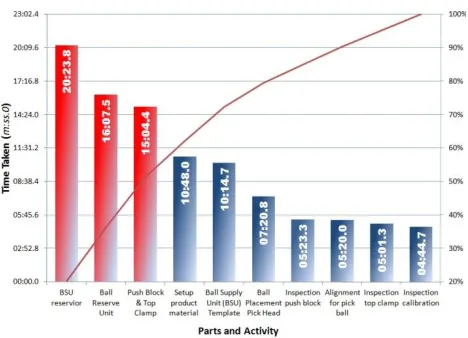
In Figure 5, the Pareto shows BSU-Reservoir is giving 26 minutes, followed by Ball-Reserve Unit and Push-Block & Top-Clamp assembly in Ball-Placement equipment is above 60% total time take during activity. Despite of total mean time (1:40:28.5) captured within allowable time of 2 hours, the kaizen engineering need to look into current situation giving lack of available time for production.
Figure 5 Time capture for each activity by part change during product change-over in ball-placement equipment
Base on Figure 5, the assessment defined high assist change-over time is identified from the observation and engineering report, which are:
1) Ball Reservoir physically has a complicated installation on solder ball tubing factor during conversion due to each product variability on type of solder ball size. To avoid quality impact that related with product material requirement, BSU need to be exchanged each time of conversion activity.
2) BSU reservoir unit which is the assembly part to prepare the solder inside BSU template, which means the template have to align sweeper height.
3) Push-block & Top-clamp is to hold the carrier during ball-placement process. The factor defined in the assembly is number of pocket with the edge mechanical part of tooling assembly.
All of the assembly tools that have been identified above are relevant to optimize the current high change-over time. Besides the above assembly tool, the observation also being done based on the assessment on technician found in respondent who face ergonomic difficulty and complicated part. It could relate with design and method of product conversion kit to adapt with multiple product during high volume production.
4.0 CONCLUSION
From the assessment for tools and process of ball-placement equipment product current change-over or product conversion found the BSU reservoir, ball-reserve unit and push block &top clamp is a most contributed part involved in dragging the conversion time.
This study is pre-matured construction on engineering solution to gain more available time (Ta) in optimizing the compromising multiple product with vary production mode. Once the equipment utilization increase, the cycle time is expected to be reduced, thus less production cost on ball-attach process is achieved. In this paper, equipment efficiency improvement is done on processes and not modifying the product specification.
This paper has lead to the next following project which is to define a suitable solution by using the robust design methodology, working method and application for ball-placement tools and processes to overcome this issue. The assessment found in robust design methodology can be used to narrow down the real problem in ball-attach module where the noise and control factor has been identified from quality control (QC) tools from this paper.
References
[1] Rozzeta Dolah, Hamidon Musa, Astuty Amrin. 2011. Etching Performance Improvement on Semiconductor Silicon Wafers with Redesigned Etching Drum. Jurnal Teknologi. 55: 53-65.
[2] Ryan Cohen & Tao Wang. 2014. The Low-Power Design of Android Application and Intel Graphics Performance Analyzers (Intel GPA): Assisted Power Optimization. In R. C. Wang, Android Application Development for the Intel Platform New York, USA: Heinz Weinheimer. 449.
[3] Lattice Semiconductor Corporation. 2010. Low Cost Board Layout Techniques for Designing with PLDS in BGA Package. Oregon, USA: A Lattice Semiconductor White Paper. [4] Appa Iyer Sivakumar, Chin Soon Chong. 2001. A Simulation
Based Analysis of Cycle Time Distribution, and Throughput in Semiconductor Backend Manufacturing. Computer in Industry. 59-78.
[5] Pablo Guzmán Ferradás, Konstantinos Salonitis. 2013. Improving Changeover Time: A Tailored SMED Approach for Welding. SciVerse Science Direct. 598-603.