ABSTRACT
SENTHIL PRABU, NIVAS PRABU. Determining Recycled Asphalt Binder Limits Contributed by Recycled Asphalt Pavement. (Under the direction of Dr. Paul Khosla.)
As pavement materials and construction costs continue to increase, there is a strong interest from the agencies and industries to develop ways to include more recyclable materials in asphalt pavements. With both cost savings and sustainability in mind, the NCDOT has increased allowances for recycled materials in hot mix asphalt (HMA) in the past few years. Recycled asphalt pavement (RAP) is one of the most abundantly used recycled materials in North Carolina.
Determining Recycled Asphalt Binder Limits Contributed by Recycled Asphalt Pavement
by
Nivas Prabu Senthil Prabu
A thesis submitted to the Graduate Faculty of North Carolina State University
in partial fulfillment of the requirements for the degree of
Master of Science
Civil Engineering
Raleigh, North Carolina 2013
APPROVED BY:
_______________________________ ______________________________ Dr. N. Paul Khosla Dr. Akhtarhusein A.Tayebali
DEDICATION Dedicated with love
BIOGRAPHY
ACKNOWLEDGMENTS
I would like to express my sincerest gratitude to my advisor, Dr. Paul Khosla for his excellent guidance and for providing me with excellent atmosphere for doing research. I would also like to thank Dr. Akhtar Tayebali for his continued support and encouragement during my research and testing. I also thank Dr. Shamim Rahman for his support and guidance as a member of my master’s advisory committee.
I would like to thank my colleague and project partner, Srikanth Ramoju, who as a good friend was always willing to help and give his best suggestions. Without his contribution, this project would not have been successful.
I would like to thank the North Carolina Department of Transportation for funding this project and giving me an opportunity to work on this research. Special thanks to Mr. James Budday, Mrs. Annie Jeng and the staff from North Carolina Department of Transportation for their assistance throughout my research. I would also like to thank Dinesh Ayyala and Haritha Malladi for helping me to get used to working in the lab environment when I joined the university as a new student.
TABLE OF CONTENTS
LIST OF TABLES... vii
LIST OF FIGURES ...x
1.0 CHAPTER ONE: Introduction ...1
1.1 Introduction and Problem Statement ...1
1.2 Research Objectives...2
1.3 Research Methodology & Tasks...3
1.3.1 Task 1 Materials Acquisition and Characterization...3
1.3.1.1 Task 1.1 RAP Stockpile Site Selection and Sample Procurement...3
1.3.1.2 Task 1.2 Determining Asphalt Binder Content by Ignition Oven Method...4
1.3.1.3 Task 1.3 Aggregate Gradation ...4
1.3.1.4 Task 1.4 Virgin Material Selection and Sample Procurement...4
1.3.2 Task 2 Performance Grade Testing...5
1.3.3 Task 3 Mix Design...6
1.3.3.1 Task 3.1 Design of Mixtures Containing 100% Virgin Material...7
1.3.3.2 Task 3.2 Design of Mixtures Containing Various Percentages of Recycled Materials...8
1.3.4 Task 4 Performance Testing ...8
1.3.4.1 Task 4.1 Dynamic Modulus Test ...9
1.3.5 Task 5 Mixture Characterization ...9
1.3.5.1 Task 5.1 Pavement Performance Prediction ...9
1.3.6 Task 6 Economic Analysis...10
2.0 CHAPTER TWO: Literature Review ...14
3.0 CHAPTER THREE: Binder Characterization & Blend Charts...45
3.1 Performance Grade Testing ...45
3.2 Development of Blend Charts...50
4.2 Mix Design Involving Virgin and RAP Materials...68
5.0 CHAPTER FIVE: Performance Testing...74
5.1 Samples Preparation...74
5.2 Dynamic Modulus Test...75
6.0 CHAPTER SIX: Mixture Characterization ...81
6.1 Pavement Performance Prediction...81
7.0 CHAPTER SEVEN: Economic Analysis ...85
7.1 Material Costs ...86
7.2 Initial Construction Costs of Pavements...87
7.3 Rehabilitation Costs of Pavements ...89
7.4 Salvage Value of Pavements...90
7.5 Present Worth Analysis...92
8.0 CHAPTER EIGHT: Conclusions & Recommendations...94
8.1 Binder Characterization Conclusion ...96
8.2 Dynamic Modulus Test Conclusion...97
8.3 Pavement Performance Conclusion ...98
8.4 Economic Analysis Conclusion ...100
8.5 Major Conclusions...100
8.6 Recommendations...102
REFERENCES ...104
LIST OF TABLES
Table 2.1 Minimum and Maximum Percentage of RAP Binder
Required to Satisfy all PG 64-22 Specifications...18
Table 2.2 Fatigue Life of Simulated Pavements by Asphalt Institute ...20
Table 2.3 Loading Cycle to Rutting Failure for Simulated Pavements Using Asphalt Institute Model...21
Table 2.4 Mixtures ETG Guidelines for RAP ...25
Table 2.5 Mix Design Gradations for Virgin and Recycled Mix ...26
Table 2.6 Design Parameters for Virgin and Recycled Mixes...27
Table 2.7 Properties of Virgin and Recycled Mixes at 4% Air Void Content...28
Table 2.8 Mixture Details ...32
Table 2.9 Asphalt Content and PG Grades of Binder in RAP ...37
Table 2.10 Test Matrix for Materials...38
Table 2.11 Recommended RAP Contents and Asphalt Binders...40
Table 2.12 FRAP Research Mix Matrix ...43
Table 3.1 Asphalt Binder Blend Proportions Used for Performance Grade Testing...46
Table 3.2 Binder Rheological Properties of Original Aged Binders ...46
Table 3.3 Binder Rheological Properties of Original Aged Binders Blends Containing RAP...47
Table 3.4 Binder Rheological Properties of RTFO Aged Binders ...48
Table 3.5 Binder Rheological Properties of RTFO Aged Binder Blends Containing RAP...48
Table 3.6 Binder Rheological Properties of PAV Aged Binders...49
Table 3.8 Minimum Limits of RAP Binders Determined Using Blend Charts of
Original Aged Binders ...53
Table 3.9 Minimum Limits of RAP Binders Determined Using Blend Charts of RTFO Aged Binders...56
Table 3.10 Maximum Limits of RAP Binders Determined Using Blend Charts of PAV Aged Binders...58
Table 3.11 NCDOT Specifications For Performance Grade of Virgin Asphalt Binders to be Used in Mixtures Containing RAP...59
Table 3.12 Limits of RAP By Weight of Total Binder...59
Table 4.1 Aggregate Gradations of Virgin Materials ...62
Table 4.2 Superpave Aggregate Gradations for 9.5B Mixes ...63
Table 4.3 Aggregate Trial Blend Gradations...64
Table 4.4 Proportion of Virgin aggregates Used for Trial Gradations ...64
Table 4.5 Apparent and Bulk Specific Gravities of Virgin Aggregates and Trial Blends...65
Table 4.6 NCDOT Superpave Mix Design Criteria for 9.5B Mix...66
Table 4.7 Mixture Volumetrics for Trial 1 Aggregate Blend ...67
Table 4.8 Reclaimed Aggregate Gradations for RAP and Its Fractions ...70
Table 4.9 Binder Contents of RAP and Its Fractions...70
Table 4.10 Proportions of RAP by Total Weight of Mix and By Weight of Total Binder Replaced ...71
Table 4.11 Proportions of Mixes Containing Virgin and RAP Materials that Satisfies the Volumetric Specifications ...73
Table 5.1 Dynamic Modulus Values of Various Mixtures ...76
Table 6.1 Predicted Performance of Simulated Pavement Systems ...83
Table 7.1 Estimated Initial Service Life of Simulated Pavement Systems...86
Table 7.2 Materials Costs per Ton for Pavement Construction...87
Table 7.4 Initial Construction Costs of Pavements...88 Table 7.5 Rehabilitation Costs and Service Life of Pavements after First
LIST OF FIGURES
Figure 2.1 Blend Chart of Original Aged PG64-22 Binder Containing RAP ...16
Figure 2.2 Blend Chart of RTFO Aged PG64-22 Binder Containing RAP...16
Figure 2.3 Blend Chart of PAV Aged PG64-22 Binder Containing RAP...17
Figure 2.4 RAP Content (%) vs Design Binder (%)...29
Figure 2.5 RAP Content (%) vs VMA (%)...30
Figure 2.6 DSR Test Results @ 64°C, PG58-34 + RAP ...35
Figure 2.7 DSR Test Results @ 64°C, PG58-34 + Millings ...35
Figure 2.8 Change In Complex Modulus With RAP Content, District 6 RAP Mixtures, 25°C, 1 Hz ...39
Figure 2.9 Dynamic Test Data at 20°C and Various Highway Speeds with IDOT Design Range for Northern Illinois...44
Figure 3.1 Blend Chart of Original Aged PG58-28 Binder Blended With Various Proportions of RAP ...52
Figure 3.2 Blend Chart of Original Aged PG64-22 Binder Blended With Various Proportions of RAP ...52
Figure 3.3 Blend Chart of RTFO Aged PG58-28 Binder Blended With Various Proportions of RAP ...54
Figure 3.4 Blend Chart of RTFO Aged PG64-22 Binder Blended With Various Proportions of RAP ...55
Figure 3.5 Blend Chart of PAV Aged PG58-28 Binder Blended With Various Proportions of RAP ...57
Figure 3.6 Blend Chart of PAV Aged PG64-22 Binder Blended With Various Proportions of RAP ...57
Figure 4.1 Virgin Aggregate and Trial Blend Gradations with Control Points ...65
Figure 5.2 Dynamic Modulus (mPa) – Mastercurves of Mixes Containing PG64-22 with Various Percentages of RAP Binder by Weight of Total Binder...79
CHAPTER ONE Introduction 1.1 Introduction and Problem Statement
As pavement materials and construction costs continue to increase, there is a strong interest from both the agencies and industries to develop ways to include more recyclable materials in asphalt pavements. With both cost savings and sustainability in mind, the NCDOT has increased allowances for recycled materials in hot mix asphalt (HMA) in the past few years. The recyclable material that receives the most use in North Carolina is the recycled asphalt pavement (RAP).
content of recycled material is considered.
Paul Khosla at NCSU has recently submitted a draft research report to the NCDOT after completing the project “Effect of the use of Higher Percentages of RAP in NCDOT Hot Mix Asphalt”. In this report, it is concluded that using one binder grade lower than the original binder grade with 40% RAP provided the most economical pavement with a life cycle cost of roughly 33% less than that of the control virgin pavement. This was determined by using the limits of RAP based on the weight of total mixture that they replaced. The effect of RAP on the life cycle costs of pavements when using limits based on the percentage binder
contributed by the RAP, remains to be seen.
1.2 Research Objectives
As different waste materials provide distinctly different types, grades and qualities of binders for recycled mixtures, it is prudent to develop a separate set of specifications for the
allowable limits of RAP that can be used in a mix. With this in mind, this research was set out with the following objectives.
Compare NCDOT’s current specifications to other agencies’ specifications and/or research practices for design of recycled HMA mixes.
Using limits defined by PG grading and HMA mix with various allowable
percentages of RAP binder will be prepared while also ensuring that they meet the superpave volumetric specifications.
Standard tests for performance evaluation will be done using dynamic modulus tests on each mixture samples.
Develop a draft specification utilizing limits for RAP based on recycled binder percentage in the mix.
1.3 Research Methodology and Tasks
1.3.1 Task 1-Materials Acquisition and Characterization
This research task will select and procure the materials needed to complete this study, including the selection and procurement of RAP samples and virgin materials. Once the recycled material samples are obtained, testing will be conducted to characterize the recycled materials in order for their properties to be determined for the purpose of design of mixtures containing the recycled materials later on.
1.3.1.1 Task 1.1 RAP Stockpile Site Selection and Sample Procurement
of quartering and splitting of RAP materials.
1.3.1.2 Task 1.2 Determining Asphalt Binder Content by Ignition Oven Method In this research subtask AASHTO TP 53-95 “Test Method for Determining the Asphalt Content of Hot Mix Asphalt (HMA) by Ignition Method” will be used to determine the amount of asphalt cement binder that RAP contains. This value will be needed during the design of mixtures containing RAP. This method will also yield the aggregate from the RAP materials that will be used to determine their aggregate gradation also needed in the design of mixtures containing RAP in Task 3.
1.3.1.3 Task 1.3 Aggregate Gradation
In order to design asphalt concrete mixtures containing RAP in research Task 3, the
aggregate gradation of the recycled material needs to be determined. This will be completed using the clean aggregate by-product of the ignition method using AASHTO T27-88 “Sieve Analysis of Fine and Coarse Aggregates” and AASHTO T11-90 “Materials Finer than 75µm (No.200) Sieve in Mineral Aggregates by Washing”
1.3.1.4 Task 1.4 Virgin Material Selection and Sample Procurement
granites and limestone. Availability of aggregate in close proximity to North Carolina State University will be another element that will have a deciding factor in the selection of virgin aggregate type as it is more convenient and less costly.
Again, in order to produce the most applicable results for NCDOT, the virgin binder selected will be an actual representation of binders used for asphalt concrete pavements in North Carolina. The two asphalt binder grades most commonly used in North Carolina are PG 64-22 and PG 70-64-22.
Since the binder recovered from the recycled materials will have an increased stiffness from aging, a softer virgin binder grade will be necessary so that the blended binder’s performance grade is not altered due to the stiffness of RAP. For this reason, this research will include virgin binder grades of PG 58-28 and PG 64-22
1.3.2 Task 2 Performance Grade Testing
This research task will investigate the rheological properties of various proportions of
recycled binder with virgin binders using Performance Grade (PG) binder testing. The binder recovered from recycled materials can vary greatly and have a wide range of rheological properties. The amount of recycled materials in mixes can greatly affect the pavement performance, especially fatigue life and thermal cracking due to the increased stiffness from the recycled binder. Hence it is not advisable to arbitrarily set specifications for the allowable amount of recycled materials.
“Quantitative Extraction and Recovery of Asphalt Binder from Hot Mix Asphalt”. The recycled binder will be dissolved and washed from the aggregate using Abson, a strong solvent. The binder will then be reclaimed by heating the mixture and distilling the solvent. AASHTO TP5-93 “Test Method for Determining the Rheological Properties of Asphalt Binder Using a Dynamic Shear Rheometer” will be used to determine the rheological properties and Superpave performance grade of both the virgin binders and the binders extracted from RAP. This will allow the binders to be characterized completely at high and intermediate temperatures.
As a result of the increased stiffness of the binder from the recycled material, intermediate and low temperature pavement performance will most likely be the limiting factor for the amount of allowable recycled material in the mix. These maximum and minimum limiting factors of allowable binders from recycled material in a mix will be determined by
developing blending charts using the rheological binder properties such as shear modulus (G*) and phase angle (δ) obtained from the DSR.
1.3.3 Task 3 Mix Design
1.3.3.1 Task 3.1 Design of Mixtures Containing 100% Virgin Material
In this subtask, the design of mixtures containing 100% virgin materials will be discussed. The mixture designs will be governed by AASHTO R 35-04 “Superpave Volumetric Design for Hot Mix Asphalt (HMA)”. In this methodology the first step is the selection of the design aggregate structure. The design aggregate structure is generally chosen from three trial gradations. The trial gradations must pass through the control points for the respective nominal maximum size and superpave specifications. An estimated optimum asphalt content is used for fabrication of each trial gradation. After the mixing and compaction of each specimen the volumetric properties such as the bulk specific gravity (AASHTO T166) and maximum theoretical specific gravity (AASHTO T209) will be measured. The required superpave specifications are compared to the obtained values of air voids, voids in mineral aggregate, voids filled with asphalt, compaction indices and dust proportion for all
specimens. The design aggregate structure is selected as the trial gradation that best meets all these specifications. Once the design aggregate structure is selected the optimum asphalt content will be determined. The design aggregates structure will be used to fabricate
1.3.3.2 Task 3.2 Design of Mixtures Containing Various Percentages of Recycled Materials
In this subtask, specimens containing various percentages of recycled materials will be fabricated for use in analysis during Task 4 and 5. The percentages of RAP to be used in the mix design process will be evaluated using the allowable limits of RAP binder that was earlier determined using the blending charts in Task 2. Since the mixtures containing recycled materials will be compared to the mixture containing 100% virgin materials the aggregate gradations used in the recycled material mixtures should resemble the aggregate gradations used in the virgin mixtures. To accomplish this, a gapped gradation of the virgin aggregate will be used in order to account for the gradation of the recycled materials aggregate so as to produce a combined gradation similar to that used in the 100% virgin material mixture. The amount of virgin asphalt binder used for the virgin material mixtures will be modified in order to account for the stiff binder contributed by the recycled materials so that similar optimum asphalt contents can be used in the mix.
1.3.4 Task 4 Performance Testing
1.3.4.1 Task 4.1 Dynamic Modulus Test
In this subtask, the Dynamic Modulus Test will be performed according to AASHTO TP 62-03 “Standard Method of Test for Determining Dynamic Modulus of Hot-Mix Asphalt
Concrete Mixtures”. The Dynamic Modulus Test applies a repeated axial cyclic load of fixed magnitude and cycle duration. The testing will be performed under three temperature ranges of 4°C, 20°C & 40°C at load frequencies of 0.1 Hz, 1 Hz & 10 Hz at each temperature. The dynamic modulus test measures a specimen’s stress-strain relationship under a continuous sinusoidal loading. The Complex Modulus (E*) and Dynamic Modulus (|E*|) values for each mixtures will be calculated.
1.3.5 Task 5 Mixture Characterization
In this research task, the mixture and binder properties obtained from performance testing and binder testing will be used to predict pavement performance of the mixtures. From the cost analysis, the cost savings resulting from use of higher percentages of recycled materials will be determined.
1.3.5.1 Task 5.1 Pavement Performance Prediction
1.3.6 Task 6 Economic Analysis
In this research subtask, an economic analysis will be performed as a basis for comparison between mixtures containing various amounts of recycled materials to mixtures containing 100% virgin materials. This economic analysis of the life cycle cost of pavement sections will aid in the decision making concerning the use of recycled materials in pavements. An economic analysis for the life cycle cost of the pavements will be conducted in order to take into account more than the initial difference in cost between pavements containing recycled materials versus pavements containing 100% virgin materials. Although using recycled materials for pavement construction will decrease the initial cost of construction, pavements containing recycled materials might require more maintenance throughout their service life or they tend to have a shorter service life than pavements containing 100% virgin materials, thereby reducing the initial construction savings or even resulting in being more expensive than pavements containing 100% virgin materials. For this reason the life cycle analysis is utilized.
cycle cost would be selected. The following relationships are used for the present worth method and the annual cost method, respectively.
The present worth of a future sum can be found by
n i F PW ) 1 ( Where,
PW = present worth of a sum of money that takes place Nyears from the base year, F= future sum of an improvement at the end of year N, and
i= discount rate.
The present worth for several equal costs can be found by
PW = ] ) 1 ( [ ] 1 ) 1 [( N N i i i A Where,
PW= present worth of an annual uniform expenditure, A= the uniform annual cost for N years,
N= the number of years in which the annual cost is experienced, and i= discount rate.
The present worth of a gradient annual cost or an annual cost that is expected to increase at a constant rate over time can be calculated by
PW =A0+
N N i N i i i i G ) 1 ( ) 1 ( 1 ) 1 ( * 1 * Where,
PW= present worth of a gradient annual cost,
N= number of years the gradient expenditure is encountered, and i= discount rate.
The annual cost of a present worth can be calculated by
A = PW *
1 ) 1 ( ) 1 ( N i i i Where,
A= annual uniform cost,
PW= present worth of a capital investment, N= number of years in the analysis period, and i= discount rate.
The annual cost of a future investment can be calculated by
A = F *
) 1
1 ( 1 N i Where,
A= annual uniform cost,
F= future value of a discrete expenditure,
N= number of years from the baseline year the expenditures will take place, and i= discount rate.
If an annual cost is expected in increase at a constant rate over a period, the uniform annual cost can by calculated by
1 ) 1 ( 1 * 0 N i N i G A A Where,
A0= value of the expenditure at the end of the first year, G= annual increase in the expenditure,
CHAPTER TWO Literature Review
The following literature review will focus on the past research studies that were conducted to determine the effects of using RAP in hot mix asphalt mixtures and to obtain a suitable method to determine the optimum RAP limits that would best enhance the performance of road pavements.
The research conducted by Beth Visintine “An investigation of various percentages of Reclaimed Asphalt Pavement on the performance of Asphalt pavements” focused on determining the effects of RAP on the pavement performance. The PG grades of asphalt binders blended with various percentages of binders recovered from RAP were analyzed by conducting superpave binder tests. Performance tests were later conducted on the mixtures to analyze the performance of the pavement mixes fabricated with binders blended with RAP and the data collected from these tests were used to perform economic analysis to determine the economic impact of using higher percentages of RAP in pavements.
Two sources of RAP were selected with varying RAP aggregate gradations and binder contents, so that the results of this project could be applied for a much wider scope of RAP properties.
used in design of pavements in North Carolina. Superpave tests were conducted on the virgin binders to verify the the PG grades and rheological properties of the selected binders.
Aggregate sources with a maximum nominal size of 9.5mm and 19mm were selected from Westgate and Pineville respectively. Properties of the virgin aggregates such as their specific gravities and gradations were determined for further design.
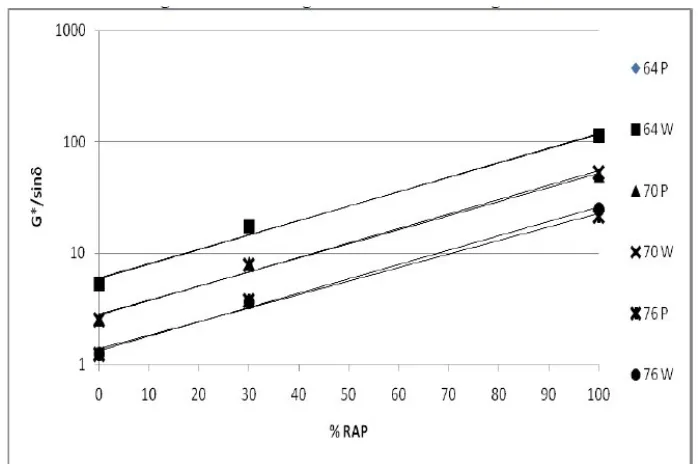
Virgin binders were blended with varying proportions of binders recovered from RAP and they were subjected to superpave tests to determine their rheological properties such as shear modulus (G*) and phase angle (δ). Blend charts were developed using these rheological
Figure 2.1 Blend Chart of Original Aged PG 64-22 Containing RAP
Figure 2.3 Blend Chart of PAV Aged PG64-22 Containing RAP
These blend charts were used to determine the minimum and maximum limits of RAP to be blended with the virgin binders using the specifications G*/sinδ ≥ 1.0 kPa, G*/sinδ ≥ 2.2 kPa and G*sinδ ≤ 5000 kPa for each of the original aged, RTFO aged and PAV aged binder
samples respectively. These conditions were used to determine the high and intermediate temperature characteristics of the binders.
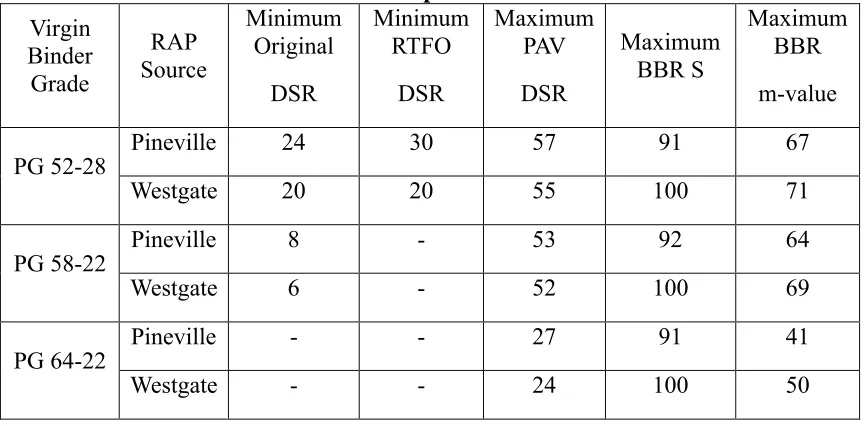
Table 2.1 Minimum and Maximum Percentage of RAP Binder Required to Satisfy all PG 64-22 Specifications
Virgin Binder Grade RAP Source Minimum Original DSR Minimum RTFO DSR Maximum PAV DSR Maximum BBR S Maximum BBR m-value
PG 52-28 Pineville 24 30 57 91 67
Westgate 20 20 55 100 71
PG 58-22 Pineville 8 - 53 92 64
Westgate 6 - 52 100 69
PG 64-22 Pineville - - 27 91 41
Westgate - - 24 100 50
These limits were used accordingly in the mix design process by choosing the suitable trial gradation and asphalt binder content for each mixes. The design aggregate and design binder content were chosen by ensuring that the volumetric properties of the mixes were within the superpave volumetric criteria as specified by the NCDOT.
The performance of the pavements incorporating higher percentages of RAP was analyzed using superpave simple shear Tester (SST) by conducting frequency sweep test at constant height (FSTCH) and repeated simple shear test at constant height (RSSTCH).
mixtures and mixtures blended with varying proportions of RAP. The complex modulus values were used to predict the pavement’s fatigue life cycle. The fatigue life cycles of the pavements constructed using mixtures with different proportions of RAP were compared to perform economic analysis during the later stages of the research.
The RSSTCH was used to measure the plastic strains of the test specimens which were later used to evaluate the rutting resistance characteristics of the pavement.
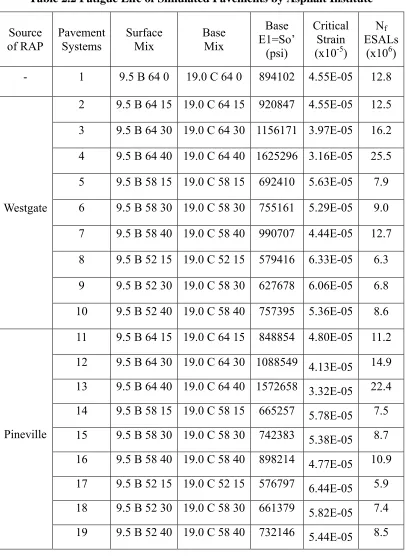
The results from FSTCH and RSSTCH tests were used to carry out performance analysis based on models as cited by strategic highway research program (SHRP) and asphalt institute (AI). Fatigue and rutting life cycles of the pavements were determined using these models. Table 2.2 shows the results of fatigue life cycle analysis. The results show an increasing trend in fatigue life performance with increase in the percentage of RAP in the blended mix. This is expected as RAP is stiffer and contributes to increased stiffness resulting in smaller strains and thus increasing fatigue life cycles.
Table 2.2 Fatigue Life of Simulated Pavements by Asphalt Institute Source of RAP Pavement Systems Surface Mix Base Mix Base E1=So’ (psi) Critical Strain (x10-5)
Nf
ESALs (x106) - 1 9.5 B 64 0 19.0 C 64 0 894102 4.55E-05 12.8
Westgate
2 9.5 B 64 15 19.0 C 64 15 920847 4.55E-05 12.5 3 9.5 B 64 30 19.0 C 64 30 1156171 3.97E-05 16.2 4 9.5 B 64 40 19.0 C 64 40 1625296 3.16E-05 25.5 5 9.5 B 58 15 19.0 C 58 15 692410 5.63E-05 7.9 6 9.5 B 58 30 19.0 C 58 30 755161 5.29E-05 9.0 7 9.5 B 58 40 19.0 C 58 40 990707 4.44E-05 12.7 8 9.5 B 52 15 19.0 C 52 15 579416 6.33E-05 6.3 9 9.5 B 52 30 19.0 C 58 30 627678 6.06E-05 6.8 10 9.5 B 52 40 19.0 C 58 40 757395 5.36E-05 8.6
Pineville
Table 2.3 Loading Cycles to Rutting Failure for Simulated Pavements Using Asphalt Institute Model Source of RAP Pavement Systems Surface Mix Base Mix
εcat sub-base
layer(x10-5)
Nf
ESALs (x109) - 1 9.5 B 64 0 19.0 C 64 0 1.63E-04 0.12
Westgate
2 9.5 B 64 15 19.0 C 64 15 1.66E-04 0.11 3 9.5 B 64 30 19.0 C 64 30 1.51E-04 0.18 4 9.5 B 64 40 19.0 C 64 40 1.26E-04 0.39 5 9.5 B 58 15 19.0 C 58 15 2.02E-04 0.05 6 9.5 B 58 30 19.0 C 58 30 1.90E-04 0.06 7 9.5 B 58 40 19.0 C 58 40 1.66E-04 0.11 8 9.5 B 52 15 19.0 C 52 15 2.22E-04 0.03 9 9.5 B 52 30 19.0 C 58 30 2.16E-04 0.04 10 9.5 B 52 40 19.0 C 58 40 1.95E-04 0.06
Pineville
Based on the life cycles determined from the above models, life time economic analysis of the pavements constructed using various percentages of RAP was performed. The analysis predicted that total life time cost savings of around 26-28% and 35-37% can be achieved for pavements that were constructed using 30% and 40% RAP by weight of total mixture respectively.
The study conducted by Soleymani, Mcdaniel and Rebecca on “Recommended use of reclaimed asphalt pavement in the Superpave mix design method” initially focused on the binder extraction and recovery procedures of RAP in order to recommend an appropriate method for use in the superpave system. Suitable virgin and RAP samples were chosen with a view of analyzing materials with different properties. Two virgin binders were chosen such that, one was soft base asphalt that could be used in cold places and the other was a medium graded asphalt binder that could be used in areas of warm climate. Three RAP samples were selected from different regions with a property of low, medium and high stiffness values respectively. The critical temperatures for each of the virgin asphalt were found out by developing blend charts after performing rheological binder testing. The viscosities of the RAP samples were also determined using a rotational viscometer. The chosen virgin samples and RAP binders were subjected to short term and long term aging. Virgin binders containing RAP binder content ranging from 10% to 40% were blended. Both 100% virgin binders and 100% binders extracted from RAP were also considered for binder testing.
RAP actually blends with the virgin binder in a mix. In order to evaluate the significance of the blending of RAP with virgin binders, three concepts were studied in this project. They were black rock, actual practice and total blending. In the black rock concept no RAP binder was used in the mix. The actual practice samples had RAP aggregates containing recycled binder that were used in the mix. In the case of total blending, the RAP and virgin binders were blended before being used in the mix design procedure. These three concepts will be compared using various performance testing procedures to determine whether actual
blending of RAP and virgin binders take place and whether the blending effect is significant. A binder effect study was performed to evaluate the effect of RAP content and it’s stiffness on the property of the blend mix. This study also discussed the selection of virgin asphalt binder to achieve the target blended mix grade. The study ultimately revealed that RAP does not behave as a black rock since the black rock samples were found to provide performance test results that were completely different from the standard results obtained from mixtures containing RAP. Thus this concept ensured that the use of blending charts is appropriate. For the mix design procedure the virgin aggregates were heated to 150°C while the virgin binders were heated to their respective mixing temperature based on their binder grade. Mixing temperatures of 155-160°C for PG 64-22 and 134-140°C for PG 52-34 were used. The RAP material was heated to 110°C for a period of 2 hours prior mixing. After mixing the materials were subjected to four hours of short term aging and they were compacted at
were subjected to long term aging by keeping them at 85°C for 5 days with the view of improving the degree of blending of RAP binder with virgin binder. After the period of long term aging the compacted sample were cut into half to get two samples of size 100 mm in diameter and 50 mm in height.
Superpave tests were conducted on the selected levels of blend mixes. Frequency sweep (FS), Simple shear (SS) and Repeated shear at constant height (RSCH) were conducted to characterize the mixtures at high and intermediate temperatures.
Frequency sweep test was performed to determine the complex shear modulus (G*) and phase angle (δ) at a wide range of frequencies from 0.01 Hz to 10 Hz and attemperatures of 4°C, 20°C & 40°C. As expected the stiffness values were found to increase with the increase in RAP content except in the samples prepared using black rock concept. This was due to the absence of RAP binder in the mix. Similarly simple shear tests were conducted on the
different from black rock samples. All these results indicate that the RAP blends effectively with the virgin binders and it has a significant effect on the performance tests of the mixtures, which would indicate significant effects on the performance of the pavements.
Table 2.4 Mixtures ETG Guidelines for RAP
Rap Percentage Recommended Virgin Asphalt Binder Less than 15% No change in binder selection
15-25% Select virgin binder one grade softer than the normal Greater than 25% Follow blending chart recommendations
The table 2.4 “Mixtures ETG guidelines for RAP” concludes that there exists a threshold level of RAP below which its binding effect is negligible. It indicates that the level is in the interim of 10% to 20% depending on the stiffness of the RAP. These findings validate the three tried approaches for the RAP usage as recommended by the mixture expert task group. The research conducted by Binh T. Tran & Rayya A. Hassan “Performance of HMA
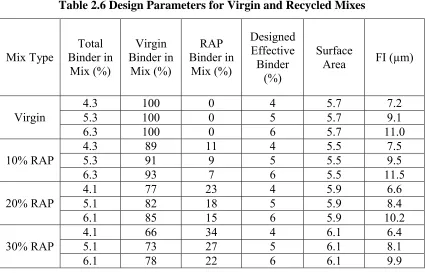
The aim of designing HMA with RAP was to optimize the amount of RAP content that can be used in a mix that would meet all the required volumetric properties and give a good performance. Suitable blend aggregate gradations were used and adequate blending of virgin binders with recycled binder content was ensured. RAP binder was considered to blend completely with virgin binder and hence 100% contribution of RAP was assumed. A suitable preheating time and temperature was used to achieve proper blending. The recommended preheating time for total blending of binders was 2 hours. Since RAP tends to increase the stiffness of the mixtures lower virgin binder grades were used when using higher percentages of RAP. The mix design gradations and design parameter of virgin and recycled aggregates used are as shown in Tables 2.5 & 2.6.
Table 2.5 Mix Design Gradations for Virgin & Recycled Mixes Sieve Size
(mm)
Mix Type Specification
Virgin 10% RAP 20% RAP 30% RAP Max Min
19.0 100 100 100 100 100 100
13.2 99 99 99 99 100 85
9.5 84 83 84 84 84 70
6.7 71 64 65 65 73 59
4.75 57 50 52 51 65 48
2.36 39 35 37 36 48 32
1.18 30 28 30 28 37 22
0.60 23 23 24 23 28 14
0.30 16 16 17 16 22 10
0.15 7.58 7.20 8.06 8.70 14 6
0.075 5.23 4.89 5.53 6.12 7 4
Combined density
Table 2.6 Design Parameters for Virgin and Recycled Mixes Mix Type Total Binder in Mix (%) Virgin Binder in Mix (%) RAP Binder in Mix (%) Designed Effective Binder (%) Surface
Area FI (µm)
Virgin
4.3 100 0 4 5.7 7.2
5.3 100 0 5 5.7 9.1
6.3 100 0 6 5.7 11.0
10% RAP
4.3 89 11 4 5.5 7.5
5.3 91 9 5 5.5 9.5
6.3 93 7 6 5.5 11.5
20% RAP
4.1 77 23 4 5.9 6.6
5.1 82 18 5 5.9 8.4
6.1 85 15 6 5.9 10.2
30% RAP
4.1 66 34 4 6.1 6.4
5.1 73 27 5 6.1 8.1
6.1 78 22 6 6.1 9.9
content. This was mainly due to the increasing amount of materials passing 0.075 mm sieve which would increase the surface area of aggregate blend. This caused the average binder film thickness to drop and the effective binder content reduced. Moreover the usage of high viscosity binders decreased the binder absorption due to their lack of fluidity and their inability to fill the aggregate pores. This ultimately leads to lower effective binder content and lower VMA.
Table 2.7 Properties of Virgin & Recycled Mixes at 4% Air Void Content
Mix RAP (%) (%)AV VMA (%) VFB (%)
Design Binder Content (%)
b
(%) (%)Be (µm)FI Modulus (MPa)
Virgin 0 4.0 16.3 75 5.9 0.7 5.2 9.5 3.609
10%
RAP 10 4.0 15.6 74 5.3 0.3 5.0 9.4 4.415
20%
RAP 20 4.0 15.0 73 5.1 0.4 4.7 8.1 5.082
30%
RAP 30 4.0 14.2 72 4.9 0.6 4.3 7.2 6.909
was lower than the required specification of 15%. The decrease in the required binder content and VMA with increase in RAP content in a mix is shown in Figures 2.4 & 2.5 respectively. As previously discussed this was due to the higher amount of fine materials and their
contribution towards the increase in surface area of the aggregate particles in the mix.
Figure 2.5 RAP Content (%) vs VMA (%)
The study recommended for the development of suitable design methods and testing conditions including protocols for sample preparation that are suitable with samples containing RAP content higher than 20% with acceptable volumetric and mechanical properties.
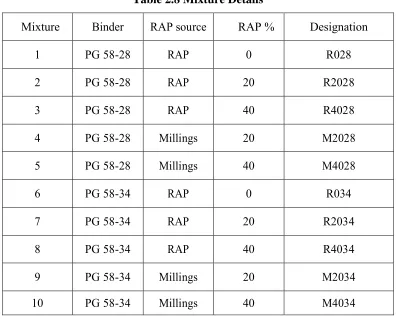
The study “Recycled Asphalt Pavement Effects on Binder and Mixture Quality” conducted by Xinjun Li, Clyne and Marasteanu aimed to determine the effects of various types and percentages of RAP on asphalt cement and mixture quality. This was considered to be the first step towards the complex process of developing a rational design for asphalt mixtures that contain RAP which would change the Mn/DOT specifications at the time this project was carried out.
sources (milling & RAP), two asphalt binders (PG58-28 & PG58-34) and three percentages of RAP (0%, 20% & 40%). The recycled materials from millings source were RAP obtained from a single source milled up from I-494 while RAP source were recycled materials
Table 2.8 Mixture Details
Mixture Binder RAP source RAP % Designation
1 PG 58-28 RAP 0 R028
2 PG 58-28 RAP 20 R2028
3 PG 58-28 RAP 40 R4028
4 PG 58-28 Millings 20 M2028
5 PG 58-28 Millings 40 M4028
6 PG 58-34 RAP 0 R034
7 PG 58-34 RAP 20 R2034
8 PG 58-34 RAP 40 R4034
9 PG 58-34 Millings 20 M2034
10 PG 58-34 Millings 40 M4034
dimensions 150 mm in diameter and 178 mm in height were compacted in the laboratory. These samples were later cored to samples of 100 mm in diameter and 150 mm in height. Dynamic modulus testing was performed on these cored samples after their air voids were checked. The testing was done in five different temperature ranges -20, -10, 4.4, 21.1 and 37.8°C at six different frequencies of 25, 10, 5, 1, 0.5 and 0.1 Hz.
The complex modulus data for all the samples were analyzed using a modified version of the SINAAT 2.0 program to develop the frequency vs dynamic modulus |E*| master curves. These data and master curves were used to evaluate the change in complex modulus with addition of RAP, effect of asphalt binder grade on complex modulus, effect of RAP source on complex modulus, effect of test temperature and loading frequency on complex modulus and the variability of complex modulus with the percent of RAP incorporated in the
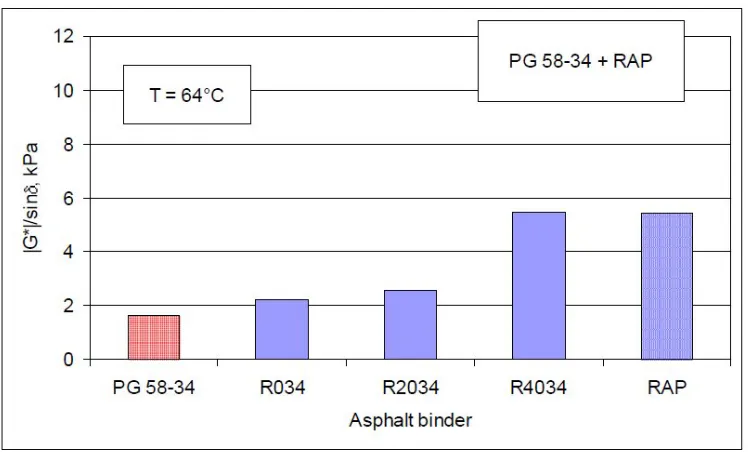
binder grades were found to give higher complex modulus values at all the frequency and temperature ranges. Addition of millings was found to give stiffer mixtures as they had higher complex modulus values than mixtures with RAP of similar percentages, although at lower temperatures it was not very significant. Moreover the addition of RAP was found to cause more variability in complex modulus results. This was assumed to be due to the variability in the RAP itself due to its different sources.
Figure 2.6 DSR Test Results @ 64°C, PG58-34 + RAP
For all the ten mixtures, the high temperature grade of the binder was increased by one or two grades with addition of RAP or millings. The tests on binders eventually indicated that using 20% RAP in asphalt mixtures did not significantly affect the performance. However 40% RAP was found to have a significant effect on the mixture performance. The research work by Sondag, Chadbourn and Drescher, on “Investigation of Recycled asphalt pavement (RAP) mixtures” had two main objectives. The first objective was to sample RAP stockpiles from around the state to characterize typical Minnesota RAP gradation and binder properties. The second objective was to develop a mix design methodology using the superpave approach to proportion the materials in the mixtures containing RAP. RAP binder was extracted using solvent extraction method and ignition method on two RAP sources namely district 6 and district 8. The gradations of the retained aggregates were determined. DSR tests were conducted on the extracted binders to determine their performance grades and the results are as shown in Table 2.9. Samples were compacted in the laboratory using superpave gyratory compactor. Samples were prepared as shown in Table 2.10 with varying percentages of RAP from both the sources which were blended with virgin asphalt binders of different performance grades of PG 58-28, PG 52-34, PG 46-40. This matrix was designed to determine the amount of RAP and the grade of virgin asphalt binder which can be added to the mixtures in order to yield mixture properties that were considered acceptable for a mixture composed entirely of virgin materials.
Minnesota quarry and fine aggregates from Dresser, Wisconsin were blended and used for gradations for virgin mixtures. A control mixture was chosen from the various possible blends and it was ensured that it satisfied all the volumetric requirements.
The RAP aggregates were blended with the virgin aggregates accordingly to achieve a gradation similar to the control mixture. It was possible to blend a maximum of 40% of District 6 RAP and virgin aggregate to produce a gradation similar to the control gradation while only a maximum of 30% District 8 RAP could be blended with control aggregate to achieve gradation similar to control gradation due to the large amount of fine aggregate in District 8 RAP.
Ignition oven and solvent extraction methods were used to extract asphalt from RAP and determine their binder contents. The PG grades of the recovered binders were also determined.
Table 2.9 Asphalt Content and PG Grades of Binder in RAP RAP Source Asphalt Content PG Grade
District 6 7.10% 67-24 District 8 4.70% 78-11
conducted using the indirect tensile test setup (IDT).
Table 2.10 Test Matrix for Materials
RAP Content 0% 15% 30% 40%
PG Grade 46 -40 52-34 58-28 46-40 52-34 58-28 46-40 52-34 58-28 46-40 52-34 58-28 RAP Source District 6
X X X
X X X X X X X X X
District
8 X X X X X X
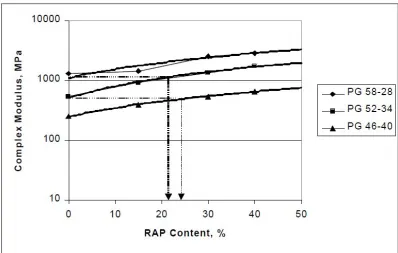
Complex modulus test was used to evaluate the visco-elastic properties of the asphalt concrete mixtures. The test was performed by using the MTS 810 electro hydraulic test system. Complex modulus data collected at lower temperatures were found to have more variability than data collected from other temperatures. The asphalt binder grade was found to have a pronounced effect on the complex modulus values up to the 25°C test temperature. The effect was not nearly as pronounced at 32°C. The complex modulus was also found to increase with increase in RAP content. This phenomenon was observed in all the test
Figure 2.8 Change in Complex Modulus with RAP Content, District 6 RAP Mixtures, 25°C, 1 Hz
increased level stiffness of mixtures at high temperatures could be very helpful in avoiding rutting behavior of pavements.
Complex modulus tests at 25 °C indicated 23% of District 6 RAP with PG 52-34 asphalt would yield a complex modulus similar to a virgin mixture with PG 58-28 asphalt. About 28% District 6 RAP with PG 46-40 asphalt will give the same complex modulus as a virgin mixture with PG 52-34 asphalt. Complex modulus tests at 25 °C indicated 10% District 8 RAP with PG 52-34 asphalt would yield a complex modulus similar to a virgin mixture with PG 58-28 asphalt. About 16% District 8 RAP with PG 46-40 asphalt will give the same complex modulus as a virgin mixture with PG 52-34 asphalt. The source of the RAP affected the complex modulus results. The District 8 RAP binder had a higher PG grade than the District 6 RAP, and accordingly yielded a higher complex modulus and lower phase angle. This shows the importance of knowing the stiffness of the RAP binder before using it to fabricate asphalt mixtures.
Table 2.11 Recommended RAP Contents and Asphalt Binders Original asphalt
grade
Asphalt grade with RAP
RAP Content with District 6 RAP
RAP Content with District 8 RAP
PG 58-28 PG 52-34 20% 10%
PG 58-28 PG 46-40 50% 35%
The project recommends that complex modulus test should replace the resilient modulus test as the standard test performed for mixture evaluation as the complex modulus test provides more information about the mixture properties. This project also shows that dynamic
modulus test is an efficient way of determining the minimum limits of RAP that can be used in a mix to achieve a target high temperature grade.
The project “Evaluation of Field Produced Hot mix Asphalt (HMA) Mixtures with
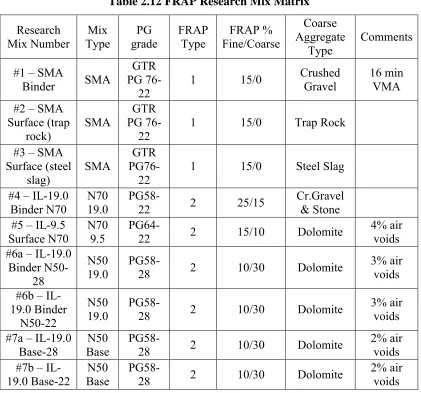
Fractionated Recycled Asphalt Pavement (FRAP)” conducted by Vavrik, Carpenter, Gillen & Benhke, aimed in determining whether the tollway design adopted by Rock Road companies and Rockford Blacktop at the Illinois tollway involving high FRAP content in mixes would produce high quality HMA pavements. Certain non-traditional ingredient materials such as blended ground tire rubber (GTR), modified liquid asphalt and coarse aggregate for the stone matrix asphalt (SMA) along with FRAP content were used in this project.
Nine HMA mixes were plant produced and tested as a part of this research as shown in Table 2.12. Three mixtures were SMA mixtures with different coarse aggregate content and same FRAP content to evaluate the use of fine portions FRAP and to determine if the material properties of the resulting mixture were consistent with other SMA mixes previously produced in Illinois. The base, binder and surface mixes were used to gauge their performances with increased FRAP percentage.
The previous specification of IDOT involving higher percentage of RAP without fractioning caused a lot of inconsistencies in the mix properties. Hence in this project RAP was
using these fractionated portions of RAP. The samples produced for each mix were subjected to dynamic modulus testing to verify whether materials with higher FRAP content will provide better consistency in test results when compared with tests carried out using previous specifications.. The samples were tested at -10°C, 4°C & 20°C at load frequencies ranging from 0.01 Hz to 25 Hz. The dynamic modulus testing was performed on samples with 4% and 7% air voids at the listed temperature and frequencies.
Table 2.12 FRAP Research Mix Matrix Research
Mix Number TypeMix gradePG FRAP Type Fine/CoarseFRAP %
Coarse Aggregate
Type
Comments
#1 – SMA
Binder SMA
GTR PG
76-22
1 15/0 Crushed
Gravel
16 min VMA #2 – SMA
Surface (trap rock)
SMA PG 76-GTR 22
1 15/0 Trap Rock
#3 – SMA Surface (steel slag) SMA GTR PG76-22
1 15/0 Steel Slag
#4 – IL-19.0 Binder N70
N70 19.0
PG58-22 2 25/15
Cr.Gravel & Stone #5 – IL-9.5
Surface N70
N70 9.5
PG64-22 2 15/10 Dolomite
4% air voids #6a – IL-19.0
Binder N50-28
N50
19.0 PG58-28 2 10/30 Dolomite 3% air voids #6b –
IL-19.0 Binder N50-22
N50 19.0
PG58-28 2 10/30 Dolomite
3% air voids #7a – IL-19.0
Base-28 BaseN50 PG58-28 2 10/30 Dolomite 2% air voids #7b –
IL-19.0 Base-22
N50 Base
PG58-28 2 10/30 Dolomite
Figure 2.9 Dynamic Test Data at 20°C and Various Highway Speeds with the IDOT Design Range for Northern Illinois
CHAPTER THREE
Binder Characterization & Blend charts
This chapter will discuss about the determination of rheological properties of virgin binders with various proportions of binder extracted from RAP and development of blend charts with the help of these properties. Since this project deals with evaluation of the performance of 9.5B mixes, it is important that the binder blends used for the mixes in this project satisfy the performance grade specifications of PG64-22 binder.
3.1 Performance Grade Testing
It is important to determine the properties of the virgin and RAP binders that are procured for this project before using them to fabricate mixes in the mix design process. The rheological properties of the RAP binders would give an insight about the amount of RAP binder that can be used effectively in a mix to satisfy the specifications of PG64-22.
Two virgin binders of performance grades PG 58-28 and PG 64-22 along with various proportions of binders extracted from RAP were used for binder characterization as shown in the Table 3.1. The recycled binder from RAP was extracted with the help of NCDOT
personnel according to AASHTO T 319 “Quantitative Extraction and Recovery of Asphalt Binder from Hot Mix Asphalt”. The recycled binder was dissolved and washed from
Table 3.1 Asphalt Binder Blend Proportions Used for Performance Grade Testing
Virgin Binder RAP
PG 58-28 0%, 25%, 40%, 100%
PG 64-22 0%, 25%, 40%, 100%
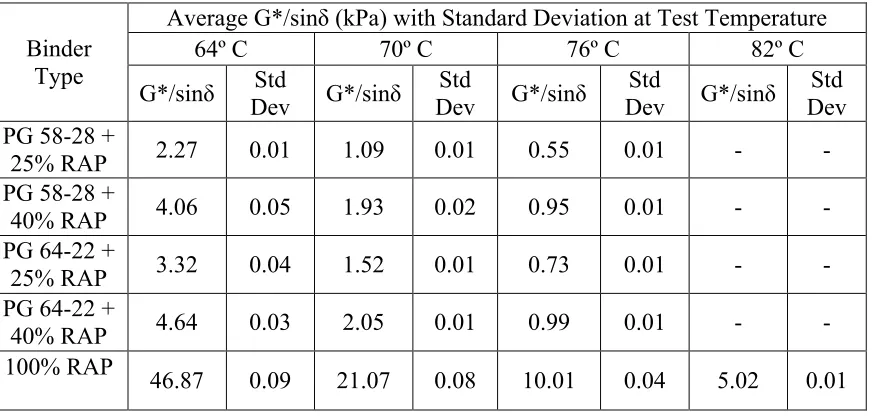
Binder testing was performed on these blended binders according to AASHTO TP5-93 “Test Method for Determining the Rheological Properties of Asphalt Binder Using a Dynamic Shear Rheometer”. The rheological properties of the binders such as shear modulus (G*) and phase angle (δ) were determined during this process. Three replicates for each binder type
were tested. Each binder sample was tested at several temperatures in order to obtain various temperature gradients to be used for the development of blend charts. The values of G*/sin δ
at each temperature were determined for virgin binders and the mixes containing virgin binders with different proportions of RAP as shown in Tables 3.2 & 3.3 respectively.
Table 3.2 Binder Rheological Properties of Original Aged Binders Virgin
Binder Grade
Average G*/sinδ (kPa) with Standard Deviation at Test Temperature
58º C 64º C 70º C 76º C
G*/sinδ DevStd G*/sinδ DevStd G*/sinδ DevStd G*/sinδ DevStd
Table 3.3 Binder Rheological Properties of Original Aged Binder Blends Containing RAP
Binder Type
Average G*/sinδ (kPa) with Standard Deviation at Test Temperature
64º C 70º C 76º C 82º C
G*/sinδ Std Dev G*/sinδ Std Dev G*/sinδ Std Dev G*/sinδ Std Dev PG 58-28 +
25% RAP 2.27 0.01 1.09 0.01 0.55 0.01 -
-PG 58-28 +
40% RAP 4.06 0.05 1.93 0.02 0.95 0.01 -
-PG 64-22 +
25% RAP 3.32 0.04 1.52 0.01 0.73 0.01 -
-PG 64-22 +
40% RAP 4.64 0.03 2.05 0.01 0.99 0.01 -
-100% RAP
46.87 0.09 21.07 0.08 10.01 0.04 5.02 0.01
Table 3.4 Binder Rheological Properties of RTFO Aged Binders Virgin
Binder Grade
Average G*/sinδ (kPa) with Standard Deviation at Test Temperature
58º C 64º C 70º C 76º C
G*/sinδ Std Dev G*/sinδ Std Dev G*/sinδ Std Dev G*/sinδ Std Dev
PG 58-28 7.27 0.11 3.46 0.03 1.7 0.01 0.86 0.01
PG 64-22 9.29 0.19 3.85 0.06 1.75 0.02 0.83 0.01
Table 3.5 Binder Rheological Properties of RTFO Aged Binder Blends Containing RAP Binder
Type
Average G*/sinδ (kPa) with Standard Deviation at Test Temperature
70º C 76º C 82º C 88º C
G*/sinδ DevStd G*/sinδ DevStd G*/sinδ DevStd G*/sinδ DevStd PG 58-28 +
25% RAP 4.49 0.05 2.23 0.02 1.14 0.01 -
-PG 58-28 +
40% RAP 6.98 0.07 3.41 0.02 1.71 0.01 -
-PG 64-22 +
25% RAP 4.21 0.02 1.94 0.02 - - -
-PG 64-22 +
40% RAP 8.94 0.03 4.08 0.02 1.93 0.01 -
-100% RAP 63.69 0.63 29.83 0.31 14.2 0.08 7 0.04
According to AASHTO R-29 “Standard Practice for Grading or Verifying the Performance Grade of an Asphalt Binder”, the performance grades (PG) of the binders were verified. The high temperature grade of each binder was found by determining the highest temperature at which the G*/sinδ values were higher than 1.0 kPa for original aged binder samples while for
each virgin binder with addition of RAP was noted.
The binder samples were then further subjected to aging with the help of pressure aging vessel (PAV) to simulate long term aging under field conditions. This was achieved by placing thin film samples of asphalt content in a pressure vessel at a temperature of 100°C for a period of 20 hours and applying a pressure of 2.07 MPa. During this process oxygen is forced much more rapidly into the asphalt samples by applying pressure so that the aging process can be accelerated. This process would then simulate aging in asphalt during the pavement’s long term service life. The aged samples were later tested using the DSR at intermediate temperature ranges to obtain the values of G*sinδas shown in Tables 3.6 and 3.7.
Table 3.6 Binder Rheological Properties of PAV Aged Binders Virgin
Binder Grade
Average G*sinδ (kPa) with Standard Deviation at Test Temperature
28º C 25º C 22º C 19º C
G*sinδ Std
Dev G*sinδ
Std
Dev G*sinδ
Std
Dev G*sinδ
Table 3.7 Binder Rheological Properties of PAV Aged Binder Blends Containing RAP Binder
Type
Average G*sinδ (kPa) with Standard Deviation at Test Temperature
28º C 25º C 22º C 19º C
G*sinδ DevStd G*sinδ DevStd G*sinδ Std G*sinδ DevStd PG 58-28 +
25% RAP 2424 160 3373 219 4847 306 6945 438
PG 58-28 +
40% RAP 3304 103 4496 141 6338 199 -
-PG 64-22 +
25% RAP 3752 34 5263 60 - - -
-PG 64-22 +
40% RAP 4974 237 6793 321 - - -
-100% RAP 11239 1582 13903 2088 - - -
-According to AASHTO R-29 “Standard Practice for Grading or Verifying the Performance Grade of an Asphalt Binder”, the intermediate Performance Grade (PG) of the binders was verified. This was achieved by determining the rheological properties of each binder samples and then computing their respective values of G*sinδ. The intermediate temperature grade was considered as the lowest temperature at which the value of G*sinδ did not exceed 5000
kPa. The rheological properties were used to determine the maximum limits of recycled binder content in the mix.
3.2 Development of Blend Charts
grade of 64°C and an intermediate temperature grade of 25°C to satisfy the PG64-22 criteria. The maximum and minimum limits of RAP binder content that were required to meet this high and intermediate temperature grade for each binder mixes was determined by
developing blend charts. These limits of recycled binder by weight of total binder content were subsequently converted to limiting factors by weight of RAP in the total mix which would be used later during the mix design process. The blend charts were plotted for all original, RTFO aged and PAV aged binders in order to determine both the maximum and minimum limits of RAP binder.
Figure 3.1 Blend Chart of Original Aged PG58-28 Binder Blended with Various Proportions of RAP
These blending charts were later used to determine the minimum amount of recycled materials required to be added to the virgin binders to obtain a high temperature grade of 64°C for the resulting blended binder. This was achieved by determining the percentage of RAP required to be added to a virgin binder to satisfy the condition G*/sinδ ≥ 1 kPa at each
temperature. The minimum limits of RAP binder required for each virgin binder to achieve the following increased high temperature grades are determined as shown in Table 3.8.
Table 3.8 Minimum limits of RAP Binder Determined Using Blend Charts of Original Aged Binders
Virgin Binder
Minimum Percentage of Recycled Binder to satisfy G*/sinδ ≥ 1.0 kPa for Original Agedbinders (%)
64°C 70°C 76°C
PG 58-28 - 21.6 44.6
PG 64-22 - 12.1 39.5
As expected the PG64-22 did not need any addition of RAP to obtain a high temperature grade of 64°C. However the analysis also showed that PG58-28 binder satisfied the
specifications required for high temperature grade of PG64-22 without any RAP content as the G*/sinδ value was close to 1.00 kPa at 64º C. This indicated that the PG58-28 binder
acted like PG64-22 graded binder at its original state without any addition of recycled binder. This showed that both the PG58-28 and PG64-22 binders can be used for 9.5B mixes without any addition of RAP content.
aged binder mixes and they were again used to determine the minimum limits of RAP binder content to that used in a 9.5B mix. The blending charts drafted for these RTFO aged mixes are as shown in Figures 3.3 & 3.4.
Figure 3.4 Blending Chart of RTFO Aged PG64-22 Binder Blended with Various Proportions of RAP
The PG grade of the binders were verified using AASHTO R-29 “Standard Practice for Grading or Verifying the Performance Grade of an Asphalt Binder”. The condition G*/sinδ ≥ 2.2 kpa was used to determine the minimum amount of recycled asphalt content
Table 3.9 Minimum Limits of RAP Binder Determined Using Blend Charts of RTFO Aged Binders
Virgin Binder
Minimum Percentage of Recycled Binder to satisfy G*/sinδ = 2.2 kPa for RTFO aged binders (%)
64°C 70°C 76°C
PG 58-28 - 7.1 26.5
PG 64-22 - 5.2 26.5
Similar to the results obtained from original aged binders, RTFO binder samples also showed that both PG58-28 and PG64-22 binders did not require any addition of RAP content to satisfy the high temperature grade of 64°C.
The maximum limits of RAP content that can be used with the virgin binders is determined by verifying the intermediate temperature grades of the binder samples. This was achieved with the help of the blend charts developed using the rheological properties of the PAV aged binders. These blend charts are developed using the values of G*sinδ values of PAV aged
Figure 3.5 Blend Chart of PAV Aged PG58-28 Binder Blended With Various Proportions of RAP
The condition G*sinδ ≤ 5000 kPa was used to determine the intermediate temperature grade
of the binder samples. The lowest temperature at which the conditionG*sinδ ≤ 5000 kPawas met was considered as the intermediate temperature grade. The maximum amount of RAP binder content to achieve an intermediate temperature grade of 25°C was determined. Table 3.10 shows the maximum limits of RAP binder to be used in a mix based to satisfy each intermediate temperature grade.
Table 3.10 Maximum Limits of RAP Binder Determined Using the Blend Charts of PAV Aged Binders
Virgin Binder Grade
Maximum Percentage of RAP binder to satisfy the condition G*sinδ = 5000 kPa for PAV Aged Binder (%)
19º C 22º C 25º C 28º C 31º C
PG 58-28 12.0 28.5 42.9 54.2
-PG 64-22 - - 20.5 40.9 54.6
containing more than 40% RAP, PG58-28 binder should be used instead of PG64-22. This specification is as shown in Table 3.11.
Table 3.11 NCDOT Specifications for Performance Grade of Virgin Asphalt Binders to be Used in Mixtures Containing RAP
RAP by total weight of mix Virgin Binder
0-20% PG64-22
20-30% PG64-22
>30% PG58-28
The experimentally established limits of RAP by weight of binder content will be used accordingly in the mix design procedure such that the intermediate and high temperature grade of PG64-22 are satisfied. Thus the limits of RAP by weight of the total binder content in a mix that were used in this project are as shown in Table 3.12.
Table 3.12 Limits of RAP By Weight of Total Binder
Virgin Binder RAP by Weight of Total Binder PG58-28
45% 20% 8%
PG64-22 20%
8%
PG64-22 binders respectively. Minimum limits of RAP did not exist for both PG58-28 and PG64-22 as both binders were found to satisfy a high temperature grade of 64°C in the absence of RAP. However there was a need to include lower percentages of RAP in order to compare the performance of 9.5B mixes containing different proportions of RAP with mixtures made of virgin materials. Hence random binder limits of 8% and 20% of RAP were selected to be added to mixtures containing PG58-28 and PG64-22. It was ensured that these chosen limits of RAP binder with virgin binders met the NCDOT specifications as mentioned in Table 3.11.
CHAPTER FOUR Mix Design 4.1 Mix Design Involving Virgin Materials
A single source of Granite aggregate was used for this research. These Granite aggregates were procured from Knightdale Quarry since it reflected the properties of aggregates commonly used in North Carolina mix designs and due to its close proximity to North Carolina State University.
Two types of virgin aggregate materials 78M and Washed screenings (WS) were used initially for the mix design process. Before proceeding to the mix design, the gradation of these aggregates were determined. The aggregates were sampled and reduced to testing sizes as per AASHTO T2 “Standard Practice for Sampling of Aggregates” and AASHTO T248 “Standard Method of Test for Reducing Samples of Aggregate to Testing Size” . The percentage of materials finer than 75µm were determined as per AASHTO T11 “Determining Materials Finer than No.200 (75 µm) Sieve in Mineral Aggregates by
Table 4.1 Aggregate Gradations of Virgin Materials
Sieve Size % Passing
78M WS
12.5mm 100 100
9.5mm 90.8 100
4.75mm 32 99.8
2.36mm 5.6 87.7
1.18mm 3.6 65.7
600µm 2.8 44.6
300µm 2.2 25.2
150µm 1.5 8.3
75µm 1.0 3.0
Pan 0.0 0.0
The design aggregate structure was required to meet the NCDOT aggregate design criteria as shown in Table 4.2. In order to meet this design criteria the two types of virgin aggregates were blended in different proportions to obtain various trial blends. These trial blend
Table 4.2 Superpave Aggregate Gradation Criteria for 9.5B Mixes Sieve Size Control Points (% Passing)
Minimum Maximum
12.5mm 100.0
-9.5mm 90.0 100.0
4.75mm - 90.0
2.36mm 32.0 64.0
1.18mm -
-600µm -
-300µm -
-150µm -
-75µm 4.0 8.0
Pan -
-However it was observed that the percentage of materials finer than 75µm was very less for both the materials and as a result the trial blends were not able to satisfy the control point criteria for passing fines with any of the possible blending proportions. Hence an additional aggregate material referred as pond fines (materials finer than 75µm) were also used in the mix design process to increase the percentage of materials finer than 75µm. These pond fines were considered as a separate aggregate type in the mix design procedure. Three trial
Table 4.3 Aggregate Trial Blend Gradations
Sieve Sizes Trial 1 % PassingTrial 2 Trial 3
12.5 mm 100.0 100.0 100.0
9.5 mm 94.5 97.1 96.3
4.75 mm 59.1 78.1 72.3
2.36 mm 38.9 61.8 55
1.18 mm 29.8 46.9 41.9
600 µm 21.8 32.9 29.9
300 µm 14.4 20.1 18.9
150 µm 7.9 8.9 9.2
75µm 5.7 5.3 6.1
Pan 0.0 0.0 0.0
Table 4.4 Proportions of Virgin Aggregates Used for Trial Gradations
Aggregate Type % Combinations
78M WS Pond Fines
Trial 1 60.0 36.0 4.0
Trial 2 32.0 65.0 3.0
Trial 3 40.5 55.5 4.0
Figure 4.1 Virgin Aggregate and Trial Blend Gradations With Control Points
The specific gravities of the different aggregate materials and the trial gradtions were also determined as shown in Table 4.5.
Table 4.5 Apparent and Bulk Specific Gravities of Virgin Aggregates and Trial Blends
Aggregate % Combinations
Gsb Gsa
78M 2.617 2.644
WS 2.597 2.652
Pond Fines 2.597 2.647
Trial 1 2.609 2.647
Trial 2 2.603 2.649
The aggregates were batched according to these gradations and they were mixed with a constant binder content. The samples were mixed, conditioned and compacted by using the mentioned trial gradations as per AASHTO R35 “Standard Practice for Superpave
Volumetric Design of Hot Mix Asphalt (HMA)” and AASHTO R30 “Mixture Conditioning of Hot Mix Asphalt”. Their bulk specific gravities and maximum specific gravities were determined as per AASHTO T166 “Bulk Specific Gravity of Compacted Asphalt Mixtures Using Saturated Surface Dry Specimens” and AASHTO T209 “Theoretical Maximum Specific Gravity and Density of Bituminous Pavement Mixtures”.
The volumetrics of mixes made of each trial gradations were calculated and a design aggregate structure was chosen that best satisfied the specifications laid out by the NCDOT for a standard 9.5 mix as specified in Table 4.6.
Table 4.6 NCDOT Superpave Mix Design Criteria for 9.5B Mix
Mix Type Design ESALS (Million) Binder PG Grade Compaction Levels (Gmm
@) Max. Rut Depth (mm) Volumetric Properties
Nini Ndes
VMA (% Min.) VTM (%) VFA (Min-Max) %Gmm
@ Nini
(Max) S9.5B 0.3 – 3 64 –
22 7 65 9.5 15.5
3.0
-5.0 65 – 80 90.5%
Design Parameter Design Criteria
Trial 1 gradation was found to meet all the NCDOT superpave Mix Design Criteria while trial 2 and 3 were found to have unsatisfactory volumetric results. Hence trial 1 gradation was chosen as the design aggreggate structure.
Table 4.7 Mix Volumetrics for Trial 1 Aggregate Blend
Virgin Binder
Binder Content
Air Voids
Compaction
Levels (Gmm@) Volumetric Properties
Nini Ndes VMA VFA %GNmm @ ini
PG
64-22 6% 4.21% 7 65 16.07% 73.77% 87.93%
Dust to Binder Ratio (P0.075/ Pbe) 1.01
Once the design aggregate was selected, mixes with different asphalt contents in the range of ±0.5% & +1% to the initial binder content of 6% was used. Since this project focusses on 9.5B mixes a virgin binder grade of PG64-22 was used initially throughout this process of determining the design aggregate structure and optimum binder content. The ranges for the mixing and compaction temperatures were determined for each binders used in the mixtures using the temperature – viscosity graph obtained with the help of binder samples tested using rotational viscometer as per AASHTO T316 “Standard Method of Test for Viscosity