Experimental Study on Ultimate Strength of Flexural-Failure-Type RC Beams
under Impact Loading
N. Kishi 1), O. Nakano 2~, K. G. Matsuoka 1), and T. Ando 1~
1) Dept. of Civil Engineering, Muroran Institute of Technology, Muroran, 050-8585, Japan
2) Muroran Development & Construction Department, Hokkaido Development Bureau, Muroran, 051-8524, Japan A B S T R A C T
In this paper, to estimate the ultimate strength of flexural-failure-type Reinforced Concrete (RC) beams under impact loading, falling-weight impact tests were conducted. Eight simply supported rectangular RC beams were used, each with a clear-span length of 2 m. Impact load was surcharged onto the mid-span by flee-falling 200 kg steel weight. Cross sectional dimensions, rebar ratio, and impact velocity were taken as variables. In this experiment, impact force excited in steel weight, reaction force, and mid-span displacement were measured and recorded by wide-band analog data recorder. The tests show that the ultimate strength of flexural-failure-type RC beams subjected to impact load can be estimated by using the maximum reaction force at failure and that this type of RC beam can be rationally designed with a certain safety margin using the relationship between maximum reaction force and static bending capacity.
I N T R O D U C T I O N
Reinforced Concrete (RC) and Prestressed Concrete (PC) structures such as nuclear power plants should be designed with a certain safety margin against impact load. However, in Japan, these structures usually are constructed based on static design, because design manuals for impact-resistant RC/PC structural members (beam, slab, column) have never yet been drafted, even for RC beams.
In this study, to establish a rational impact-resistant design procedure of flexural-failure-type RC beams, falling-weight impact tests were conducted for eight RC beams. The impact-resistant behavior of RC beams of this type was investigated by analyzing the following experimental results: 1) time histories of impact force, reaction force, and mid-span displacement; 2) hysteretic loops of impact force - displacement and reaction force - displacement; 3) relationship between dynamic responses (maximum reaction force and cumulative residual displacement) and impact velocity; and 4) dynamic response ratio of maximum reaction force to static bending capacity and ratio of absorbed energy to input kinetic energy. EXPERIMENTAL OVERVIEW
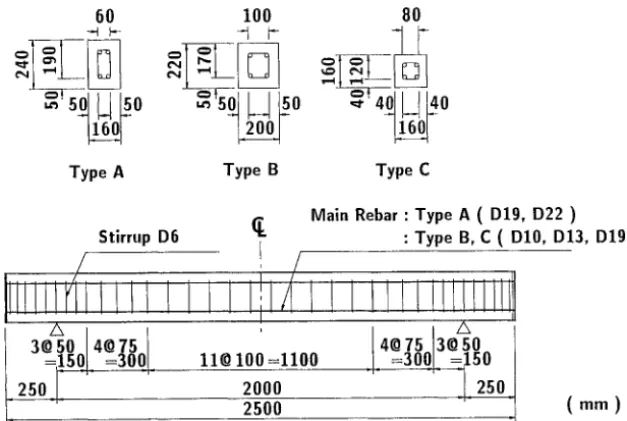
Dimensions and static design values of RC beams
Figure 1 shows the dimensions of RC beams used in this study. All RC beams are of rectangular cross section with two deformed main rebars. The clear-span length is 2 m. The cross sectional dimensions and rebar ratio were varied.
The static design values for all these RC beams are listed in Table 1. Each specimen is designated by cross sectional type (A: 160 × 240 ram, B: 200 × 220 mm, C: 160 × 160 mm) and main rebar diameter (10, 13, 19, and 22 mm). Static bending capacity P , sc and static shear capacity V , sc are calculated according to the Japan Concrete Standard [1], and static shear-bending capacity ratio a is obtained by dividing V,,~,c by P , sc. According to the manual, all RC beams considered here will collapse in bending-failure mode under static loading because their a ratios exceed 1.0. At commencement of the experiments, the average concrete compressive strength was approximately 26.5 MPa.
Test procedure
Each RC beam was simply supported at a point 250 mm inside from the ends and was pinched on the top and bottom surface at the support points to prevent the beam from rebounding (Photo 1). Impact tests were conducted by iterative loading of a free-falling 200 kg steel weight, in which impact velocity was increased in increments of 1 m/s from 1 m/s initial impact velocity until the RC beam reached the ultimate state. Impact velocity was defined as the velocity at which the steel weight impacts onto the RC beam. The ultimate state is assumed to be that when the cumulative residual displacement of RC beam approaches 2.0 % of clear-span length (Photo 1). Impact load was surcharged onto the mid-span of RC beam for all test
c a s e s .
Impact force excited in steel weight, reaction force, and mid-span displacement (hereinafter, displacement) were measured and recorded by wide-band analog data recorder. The allowable frequencies of load cells and LVDT are 4 kHz and 915 Hz, respectively. All these analog data were converted to digital with 100 ,us sampling time.
SMiRT 16, Washington DC, August 2001
Paper # 1525
6O
o=,
100 8O
Type A Type B Type C
I Stirrup D6
Main Rebar • Type A ( D19, D22 ) • Type B, C ( D10, D13, D19 )
A
3@ 50 ] 4@ 75
=,150{ =300 11@ 100=1100 ' I. 4 @ 75 130 50 =3001 =)50 -,~ ~,
2000 ] 250
2500 '- "
Fig. 1 Dimensions of RC beams
( m m )
Table 1 Static design values and impact velocity
Specimen
A-19 A-22 B-10 B-13 B-19 C-10 C-13
C - 1 9
Dimensions of Cross Section
( m m ) 160 × 160
(Type A)
200 x 220 (Type B )
160 X 160 (Type C)
Diameter of Main Rebar
(mm) 19 22
Rebar Ratio
p~ ( % )
19
1.88 2.55
Static Bending Capacity P . ~ ( k N )
64.6 83.3
Static Shear Capacity V.~ ( k N )
1.69
126.9 130.9
Shear-Bending Capacity Ratio
a(=V.~/ P.~)
3.10 1.90
Impact Velocity
V( m/s )
58.8
1 6 1 6
10 0.42 16.9 98.9 5.85 1 4
13 0.75 26.9 106.6 3.96 1 5
1 6
0.74 1.32 2.98
125.4 68.8 74.1 87.0 10
13 19
2.13 6.04 4.36 2.30 11.4
17.0 37.9
1 3
1 4 1 5
ii!',i',iq !,
. ii%~
:~:~:~: ,-~::- ~: ' " ... :.::::N ... :-::-: ... ~.,' ... ~-~::::~ ... :.: ... : ... • ... ::: ... :: ... ? }:i!::i::!ii::i;iii~ ~,~il;: :: . .::i~.:~i;iiiii::iiiiiii!!!itili;~:~;:i::iiii::iii~;i::::? ~ :7%/:::~i!ili:i;iii}i:: ::~:~*~::: . . . iiiiiiii#:::ii}::i::::i:::¢:;!i::;¢K:!¢i~i).iiiiiii;!i:.:;:.% %; :::>:%::::::~!!!!};iii::i:
V=
lm/s
2m/s
3m/s
4m/s 150
75
0
-75
(kN) Impact Force, P
LC'2ml
150 75
0
-75
(kN) Reaction Force, R
IWm_-~
150 75
0
- 7 5
150
75
-75
150 150
75 ' / 75
0 . . . L,r-"--.,-..= . . . 0 - -
-75 -75
~ l d l r
150 150
75 ~ 75
0 ~ ~ ' ' ~ ' ~ - . . . --- 0
-750 20 40 60 80 100 -750
Time(msec)
(cm) Mid- Span Disp.,
4 2
0 ' '
- 2
4
2
0 ~ ~
- 2
4
2
0 . ~ " ~ ~ ' - - ' - - - - - 2
4
o
J/
- 2
0
20 40 60 80 100 20 40 60 80 100
Time(msec) Time(msec)
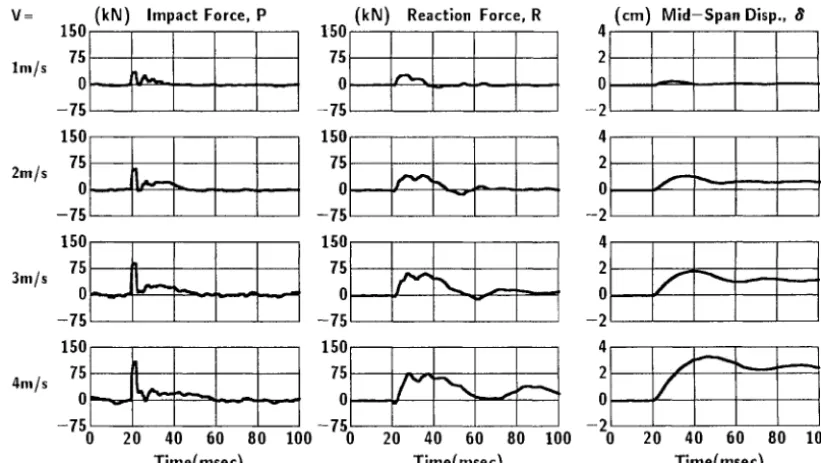
Fig. 2 T i m e histories of impact force, reaction force and m i d - s p a n d i s p l a c e m e n t (B-IO)
E X P E R I M E N T A L R E S U L T S AND D I S C U S S I O N
T i m e histories of i m p a c t force, reaction force, and m i d - s p a n d i s p l a c e m e n t
Figure 2 shows the time histories of impact force P, reaction force R, and mid-span displacement 6 for beam B-10. Here, reaction force was evaluated summing up the values obtained from both supporting points. These figures plot the impact force as two half-sine waves: an incidental wave having extremely short duration at the beginning of impact, and a main wave having relatively longer duration irrespective of the magnitude of impact velocity. The maximum impact force is increased and the duration of main wave is prolonged according to increase in the impact velocity. In contrast, reaction force is plotted as only one half-sine wave, and the configuration of the wave during impact loading resembles that of displacement wave.
Regarding displacement wave, in the case of V = 1 m/s impact velocity, it can be seen that only one half-sine wave is excited. In the cases of V > 1 m/s, maximum displacement is increased and duration of main wave is prolonged with increase in impact velocity. After impact force is unloaded, the displacement fluctuates faintly accompanied by drift. Also, the residual displacement is increased with each increment of impact velocity. This suggests that the damage to RC beams progresses. Hysteretic loops of i m p a c t force - d i s p l a c e m e n t and reaction force - d i s p l a c e m e n t
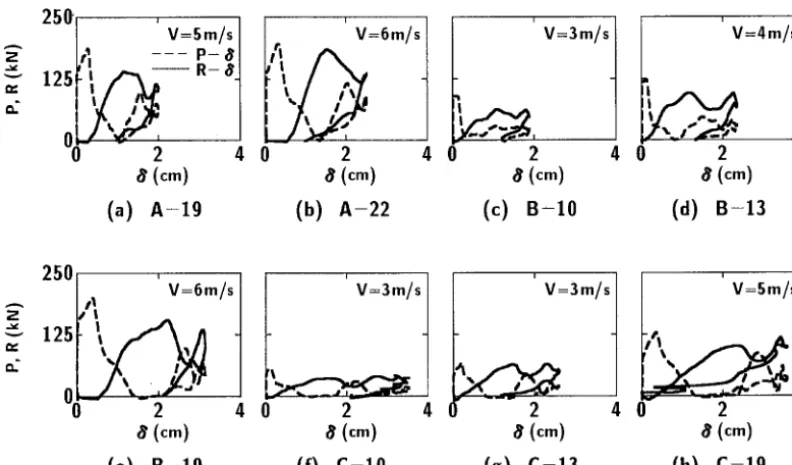
Hysteretic loops of impact force - displacement P-6 and reaction force - displacement R,6 for beam B-10 are shown in Fig. 3. The figure shows that in the case of V = 1 m/s impact velocity, the RC beam may behave almost elastically because the absorbed energy estimated by integrating the looped area is very small. In the cases of V > 1 m/s, the absorbed energy is increased with each increment of impact velocity.
Figure 4 shows the hysteretic loops of P-6 and R-6 for all RC beams at the final impact test. These figures show that the distribution characteristics of P-6 and R-6 loops differ from each other. Impact force increases very rapidly up to the maximum value at very beginning of impact, and decreases almost to zero, irrespective of the beam type. After that, impact force increases again to the second peak and then decreases to zero. In this way, the configurations of P-6 loops are complex. In contrast, reaction force increases linearly up to the maximum value. After that, almost the same value is continuously kept until the displacement reaches its maximum value, and then decreases to zero. The R-6 loops may be assumed to be a parallelogram whose configuration is simple.
150[
~'.~
100 I
/
V = l m / s
2 4 0
~ ( c m )
V=2m/s
V=3m/s
V=4m/s
½
4
4
(~,.)
~ (~m)
~ (~m)
Fig. 3 Hysteretic loops of impact force - displacement and reaction force - displacement (B-l 0)
250
]
v:
,,. 125
00P,
e(cm)
V=Sm/s
P - a
R - #
(a) A - 1 9
' V =
4 0
2
a' (,:m)
i
V-Om/s
i r
4 0 2
V=3m/s
~(c~)
(b) A-22
(c)
B - 1 0
l
' V=4m/s
r -
4 0
2
4
a, (cr.)
(d) B-T3
250
-.
I,,
' V=6m/s [
125
e~
=2
O0
2
4 0
a' (,:m)
(e)
B - 1 9
i
V=3m/s
2 4
a (~,.)
(f)
C - 1 0' V=3m/s
' V=Sm/s /
4
0
2
4
( ~ )
~ ( ~ )
(g) c-13
(h)
c - 1 9
Fig. 4 Hysteretic loops of impact force - displacement and reaction force - displacement
at final impact test for all RC beams
Relationship between dynamic responses and impact velocity
Maximum reaction force
R,d
and cumulative residual displacement 3c,-each is plotted against impact velocity in Fig. 5. Here, to investigate the effect of cross sectional dimensions and rebar ratio on dynamic response characteristics of RC beams, two pairs of RC beams (beams A-19 and B-19, and beams B-10 and C-13) are compared. Each beam in the pair has a static bending capacity similar to the other beam in the same pair. These figures show that the maximum reaction force increases monotonically with the increase in impact velocity. In contrast, the cumulative residual displacement increases steeply with each increment of impact velocity. Comparing the dynamic responses between A-19 and B-19, and between B-10 and C-13, it can be observed that the values of maximum reaction force and/or the cumulative residual displacement are almost same between the RC beams, when the static bending capacities of RC beams are similar to each other.Relationship between the maximum reaction force and static bending capacity
240 ~e 200
= 160
L L
0
'~ 120
0= 80
E
E 40
0
(a)
Fig. 5
|
O • A - 1 9
• • B - 1 9
77 • B - 1 0
• C-13 ®
/ ..D i , , ~
Impact Velocity, V (m/s)
( , J
e,o
m_ r~
e i I
.'2_ r,n
~J tY = i t~ l = E =
| n
O • A - 1 9 v • B-19
D • B - 1 0
• C-13 / / / / / //
. . v
1 2 3
!
t
// //
o
4 s 6
Impact Velocity, V ( m / s )
Maximum reaction force (b) Cumulative residual displacement
Relationship between m a x i m u m reaction force and impact velocity and
between cumulative residual displacement and impact velocity
Fig. 6
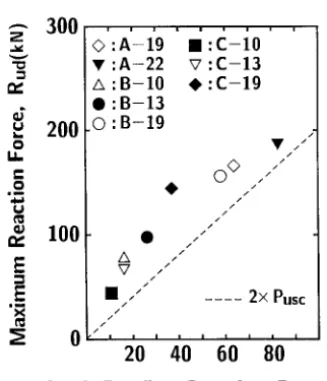
300
Z
u 200
x . .
O EL O = i 100 E E a l X t~ 0
~ " A'-1'9 • : A - 2 2
A : B - 1 0
Q :B-13 O : B - 1 9
' i . E - i o " C - 1 3
. C - 1 9
/ /
Q / -
/ /
A .
/
I / / /
/ / / /
i
'
'
go
2O
• /1
/
2× Pusc
O .."
J / / J
'130'
Static Bending Capacity, P u s c ( k N )
Relationship between m a x i m u m reaction force and static bending capacity
R a t i o of a b s o r b e d e n e r g y to input kinetic e n e r g y
The ratio of absorbed energy to input kinetic energy Ea / Ek for each RC beam at failure is plotted in Fig. 7, where Ea is absorbed energy estimated using looped area of reaction force - displacement curve (Fig. 4) and Ek is input kinetic energy
(=
mV2/2;
m" mass of steel weight, V: impact velocity). The figure shows that these values are distributed in the region from0.5 through 0.9. The mean value is about 0.7.
P R O P O S A L O F I M P A C T - R E S I s T A N T D E S I G N P R O C E D U R E
ua 1.0
¢U
tEl
0.8
, B
0.6
x . .
ua 0.4
T o.2
x _
o 0.0
/•-•(3)
-
(4)
\
0.08
~e,
/
\
; _~: . . . . ~,____/_ \ / \ \ ....
l
//(3)
~
(o) ~e'
(6)
(5)
(o)
( )" Impact Velocity, V ( m / s )
Ai9 Ai2 Bio Bi3 Bi9 cio ci3 ci9
Type of Specimen
Fig. 7 Ratio of absorbed energy to input kinetic energy
Rud
EL
e~
0
r
Mid-Span Displacement
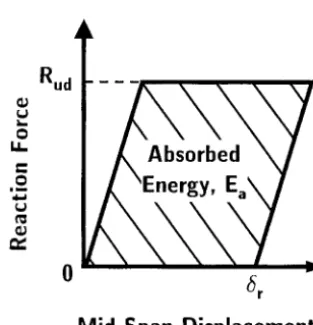
Fig. 8 A simplified model for reaction f o r c e - displacement loop
parallelogram (Fig. 8). Using this simplified model, the required static bending capacity
P,.~.j
of RC beams against impact load can be derived setting design input kinetic energy E/~e and residual displacement 6,.j as follows:Assuming that the maximum reaction force
R,a
is 2.0 times the required static bending capacity P,~.a, and the absorbed energyEa
is 0.7 times the design input kinetic energy E,a based on the results in sections 3.5 and 3.6, the following equations are derived:R,,~
= 2.0P,,, (1)E,, = 0. 7Ek~l (2)
Here, absorbed energy E, can be written, by referring to the simplified model shown in Fig. 8, as:
E, = R,e6,.,t (3)
0.7 E~ l _ 0.35 E ~ (4) P , , , l - 2 6,-,1 6,-d
Using Eq. (4), flexural-failure-type RC beams may be rationally designed against impact load using the static bending capacity.
CONCLUSIONS
In this study, toward establishment of a rational impact-resistant design procedure of flexural-failure-type RC beams, falling-weight impact tests were conducted on eight RC beams. They revealed the following:
1) Dynamic response characteristics of flexural-failure-type RC beams are roughly the same for beams of similar static bending capacities calculated based on Japan Concrete Standard.
2) Ultimate strength of flexural-failure-type RC beams subjected to impact load can be estimated by using the maximum reaction force at failure.
3) Configuration of the hysteretic loop between reaction force and the mid-span displacement at failure of an RC beam can be approximated by a parallelogram.
4) Flexural-failure-type RC beams under impact load may be designed with a margin of safety by assuming dynamic response ratio as 2.0 and ratio of absorbed energy to input kinetic energy as 0.7.
5) Required static bending capacity for RC beams against impact load may be evaluated by a proposed simple equation. R E F E R E N C E