Scholarship at UWindsor
Scholarship at UWindsor
Electronic Theses and Dissertations
Theses, Dissertations, and Major Papers
2010
Artificial neural network and its applications in quality process
Artificial neural network and its applications in quality process
control, document recognition and biomedical imaging
control, document recognition and biomedical imaging
Mohammed Jahirul Islam
University of Windsor
Follow this and additional works at: https://scholar.uwindsor.ca/etd
Recommended Citation
Recommended Citation
Islam, Mohammed Jahirul, "Artificial neural network and its applications in quality process control, document recognition and biomedical imaging" (2010). Electronic Theses and Dissertations. 7972.
https://scholar.uwindsor.ca/etd/7972
This online database contains the full-text of PhD dissertations and Masters’ theses of University of Windsor students from 1954 forward. These documents are made available for personal study and research purposes only, in accordance with the Canadian Copyright Act and the Creative Commons license—CC BY-NC-ND (Attribution, Non-Commercial, No Derivative Works). Under this license, works must always be attributed to the copyright holder (original author), cannot be used for any commercial purposes, and may not be altered. Any other use would require the permission of the copyright holder. Students may inquire about withdrawing their dissertation and/or thesis from this database. For additional inquiries, please contact the repository administrator via email
Quality Process Control, Document Recognition
and Biomedical Imaging
by
M o h a m m e d Jahirul Islam
A Dissertation
Submitted to the Faculty of Graduate Studies
through Electrical and Computer Engineering
in Partial Fulfillment of the Requirements for
the Degree of Doctor of Philosophy at the
University of Windsor
Windsor, Ontario, Canada
1 * 1
Published Heritage Branch
Archives Canada
Direction du
Patrimoine de l'6dition
395 Wellington Street Ottawa ON K1A 0N4 Canada
395, rue Wellington Ottawa ON K1A0N4 Canada
Your We Votre r6f6rence
ISBN: 978-0-494-62766-2
Our file Notre r6f6rence
ISBN: 978-0-494-62766-2
NOTICE: AVIS:
The author has granted a
non-exclusive license allowing Library and Archives Canada to reproduce, publish, archive, preserve, conserve, communicate to the public by
telecommunication or on the Internet, loan, distribute and sell theses
worldwide, for commercial or non-commercial purposes, in microform, paper, electronic and/or any other formats.
L'auteur a accorde une licence non exclusive permettant a la Bibliotheque et Archives Canada de reproduire, publier, archiver, sauvegarder, conserver, transmettre au public par telecommunication ou par I'lnternet, preter, distribuer et vendre des theses partout dans le monde, a des fins commerciales ou autres, sur support microforme, papier, electronique et/ou autres formats.
The author retains copyright ownership and moral rights in this thesis. Neither the thesis nor substantial extracts from it may be printed or otherwise reproduced without the author's permission.
L'auteur conserve la propriete du droit d'auteur et des droits moraux qui protege cette these. Ni la these ni des extraits substantiels de celle-ci ne doivent etre imprimes ou autrement
reproduits sans son autorisation.
In compliance with the Canadian Privacy Act some supporting forms may have been removed from this thesis.
While these forms may be included in the document page count, their removal does not represent any loss of content from the thesis.
Conformement a la loi canadienne sur la protection de la vie privee, quelques formulaires secondaires ont ete enleves de cette these.
Bien que ces formulaires aient inclus dans la pagination, il n'y aura aucun contenu manquant.
All Rights Reserved. No Part of this document may be reproduced, stored or otherwise retained in
a retrieval system or transmitted in any form, on any medium by any means without prior written
I hereby certify t h a t I am the sole author of this thesis and t h a t no part of this thesis has been
published or submitted for publication.
I certify that, to the best of my knowledge, my thesis does not infringe upon anyone's copyright
nor violate any proprietary rights and t h a t any ideas, techniques, quotations, or any other material
from the work of other people included in my thesis, published or otherwise, are fully acknowledged in
accordance with the standard referencing practices. Furthermore, to the extent t h a t I have included
copyrighted material t h a t surpasses the bounds of fair dealing within the meaning of the Canada
Copyright Act, I certify t h a t I have obtained a written permission from the copyright owner(s) to
include such material(s) in my thesis and have included copies of such copyright clearances to my
appendix.
I declare t h a t this is a true copy of my thesis, including any final revisions, as approved by my
thesis committee and the Graduate Studies office, and t h a t this thesis has not been submitted for a
In computer-vision based system a digital image obtained by a digital camera would usually have
24-bit color image. The analysis of an image with t h a t many levels might require complicated image
processing techniques and higher computational costs. But in real-time application, where a part has
to be inspected within a few milliseconds, either we have t o reduce the image t o a more manageable
number of gray levels, usually two levels (binary image), and at the same time retain all necessary
features of the original image or develop a complicated technique. A binary image can be obtained by
thresholding the original image into two levels. Therefore, thresholding of a given image into binary
image is a necessary step for most image analysis and recognition techniques. In this thesis, we
have studied the effectiveness of using artificial neural network (ANN) in pharmaceutical, document
recognition and biomedical imaging applications for image thresholding and classification purposes.
Finally, we have developed edge-based, ANN-based and region-growing based image thresholding
techniques to extract low contrast objects of interest and classify them into respective classes in
those applications.
Real-time quality inspection of gelatin capsules in pharmaceutical applications is an important
issue from the point of view of industry's productivity and competitiveness. Computer vision-based
automatic quality inspection and controller system is one of the solutions to this problem. Machine
vision systems provide quality control and real-time feedback for industrial processes, overcoming
physical limitations and subjective judgment of humans. In this thesis, we have developed an
image processing system using edge-based image thresholding techniques for quality inspection that
satisfy the industrial requirements in pharmaceutical applications to pass the accepted and rejected
capsules.
thresh-olded image. Non-uniform illumination, low contrast and complex background make it challenging
in this application. In this thesis, optimal parameters for ANN-based local thresholding approach
for gray scale composite document image with non-uniform background is proposed. An exhaustive
search was conducted to select the optimal features and found t h a t pixel value, mean and entropy are
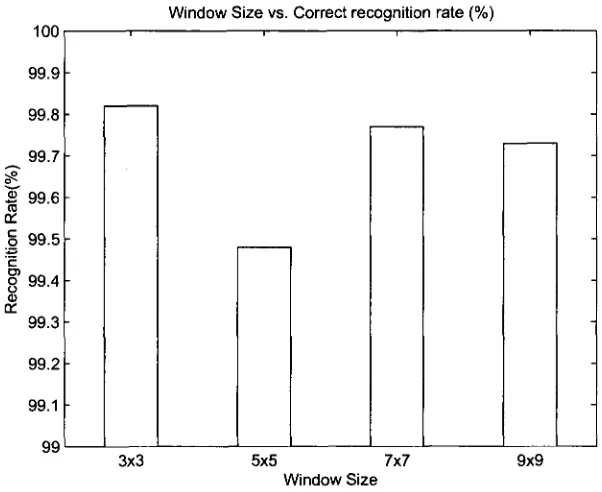
the most significant features at window size 3x3 in this application. For other applications, it might
be different, but the procedure to find the optimal parameters is same. The average recognition
rate 99.25% shows t h a t the proposed 3 features at window size 3x3 are optimal in terms of
recog-nition rate and P S N R compare to the ANN-based thresholding technique with different parameters
presented in the literature.
In biomedical imaging application, breast cancer continues to be a public health problem. In this
thesis we presented a computer aided diagnosis (CAD) system for mass detection and classification
in digitized mammograms, which performs mass detection on regions of interest (ROI) followed by
the benign-malignant classification on detected masses. Three layers ANN with seven features is
proposed for classifying the marked regions into benign and malignant and 90.91% sensitivity and
83.87% specificity is achieved t h a t is very much promising compare to the radiologist's sensitivity
First of all, I would like to express my sincere appreciation to my co-supervisors, Dr. Majid Ahmadi
and Dr. Maher A. Sid-Ahmed for their overall enthusiasm and devotion to their work t h a t impressed
me a lot. They are highly critical, while remaining very supportive. They not only provide invaluable
guidance to my study, but also sets up the best role model for me and my colleagues to follow.
I also would like to thank my committee members, Dr. Roman Maev, Dr. Jonathan Wu and Dr.
X. Chen, who monitor my work and take effort in reading and providing me with valuable comments
on my thesis.
I was lucky to work with so many energetic and intelligent classmates and colleagues. I enjoyed
every minutes I spend with them and cherish all of the help from them.
Especially, I would like to give my thanks to my parent, Mohammed Abdul Jalil, Rokeya Begum,
my wife, Tahmina Haque Khan and my angels Zafir Raeid and Rahil Raeid. Without their continuous
Contents
A u t h o r ' s D e c l a r a t i o n of Originality iv
A b s t r a c t v
A c k n o w l e d g m e n t s vii
List of F i g u r e s xii
List of T a b l e s x v i
List of A b b r e v i a t i o n s xviii
1 I n t r o d u c t i o n 1
1.1 Introduction 1
1.2 Image Segmentation 2
1.3 Quality Process Control of Pharmaceutical Manufactured Products 3
1.4 Document Image Analysis 3
1.5 Biomedical Imaging- Breast Cancer Detection 4
1.6 Thesis Objectives 5
1.7 Thesis Organization 6
2 I n t r o d u c t i o n t o Artificial N e u r a l N e t w o r k 7
2.1 Introduction 7
2.2 Types of ANNs 8
2.2.1 Feed-forward Neural Network 8
2.2.2 Feedback Neural Network 8
2.3.1 Supervised Learning 10
2.3.2 Unsupervised Learning 10
2.4 Multi-layer Perceptron (MLP) 10
2.5 Advantages and Disadvantages of ANNs 12
2.5.1 Advantages of ANNs [2] 12
2.5.2 Disadvantages of ANNs [2] 12
2.6 Application of ANNs 13
2.7 Conclusions 13
3 R e v i e w of I m a g e T h r e s h o l d i n g M e t h o d s a n d S t a t i s t i c a l T e x t u r e Features 15
3.1 Introduction 15
3.2 Survey Over Thresholding Techniques 16
3.2.1 Histogram-based Methods 16
3.2.2 Edge-based Methods 18
3.2.3 Clustering-based Methods 21
3.2.4 Entropy-based Methods 23
3.2.5 Local Adaptive Thresholding 23
3.2.6 Artificial Neural Network-based Methods 24
3.3 Performance Comparison of the Thresholding Techniques 25
3.4 Statistical and Texture Features 26
3.4.1 Pixel Value1 26
3.4.2 Mean2 26
3.4.3 Standard Deviation3 27
3.4.4 Smoothness4 27
3.4.5 Entropy5 27
3.4.6 Skewness6 27
3.4.7 Kurtosis7 28
3.4.8 Uniformity8 28
3.5 ANN-based Thresholding Using Statistical Texture Features 28
3.6 Conclusion 29
4 Efficient A N N - b a s e d T h r e s h o l d i n g in D o c u m e n t R e c o g n i t i o n A p p l i c a t i o n 3 2
4.1 Introduction 32
4.3 Proposed Method 37
4.3.1 Phase I-Optimal Parameters Selection 37
4.3.2 Phase II-Efficient ANN-based Thresholding Method 39
4.4 Simulation Results 40
4.4.1 Image Database 40
4.4.2 Training and Testing Results 41
4.4.3 Optimal Features Validation 43
4.4.4 Performance Evaluation of the Proposed Method 56
4.5 Conclusions 57
5 E d g e - b a s e d T h r e s h o l d i n g a n d Q u a l i t y P r o c e s s C o n t r o l 6 2
5.1 Introduction 62
5.2 Existing Quality Control and Criticisms 63
5.3 Current State-of-the-art Solutions 65
5.4 Capsule Inspection System- OptiSorter 65
5.5 Proposed Methodology 66
5.5.1 Preprocessing 67
5.5.2 Image Segmentation 69
5.5.3 Border Tracing 71
5.5.4 Circle Fitting 72
5.6 Simulation Results and Performance Evaluation 73
5.6.1 Rationale Using Four Cameras 82
5.7 Conclusion 82
6 A N N - b a s e d M a s s Classification in B i o m e d i c a l I m a g i n g 85
6.1 Introduction 85
6.2 Literature Survey 86
6.3 Haralick Texture Features [98, 105] 88
6.3.1 Gray Level Co-occurrence Matrix 88
6.3.2 Statistical Properties of GLCM and Haralick Features Calculation 89
6.4 Proposed Methods 91
6.4.1 ROI Preprocessing 92
6.4.2 Mass Extraction 95
6.5 Simulation Results and Performance Evaluation 102
6.5.1 Image Database 102
6.5.2 Results and Performance 102
6.6 Validation 108
6.7 Conclusion 108
7 C o n c l u s i o n a n d F u t u r e R e s e a r c h 114
7.1 Conclusions 114
7.2 Contributions and Future work 116
R e f e r e n c e s 118
A R e c o g n i t i o n R a t e - G r i d - b a s e d M e t h o d 125
List of Figures
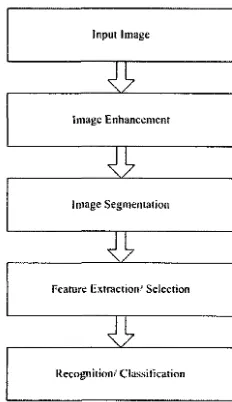
1.1 Principal stages of image analysis system 2
2.1 Supervised learning of ANN 8
2.2 Multi-layer feed-forward network model 9
2.3 Complicated feed-forward/ feedback network 9
2.4 Flow chart of the training steps of MLP ANN 11
3.1 Sample Training Data Preparation 29
3.2 Sample Binary Image using NN-based Thresholding 30
4.1 Principal Stages of Document Analysis System 33
4.2 Sample Document Image- (poor contrast) 33
4.3 Sample Document Image- (non-uniform illumination) 34
4.4 Sample Document Image- (composite with complex background) 34
4.5 Sample Document Image- (Insect) 35
4.6 More Sample Document Images 1 35
4.7 More Sample Document Images 2 36
4.8 No. of features subset for each combination 38
4.9 Grid-based Method for Tabulating Recognition Rate- Subset vs. Window Size . . . . 39
4.10 Test Setup 39
4.11 Window Size Vs. Process Time (fis) for each pixel 45
4.12 Window Size Vs. Character recognition rate (%) 46
4.13 Binary Image Using Proposed Method of figure 4.2 46
4.14 Binary Image Using Proposed Method of figure 4.3 47
4.16 Sample Base Document 1 48
4.17 Sample Base Document 2 49
4.18 Sample Watermark 1 50
4.19 Sample Watermark 2 50
4.20 Sample Watermark 3 51
4.21 Sample Watermark 4 51
4.22 Sample Document Watermarked Image 1 52
4.23 Sample Document Watermarked Image 2 52
4.24 Sample Document Watermarked Image 3 53
4.25 Sample Document Watermarked Image 4 53
4.26 Binary Image 1 Using Proposed 3 Features 54
4.27 Binary Image 2 Using Proposed 3 Features 54
4.28 Binary Image 3 Using Proposed 3 Features 55
4.29 Binary Image 4 Using Proposed 3 Features 55
4.30 O C R output: From Binary Image 4.15 (Proposed) vs. Expected 57
4.31 OCR output: From Original Image vs. Expected 58
4.32 O C R output: From Binary Image 4.13 (Proposed) vs. Expected 58
4.33 O C R output: From Binary Image 4.14 (Proposed) vs. Expected 59
4.34 O C R output: From Binary Image (Using Otsu [37]) 59
4.35 O C R output: From Binary Image (Using Niblack [54]) 60
4.36 Segmentation Performance Comparison: Proposed, HMM[32], Kittler [38] and Otsu
[37] 61
5.1 Typical defects (Source: Pharmaphil Inc., Windsor, ON) 63
5.2 Current capsule sorting system 64
5.3 Current capsule sorting system- Conveyor belt 64
5.4 Image acquisition system 66
5.5 Capsule image- Top, Bottom, Right and Left camera view 67
5.6 Typical capsule image (Source: Pharmaphill Inc.) 68
5.7 Block diagram of the proposed image processing system 68
5.8 Flow chart of the proposed capsule extraction method 71
5.9 Image enhancement using different Techniques 74
5.10 Quantitative measures of different image enhancement techniques 75
5.12 Binary image using Otsu [37] and Kittler [38] 76
5.13 Training dataset generation using [67] 77
5.14 Binary image using ANN [67] 77
5.15 Edge-based segmentation 78
5.16 Closed view of edge-based segmentation 79
5.17 Good capsule image using the proposed method 79
5.18 Dented capsule image using the proposed method- Example 1 80
5.19 Dented capsule image using the proposed method- Example 2 80
5.20 Binary image of left camera image using proposed method 81
5.21 Binary image of right camera image using proposed method 82
5.22 Bottom and left camera view of a defective capsule 83
5.23 Right and top camera view of a defective capsule 83
6.1 Sample mammogram and principal stages of breast cancer detection 86
6.2 Example of GLCM for d = 1: (a) The original image (b) Final result of the horizontal
GLCM d = 1. c) Four directions (0°, 45°, 90°, 135°) 89
6.3 X-ray label removal from the original mammogram 92
6.4 Breast extraction- Global ROI 93
6.5 ROI extraction and sample ROI 95
6.6 Sample Original and Enhanced ROIs 96
6.7 ROI division into blocks and seed block detection 97
6.8 Haralick Texture Features (1-4) 98
6.9 Haralick Texture Features (5-8) 98
6.10 Haralick Texture Features (9-13) 99
6.11 Flow chart of the proposed automatic seeded region growing method 100
6.12 Extracted mass from the ROI 100
6.13 Training data preparation and mass classification 101
6.14 Sample extracted mass using proposed method 103
6.15 Sample extracted contour using proposed method 103
6.16 Segmentation Performance Evaluation- Example 1 105
6.17 Segmentation Performance Evaluation- Example 2 105
6.18 Mass Classification- Example 1, Correct Classification (Benign mass) 106
6.20 Mass Classification- Example 3, Misclassification (Classified as Benign, actually
Ma-lignant) 107
6.21 Validation- Example 1, Background, Object, Combined Image and Enhanced Image 109
6.22 Validation- Example 1, Automated Seed Selection 109
6.23 Validation- Example 1, Segmented Leaf, Extracted Contour and Extracted Leaf . . . 110
6.24 Validation- Example 2, Background, Object, Combined Image and Enhanced Image 110
6.25 Validation- Example 2, Automated Seed Selection I l l
6.26 Validation- Example 2, Segmented Leaf, Extracted Contour and Extracted Leaf . . . I l l
6.27 Validation- Example 3, Background, Object, Combined Image and Enhanced Image 112
6.28 Validation- Example 3, Automated Seed Selection 112
6.29 Validation- Example 3, Segmented Leaf, Extracted Contour and Extracted Leaf . . . 113
A.l Recognition rate in various window size- Table A.l 126
A.2 Recognition rate in various window size- Table A.2 127
List of Tables
3.1 Horizontal mask of Sobel Edge Detector 19
3.2 Vertical mask of Sobel Edge Detector 19
3.3 Horizontal mask of Prewit Edge Detector 19
3.4 Vertical mask of Prewit Edge Detector 19
3.5 Roberts' Edge Detector (-45°) 19
3.6 Roberts' Edge Detector (+45°) 19
3.7 Neural Network Structure used by Alginahi [7] 30
4.1 Proposed Efficient ANN Structure 40
4.2 Comparative Statement of Recognition Rates- Using Binary and Original Image . . 42
4.3 Comparative Statement of Recognition Rates-Features Combination 42
4.4 Window Size Vs. Thresholding Time (Sec) 43
4.5 Window Size Vs. Correct Recognition Rate (%) 44
4.6 Window Size Vs. Process Time for each pixel 45
4.7 Number of Features Vs. Process Time (Sec) 45
4.8 PSNR Measurement for Different Parameters 48
4.9 Recognition Rate Comparison- Proposed, Niblack [54] and Otsu [37]- (Figure 4.4) . . 56
4.10 Performance Evaluation of the Proposed Method in Different Categories 57
4.11 Performance of the Proposed Method Using Optimal Features 59
5.1 Co-ordinates of eight neighbors of a pixel 72
5.2 Neural Network Architecture 78
5.3 Quality Inspection Result 84
6.1 Simulation Result: Mass Segmentation 102
6.2 Proposed ANN Structure for Mass Classification 106
6.3 Comparative Statement of Classification 107
ANN Artificial Neural Network. CAD Computer Aided Diagnosis. CCD Charged Coupled Device. CM Completeness.
CR Correctness.
CVIS Capsules Visual Inspection System. DAS Document Analysis System.
D T R E G Decision Tree Regression. EC Expected Characters. E R Estimated Region. F N False Negative. F P False Positive.
GLCD Gray Level Dependence Matrix. GLCM Gray Level Co-occurance Matrix. HMM Hidden Markov Model.
LMS Least Mean Square.
LDA Linear Discriminant Analysis. LoG Laplacian of a Gaussian. M E T Minimum Error Thresholding. MLO Medio Lateral Oblique. MLP Multilayer Perceptron. MSE Mean Square Error. NDT Non Destructive Testing. NN Neural Network.
O C R Optical Character Recognition. ON Ontario.
P C Personal Computer.
PEIPA Pilot European Image Processing Archive. P S N R Peak Signal to Noise Ration.
QIR Quadratic Integral Ratio. RC Recognized Characters. ROI Region of Interest.
SGLD Spatial Gray Level Dependence. SN Sensitivity.
SOFM Self Organizing Feature Map. SOM Self Organizing Map.
Introduction
1.1 Introduction
Image analysis system refers to the extraction of meaningful information from acquired images by
means of image processing techniques. In any applications t h a t uses computer vision to automate the
respective process, image analysis system plays a great role. The principal stages of an image analysis
system is shown in figure 1.1. Each of the steps is an individual research fields and needs intensive
study for dealing with low contrast images of complex background for example transparent gelatin
capsules in pharmaceutical manufacturing, document images in document recognition and x-ray
mammograms in biomedical imaging applications. However, image segmentation is one of the vital
steps for the performance of the computer vision-based system as well as pattern recognition in any
applications. Success of the vision-based system mostly depends on the quality of the binary image.
The complex background, non-uniform illumination and low contrast makes the image segmentation
very much challenging. Therefore, image segmentation is an important step and automatic image
segmentation makes the process faster, accurate and easier in image analysis system.
Artificial Neural Network (ANN) is one of the important image analysis tools inspired by human
perception models. ANN can handles all the challenges in image segmentation for example low
contrast, complex background and non-uniform illumination. In this thesis, several methods are
de-veloped using ANN and edge-detectors for image segmentation and classification. These are efficient
Figure 1.1: Principal stages of image analysis system
seeded region growing for mass extraction in digitized mammogram using Haralick texture features
and efficient ANN-based mass classification in biomedical imaging and finally edge-based
thresh-olding and its application in quality inspection of transparent gelatin capsules in pharmaceutical
manufacturing applications.
1.2 Image Segmentation
In computer vision, segmentation refers to the process of recognizing homogeneous regions within
an image as distinct and belonging to different objects. The segmentation process can be based
on finding the maximum homogeneity in gray levels within the regions identified. The goal of
segmentation is to simplify a n d / o r change the representation of an image into something t h a t is
more meaningful and easier to analyze. Because, in computer vision-based system, the digital
color image is represented by 24-bit (16- millions levels) or gray scale image (scanned document,
X-ray mammograms) by 8-bit (256 levels). The analysis of an image with t h a t many levels might
require complicated techniques and higher computational cost. But in real time application an
image must be analyzed within a few milliseconds. Therefore, either we have to reduce the image t o
a more manageable number of gray levels, usually two levels (binary image), and at the same time
retain all necessary features of the original image or we have to develop complicated techniques.
obtained by thresholding the image into two levels.
1.3 Quality Process Control of Pharmaceutical Manufactured
P r o d u c t s
One of the most important needs, perhaps the most urgent from the point of view of industry
pro-ductivity and competitiveness, is automatic inspection. Early detection of defects in the production
means lower costs and faster feedback on the production line in order to eliminate the causes of
defects, overcome physical limitations and subjective judgment of humans. In pharmaceutical
in-dustry, zero defect quality capsules are highly required in competitive markets. Therefore, a very
cost effective, high throughput and reliable quality inspection method is important in t h a t industry.
Two part (body and cap) gelatin capsules are sensitive to several common flaws t h a t make them
unacceptable for shipment and marketing. These flaws are incorrect size or color, dents, cracks,
holes, bubbles, missing caps and so on.
As consumers are demanding t h a t products be free of defects, 100% inspection and automated
inspection have to be applied to achieve the zero-defect and at the same time to maintain the high
throughput, all defects must be detected in a single inspection. A computer vision-based quality
inspection can be one solution to solve these types of problems. In this thesis we have developed a
computer vision-based quality inspection system capable of isolating and inspecting capsules at the
rate of 1000 capsules per minute with over 95% accuracy of detecting defects of size 0.2 mm and
larger.
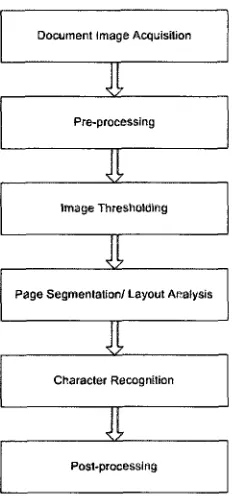
1.4 D o c u m e n t Image Analysis
Document image analysis refers to algorithms and techniques t h a t are applied to document images
to obtain a computer-readable description from pixel data. Document image contains only raw
d a t a that must be further analyzed to process the information. Document image analysis provides
fast storage, recall and distribution of documents in work flow processing mostly in business and
government applications. In order to provide more flexible retrieval and manipulation capabilities,
document analysis system helps to interpret the information represented in the stored images. The
most potential application of document image analysis systems are automatic recognition of different
forms for example income tax forms, admission forms, postal address and bank cheques reading,
Giant steps have been taken in the last decade, both in terms of technological supports and in
software products to provide computerized DAS. Optical Character Recognition (OCR) contributes
t o this progress by providing techniques to convert large volumes of texts to readable files
automati-cally. There are so many papers and patents claiming recognition rates as high as 99.99%, this gives
the impression t h a t OCR problems seem to have been solved. However, the failure of some real
applications shows t h a t performance problems subsist on composite and degraded paper documents
with non-uniform background. Non-uniform background is caused by watermarks and complex
pat-terns used in printing security documents. Transforming composite documents with non-uniform
background into electronic format in a form suitable for efficient storage, retrieval and interpretation
continues to be a challenging problem. Thresholding is a popular tool for image segmentation t h a t
tries to identify and extract the object from its background on which it is superimposed. In general,
performance of the image thresholding technique depends on the type of document, image
illumina-tion, contrast and the complexity of the image background. In this thesis, an exhaustive search was
conducted to find the optimal parameter set t h a t was used to develop an efficient ANN-based local
thresholding method.
1.5 Biomedical Imaging- Breast Cancer D e t e c t i o n
Breast cancer continues to be a public health problem in the world. It is the second leading cause of
death in Canada for women, after lung cancer. In 2009, an estimated 22,700 Canadian women and
170 men were diagnosed with breast cancer and 5,400 women and 50 men died from it. So, 1 in 9
women (11%) is expected to develop breast cancer during her lifetime (by age 90) and 1 in 28 will
die from it. Early detection of breast cancer, allowing treatment at an earlier stage, can significantly
reduce breast cancer mortality.
Mammography has been one of the most reliable methods for early detection of breast carcinomas.
X-ray mammography is currently considered as standard procedure for breast cancer diagnosis.
However, retrospective studies have shown t h a t radiologists do not detect all breast cancers t h a t
are visible on the mammograms. The estimated sensitivity of radiologists in breast cancer screening
is only about 75% [1], Double reading has been suggested to be an effective approach to improve
the sensitivity. But it becomes costly because it requires twice as many radiologists' reading time.
This cost will be quite problematic considering the ongoing efforts to reduce costs of the health
care system. Cost effectiveness is one of the major requirements for a mass screening program t o
cancer diagnosis and detection based on automated segmentation of masses in mammograms. It is
expected t h a t the automated methods for classifications provides a tentative diagnosis of individual
masses, based on their physical attributes to reduce the number of false positive.
1.6 Thesis Objectives
The main aim of this study is to investigate the potentiality of using ANN in order to develop image
processing techniques to extract low contrast objects and classify them to the appropriate classes
for the applications in quality process control of pharmaceutical industry manufactured products,
efficient ANN-based local thresholding technique in document recognition and computer-aided breast
cancer diagnosis and detection from X-ray mammograms in biomedical imaging applications.
In real-time pharmaceutical manufactured products applications, it is difficult to extract an
accurate, error free capsule image from the captured image within a very short time especially
when the capsules are clear and transparent. Capsule approximation is one of the solutions for this
particular problem. From the approximated capsule image, different parameters can be measured to
detect the defects like scratches, holes, bubbles, dents, meshed and so on. One of the main objectives
of this thesis is to develop a computer vision-based quality inspection system capable of isolating
and inspecting capsules at the rate of 1000 capsules per minute with over 95% accuracy of detecting
defects of size 0.2 mm and larger.
In document recognition applications, success of OCR mostly depends on the quality of the
thresholded image. Non-uniform illumination, low contrast and complex background make it
chal-lenging in this application. In this thesis, selection of optimal parameters through exhaustive search
for NN-based local thresholding approach for gray scale composite document image with non-uniform
background is implemented. To validate the obtained features some non-uniform watermarked
doc-ument images with known binary docdoc-ument images called base docdoc-uments were used and a
quanti-tative measure PSNR was used to compare the performance with other methods discussed in this
literature.
In biomedical imaging applications, the ultimate goal is to develop CAD system for mass
de-tection and classification in digitized mammograms, which performs mass dede-tection on regions of
interest (ROI) followed by the benign-malignant classification on detected masses. In order to detect
mass effectively, a sequence of preprocessing steps are proposed to enhance the contrast of the image,
remove the noise effects, remove the X-ray label and pectoral muscle and locate the suspicious masses
The main aim of the CAD system is to increase the effectiveness and efficiency of the diagnosis and
classification process in an objective manner to reduce the numbers of false-positive of malignancies.
1.7 Thesis Organization
This thesis is organized as follows: Chapter 2 gives the brief introduction of ANN, different
struc-tures, it's importance and it's applications in real life problems. Chapter 3 reviews the different
image thresholding techniques, their limitations and strengths. It also describes the statistical and
texture features and their use in ANN-based thresholding techniques in real-time and different
off-line applications. Chapter 4 introduces the document image analysis system. An exhaustive search
is conducted to find the optimal parameters to devise ANN-based efficient thresholding technique,
it's validation and the simulation results obtained by the proposed technique is also discussed in
this chapter. Chapter 5 introduces the problems in existing quality inspection system (OptiSorter)
of gelatin capsules in pharmaceutical manufacturing applications. Current state-of-the-art solutions
and the proposed edge-based image segmentation technique to develop image analysis system for
this application are also discussed in this chapter. Chapter 6 introduces the importance of computer
aided detection of breast cancer. The proposed automatic seed selection method using Haralick
tex-ture featex-tures for region-growing segmentation technique is developed in this chapter. The extracted
mass is then used as an input to the proposed three layers NN and classify the mass into benign or
Introduction to Artificial Neural Network
2.1 Introduction
An artificial neural network is an information processing system which has been developed as a
gen-eralization of mathematical models of human cognition or neural biology, based on the assumption
that:
1. Information processing occurs at many simple computing elements (or neurons).
2. Signals are passed between computing elements over connection links.
3. Each connection link has as an associated weight, which multiplies with the signals transmitted
through it.
4. Each computing element applies an activation function to its net input (sum of weighted input
signals) to determine its output signals.
ANNs has many names such as connectionist models, parallel distributed processing models,
neuro-morphical systems, self-organizing systems and adaptive systems. The true power of ANNs
lies in their ability to represent both linear and non-linear systems and in their ability to learn the
relationships directly from the data.
ANN's synaptic weights are adjusted or trained so t h a t a particular input leads to a specific
desired or target output. Figure 2.1 shows the block diagram for a supervised learning ANN, where
Figure 2.1: Supervised learning of ANN
network output matches the desired output. Once the network is trained it can be used to test new
input data using the weights provided from the training session.
2.2 T y p e s of A N N s
ANNs can be classified according to the pattern of connections between the units and the propagation
of data. Two main distinctions can be made according to the pattern of connections.
2.2.1 Feed-forward Neural Network
The neurons in this model are grouped in layers, which are connected to the direction of passing
signals. Feed-forward ANNs allow signals to travel one way only; from input to output. There is no
feedback (loops) i.e. the output of any layer does not affect t h a t same layer. Feed-forward ANNs
tend to be straight forward networks t h a t associate inputs with outputs. They are extensively used
in pattern recognition. This type of organization is also referred to as bottom-up or top-down.
Classical examples of feed-forward neural networks are the Perceptron and Adaline. Figure 2.2
represents the structure of multi-layer feed-forward network.
2.2.2 Feedback Neural Network
Feedback networks can have signals traveling in both directions by introducing loops in the
net-work. Feedback networks are very powerful and can become extremely complicated [2]. Feedback
Input Layer Hidden Layer
Figure 2.2: Multi-layer feed-forward network model
They remain at the equilibrium point until the input changes and a new equilibrium needs to be
found. Feedback architectures are also referred to as interactive or recurrent. Examples of recurrent
networks are Anderson networks [3], Kohonen self-organizing maps (SOM) [4], and Hopfield network
[5]. Figure 2.3 shows an example of complicated feedforward/ feedback network.
2.3 T h e Learning Process of A N N s
ANNs learn by adjusting the synaptic weights between neurons, eliminating some synapses and
building new ones. All learning methods used for adaptive neural networks can be classified into
supervised learning and unsupervised learning. If the learning phase and operation phase are
per-formed in two different times, then it is called off-line learning. If they are perper-formed at the same
time then it is called on-line learning. Usually, supervised learning is done off-line and unsupervised
learning is performed on-line.
2.3.1 Supervised Learning
In supervised learning, output unit is told what its desired response to input signals ought to be.
An ANN of supervised learning, such as MLP uses the target result to guide the performance of the
neural parameters. During the learning process global information may be required. Paradigms of
supervised learning include error-correction learning, reinforcement learning and stochastic learning.
An important issue concerning supervised learning is the problem of error convergence, i.e the
minimization of error between the desired and computed unit values. The aim is to determine a set
of weights which minimizes the error. One well-known method, which is common to many learning
paradigms, is the least mean square (LMS) convergence.
2.3.2 U n s u p e r v i s e d Learning
Unsupervised learning is based upon only local information and uses no external teacher. It is also
referred to as self-organization, in the sense t h a t it self-organizes data presented to the network and
detects their emergent collective properties. Unsupervised learning of ANNs, for example SOM can
be used for clustering the input data and finding features inherent to the problem. Paradigms of
unsupervised learning are Hebbian learning and competitive learning.
2.4 Multi-layer Perceptron ( M L P )
Multi-Layer perceptron (MLP) is the most common neural network model. It uses supervised
training methods to train the network and is structured hierarchically of several perceptrons. MLPs
contain normally three layers: the input layer, hidden layers and output layer t h a t is obvious from
the figure 2.2. The training of such a network is complicated than single perceptron. T h a t is why
input, hidden and output layers and how to adjust the weights according to their contributions [6],
This problem can be solved by finding the effect of all the weights in the network by using the
back-propagation algorithm [7] which is the generalization of the least-mean-square (LMS) algorithm.
The input nodes, hidden nodes and the output nodes are connected via variable weights using
feed-forward connections. The calculated output is compared with the target output. The total mean
square error (MSE) shown in equation 2.1, is computed using all training patterns of the calculated
and target outputs.
1 m k
(2-1)
j=1 i= 1
where m is the number of examples in the training set, k is the number of output units, Tij is the
target output value (either 0.1 or 0.9) of the i — th output unit for the j — th training example, and
Oij is the actual real-valued output of the i — th output unit for the j — th training example. The
back-propagation algorithm uses an iterative gradient technique to minimize the MSE between the
calculated output and the target output. The training process is initialized by setting some small
random weights. The training data are repeatedly presented to the neural network and weights are
adjusted until the MSE is reduced to an acceptable value. Figure 2.4 shows the training steps of
MLP neural network.
2.5 Advantages and Disadvantages of A N N s
A neural network has the ability to extract patterns and detect trends t h a t are too complex to be
noticed by either humans or other computer techniques.
2.5.1 Advantages of A N N s [2]
A trained neural network can be considered as an "expert" in the area of information it has been
given to analyze. The expertise of this trained ANN can then be used to handle new situations of
interest and answer "what if' questions to t h a t area of interest. Other advantages include:
1. It has the ability to learn how to do tasks based on the data given for training or initial experience.
2. It is able to create its own organization or representation of the information it receives during
learning time.
3. ANN computations may be carried out in parallel, and special hardware devices are being designed
and manufactured which take advantage of this capability
4. Partial destruction of a network leads to the corresponding degradation of performance. However,
some network capabilities may be retained even with m a j o r network damage.
5. Neural models are highly tolerant to noisy data.
6. There is no need t o assume an underlying d a t a distribution such as usually is done in statistical
modeling.
7. Neural networks are applicable to multivariate non-linear problems.
8. The transformations of the variables are automated in the computational process.
2.5.2 Disadvantages of A N N s [2]
The main disadvantage of neural networks is t h a t they are very slow for large network, especially in
the training phase but also in the application phase t h a t makes it unsuitable for on-line processing.
Another significant disadvantage of neural networks is t h a t it is very difficult to determine how
the net is making its decision. Consequently, it is hard to determine which of the image features
being used are important and useful for classification and which are worthless. Other disadvantages
include:
1. Minimizing overfitting requires a great deal of computational effort.
2. The relationship between the input and output variables are not developed by engineering
judg-ment so t h a t the model tends to be a black box or i n p u t / o u t p u t table without analytical basis.
4. Global minima is not obtained.
2.6 Application of A N N s
The artificial neural network can be used to infer a function from observations. This is particularly
useful in applications where the complexity of the data or task makes the design of such a function
by hand impractical. It is applied in broad areas of real world problems in business, industry and
medicine [2, 6]. Since neural networks are best at identifying patterns or trends in data, they are
well suited for prediction or forecasting like sales forecasting, industrial process control, customer
research, data validation, risk management, stock market prediction, bankruptcy prediction, target
marketing and dynamic system modeling. More specifically it is also used in recognition of
speak-ers in communications, diagnosis of hepatitis, recovery of telecommunications from faulty software,
interpretation of multi-meaning Chinese words, undersea mine detection, texture analysis and
three-dimensional object recognition. Other applications include:
1. Signature recognition and verification especially in the bank transactions.
2. Shape recognition of manufactured parts.
3. Handwritten word recognition.
4. Facial recognition.
5. Thresholding or binarization of gray scale or color images.
6. Color recognition.
7. Recognition of items through color/texture.
2.7 Conclusions
ANN is a powerful d a t a modeling tool t h a t provides an alternative and better solutions when expert
knowledge is unavailable in full-fledged sense as for example in the application of document
recog-nition and biomedical imaging. The development of the ANN technology from the history shows
t h a t it was started from the desire to develop an artificial system t h a t could perform intelligent
tasks similar to those performed by the human brain. The human brain is an incredibly impressive
information processor, even though it works quite a bit slower than an ordinary computer. Many
researchers in artificial intelligence look to the organization of the brain as a model for building
in different applications because of it's simplicity in terms of organizations and learning methods.
The use of ANNs in quality inspection of gelatin capsules in pharmaceutical manufactured products,
Review of Image Thresholding Methods
and Statistical Texture Features
3.1 Introduction
To interpret or analyze an image automatically, we must have a way of identifying unambiguously
the pixels t h a t corresponds to particular features of interest. The process of identifying these pixels is
known as segmentation. It is generally the first stage and one of the critical stages in any attempt to
automatic image processing shown in figure 1.1. The role of segmentation is very important in most
tasks requiring image analysis. Because the success or failure of the tasks is directly dependent on the
success or failure of the image segmentation. Some of the image segmentation techniques are broadly
implemented in the applications involving the detection, recognition and measurement of objects in
images. These applications include but not limited to quality inspection in industrial manufactured
products, OCR, tracking of moving objects, classification of terrains in satellite images, detection
and measurement of bone, tissue, cancer in mammograms etc. and in biomedical imaging.
The automatic binarization of gray-level images or the automatic determination of an optimum
threshold value is still a difficult and challenging problem in many image processing applications.
The difficulty may arise due t o various factors, including, poor contrast, non-uniform illumination,
composite image with complex background, high noise to signal ratio, complex patterns, a n d / o r
the literature. The survey of image thresholding can be found in [8, 9, 10]. Some of the thresholding
techniques will be briefly described in the following sections.
3.2 Survey Over Thresholding Techniques
To convert the gray scale image into binary image, a threshold is chosen in between 0 (black) and
255 (white). Different binarization methods are discussed in the literatures based on the attributes
of the image. Binarization methods can be categorized into six different types. They are as follows:
1. Histogram-based methods
2. Edge-based methods
3. Clustering-based methods
4. Entropy-based methods
5. Local adaptive thresholding methods
6. Neural network-based methods.
3.2.1 Histogram-based M e t h o d s
Histogram-based methods are very simple and efficient compared to other methods because of its
low computation cost and zero memory storage requirements. In this approach, a histogram is
computed from all of the pixels in the image, and the peaks, valleys and curvature of the smoothed
histogram of the image are analyzed to locate the clusters in the image. Color or intensity can be
used as the measure. A refinement of this technique is to recursively apply the histogram-seeking
method to clusters in the image in order to divide them into smaller clusters. This is repeated with
smaller and smaller clusters until no more clusters are formed [11, 12], One disadvantage of the
histogram-seeking method is t h a t it may be difficult to identify significant peaks and valleys in the
image. However, in most applications the threshold is determined from the peak and valley detection.
For example, Sezan used peak [13], Sahasrabudhe [14] and Ohio [15] used valley to determine the
threshold. Rosenfeld [16] used the analysis of concavities of the histogram t h a t is called convex hull
and Weszka [17] used enhanced concavity by modifying its histogram. When the convex hull of the
histogram is calculated, the deepest concavity points become candidates for a threshold. Rosin [18]
bin. The point of the maximum deviation between the line and the histogram is selected as the
threshold value which is the deepest valley point.
Tsai [19] developed a moment-preserving technique for threshold selection where first three
mo-ments of both input and output images are preserved. The moment-preserving technique can be
thought of as an information transformation method which groups the pixels of an image into classes.
The variables in the so-called moment-preserving equations are determined iteratively by a recurrent
neural network and a connectionist neural network which work cooperatively. Both of the networks
are designed in such a way t h a t the sum of square errors between the moments of the input image
and those of the output version is minimized. Initially the histogram is smoothed via Gaussian
func-tion, and the resulting histogram is investigated for the presence of both valleys and sharp curvature
points. The curvature analysis becomes effective when the bimodality of the histogram is lost due
to the excessive overlapping of class histograms.
The Quadratic Integral Ratio (QIR) [20] is a global two stage histogram-based thresholding
approach. Initially the image histogram is divided into three classes, object, background and fuzzy
class. Fuzzy class is in between the object and background where it is hard to tell in which class the
pixel belongs. At second stage, final threshold is determined from the fuzzy region. QIR method
performs well on constant homogeneous background of the image possessing bimodal histogram.
Leedham et. al. [21] concluded t h a t the QIR method is more accurate in separating object from the
background t h a n other multi-stage global thresholding methods. Other techniques include shape of
the histogram [22], and histogram modification via partial differential equations [23].
The histogram based methods described above are mostly global thresholding method t h a t uses
single threshold for the entire image. These methods shows very good performance provided t h a t
the histogram of the image is clearly bimodal which is very unlikely for real world images with
noisy, non-uniform background. In t h a t case, local thresholding [24] is one of the ways to solve
the bimodal issue where the threshold is changing over the image. Local thresholding methods
divide the image into multiple non-overlap regions so t h a t the pixels are considered homogeneous
in each region. This way it tackles the non-uniformity of the image background. But in these
methods it is difficult to determine the correct window size yielding incorrect threshold value based
on the contrast and illumination of the background. It has another drawback called blocking effect
t h a t happens when the difference of the threshold level between two adjacent blocks are very large
yielding discontinuity. Some of the developed local thresholding methods are multi-level thresholding
3.2.2 Edge-based M e t h o d s
Edges are defined as the transition of gray values from object to background and the pixels around
edge are the mixture of the object and background. Edge-based methods are based on the hypothesis
t h a t gray level of the pixels around the boundary of the object and background changes abruptly
no matter how complex the background is. Edge-based method is a two stage process t h a t is shown
below:
1. Edge detection.
2. Object and background pixels localization.
The discontinuity of an edge is detected by the first and second order derivatives. In image
processing, the first order derivative is called the gradient. The gradient of 2D function f(x,y) is
defined as a vector shown in equation 3.1. The magnitude of this vector is calculated using the
equation 3.2 and the gradient direction is calculated using the equation 3.3. Gx and Gy are the
convolutions of the original image and the mask in horizontal and vertical direction respectively.
There are six edge detectors t h a t are mostly used in different applications. They are Sobel, Prewit,
Roberts, Laplacian of a Gaussian (LoG), Zero crossing and Canny [31]. Sobel finds the edges using
t h e horizontal and vertical mask shown in table 3.1 and 3.2. The horizontal and vertical mask for
Prewit edge detector is shown in table 3.3 and 3.4. Although Prewit or Sobel filters are larger
they are less sensitive to noise. Prewit is easy to implement but Sobel has slightly superior
noise-suppression characteristics. Roberts edge detector is fast since the mask is small but it is also subject
to interference by noise. If edges are not very sharp the edge detector will tend not to detect the
edge. Robert's mask are shown in tables 3.5 and 3.6 respectively. LoG and zero crossing detects the
edges by looking for zero crossing after filtering f ( x , y) with a Gaussian filter and user-specified filter
respectively. Canny edge detector looks for local maxima of f(x,y) and f(x,y) is calculated using
the derivative of a Gaussian filter. Then strong and weak edges are detected using two threshold
values and finally the weak edges connected to the strong edges are included in the output.
Vf = Gx
21
dx (3.1)3/ dy
V / = magiw f) = + (3.2)
Table 3.1: Horizontal mask of Sobel Edge Detector
-1 -2 -1
0 0 0
1 to 1
Table 3.2: Vertical mask of Sobel Edge Detector
-1 0 1
-2 0 2
-1 0 1
Table 3.3: Horizontal mask of Prewit Edge Detector
-1 -1 -1
0 0 0
1 1 1
Table 3.4: Vertical mask of Prewit Edge Detector
-1 0 1
-1 0 1
-1 0 1
Table 3.5: Roberts' Edge Detector (-45°)
0 -1
1 0
Table 3.6: Roberts' Edge Detector (+45°)
-1 0
Once the edge strength is measured, the next stage is to apply a threshold, to decide whether
edges are present or not at an image point. The lower the threshold, the more edges will be detected,
and the result will be increasingly susceptible to noise, and also to picking out irrelevant features
from the image. Conversely a high threshold may miss subtle edges, or result in fragmented edges.
Some of the developed edge based methods for different applications are described below:
Huang [32] developed edge based binarization technique for the application of document
recog-nition. In this method once edges are detected, some pixels around edges are selected to represent
object and background. Since most of the disturbing background information is ignored after the
edge detection, the selected pixels around edges form a bimodal histogram from where the threshold
value can be selected easily.
Prager [33] proposed a set of algorithms used to perform segmentation of natural scenes through
boundary analysis. The goal of the algorithm is to locate the boundaries of an object correctly in a
scene. In this method differentiation is done to find the edge-strength at each point in the image.
Then suppression is done to remove multiple edges formed by spatial differentiation of boundaries.
Then the edges are joined into line segments and the features length, contrast, frequency, mean,
variance and location of each line segment are computed. Finally, post-processing is done to remove
unwanted line segments and to build confidence for each of the remaining segments.
Perkins [34] uses an edge based technique for image segmentation. Edge based segmentation has
not been very successful because of small gaps t h a t allow merging of dissimilar regions. In order to
avoid these problems, Perkins proposes an expansion contraction technique in which edge regions
are expanded to close gaps and then contracted after the separate regions have been labeled. The
size of expansion is controlled such t h a t small regions are not engulfed by this process. The process
involves the use of Sobel edge detector for producing edge strengths and directions at every point.
The edges are thinned and the result is automatically thresholded leaving only ridges. The ridges
separate regions of different intensity but there may be small gaps. This method was used for the
application of landscape pictures and for pictures of electronic circuits.
Yalcyn et. al. [35] uses an edge based approach to real time automated visual inspection for post
manufacturing industrial parts quality inspection. In this system, the image is selectively processed
and the salient contour segments are implicitly identified as a sequence of fixation points. This not
only reduces the required computation drastically, but also enables merging of the segments and
3.2.3 Clustering-based M e t h o d s
The gray-level samples are clustered into two classes as background and object, or alternatively they
are modeled as a mixture of two Gaussians in the clustering-based methods. The Otsu method [37]
is the most cited clustering-based thresholding method. In this method the weighted sum of
within-class variances t h a t turns out to the maximization of between-within-class variances. It operates directly on
the gray level histogram P(i). This method provides satisfactory results when the number of pixels
in background and objects are similar and fails in images with complex background or degraded
images.
The weighted within-class variance is defined by:
v l ( t ) = + Q2(t)al(t) (3.4)
where the class probabilities are estimated as:
qi(t) = T,UP(i)
(3.5)
and the class means are given by
(3.6)
(t) = Ztt+i Si
Finally the individual class variances are defined by:
(3.7)
Otsu method is implemented in iterative approach. It runs through all grey levels and pick the value
t h a t minimizes weighted within-class variance t).
Kittler [38, 39] developed a computationally efficient thresholding approach called minimum
error threshodling (MET) for gray scale image binarization under the assumption t h a t the object
and background pixel gray level values being normally distributed. This method optimizes the
In the M E T technique to find the optimal threshold r it uses the simpler technique. Suppose
t h a t the histogram of the gray scale image is h(g) assuming gray level values, g, from the interval
[0..n]. The trial threshold is set at arbitrary level T. It models the two resulting pixel populations
with parameters Hi(T), (J,(T) and an a priori probability Pi(T) given, respectively, as
Pi(T) = J2h(g)
g=a
L9=a
/Pi(T)
and
^(T) =
Y,{9-^{T)}
2
h{g)
L g=a
/Pi(T)
where
0 1
a =
T + l i = 2
and
(3.8)
(3.9)
(3.10)
(3.11)
b = T i = 1 (3.12)
n i = 2
If an image has n grey levels, this method tries in succession n different levels as a threshold
value. For each grey level T, a fitting criterion J(T) is calculated, which is defined by
J ( T ) = 1 + 2 [Pi(T) l o g 0 i ( T ) + P2(T) loga2(T)]
- 2 [ P i ( T ) l o g P i ( T ) + P2( T ) l o g P2( T ) ] (3.13)
The criterion function J ( T ) in equation 3.13 can be computed easily and finding its minima is a
relatively simple task, as the function is smooth.
Chow and Nakagawa [40, 41] divides the image into non-overlapped regions. The histogram
of each region is approximated by a mixture of two Gaussian distributions to test the bimodality.
Thresholds are calculated based on the means and standard deviations of the bimodal mixture
surface yielding a single threshold value for each image pixel. Finally the image is binarized using
the threshold surface.
Other iterative clustering approaches are found Ridler [29], Yanni [26], Lloyd [42] and Cho [43].
Reddi et. al. [44] developed a fast search scheme based on the criteria proposed by Otsu [37] t h a t
maximizes inter-class variances between object and background. Sid-Ahmed [45] proved
mathe-matically t h a t the problem could be reduced to simple iterative algorithms conjectured by Ridler
[29]. Fuzzy clustering [46] is another thresholding technique where fuzzy clustering memberships are
assigned to pixels depending on their differences from the two class means.
3.2.4 Entropy-based M e t h o d s
Entropy is a statistical measure of randomness t h a t can be used to characterize the texture of
the input image. Entropy-based methods exploit the entropy of the distribution of the gray levels
in an image. Maximum entropy of the binary image is interpreted as an indication of maximum
information transfer. Kapur et.al. [36] maximize the sum of entropy so t h a t when the sum of the
two class entropies reaches its maximum, the image is said t o be optimally thresholded.
Abutaleb [47] used spatial entropy information to generate the optimal threshold followed by
two-dimensional thresholding to classify the pixels. Other entropy-based thresholding methods are
entropic thresholding [48, 49], cross entropic thresholding [50, 51], fuzzy entropic thresholding [52]
and fusion of three different entropies [53].
3.2.5 Local A d a p t i v e Thresholding
Local statistics like range, variance, or surface-fitting parameters of the neighboring pixels are used
to calculate the threshold value of each pixel in local adaptive thresholding algorithm. Niblack [54]
calculates the pixel-wise threshold value by sliding a window over the image. The threshold value
of center pixel (x, y) of a window is calculated from the mean /i and standard deviation a using the
following linear equation 3.14.
T(x,y) = fi(x,y) + k<j(x,y) (3.14)
where k is a constant which is highly tunable to extract objects from the background. Also,
the size of the window determines the quality of the binary image. Window size should be small
enough to serve local details and at the same time large enough to suppress noise. The value of k is
object.
Sauvola [55] is an improved modification of Niblack [54] method. It shows good performance on
documents where the background contains light texture, big variations and non-uniform illumination.
The threshold is calculated using the following equation 3.15.
where R is an empirical constant. It is suggested by the author t h a t the value of k = 0 . 5 and
R=128 to be used in stained and badly illuminated documents. A surface fitted to the gray-level
landscape is used as a local threshold, as in Yanowitz and Bruckstein [56] and Shen and Ip [57].
Local contrast is exploited by White et. al [58] where it compares the gray value of the pixel with
the mean gray level in some neighborhood. If the pixel value is significantly smaller t h a n the mean,
it is classified as object otherwise background.
3.2.6 Artificial Neural Network-based M e t h o d s
Very few researchers have investigated the use of neural network in thresholding of gray level images
with the recent development of artificial intelligence. Artificial neural network (ANN) based image
thresholding method calculates the threshold value based on some local statistics like mean, standard
deviation, smoothness, entropy and so on. Yan [59] introduced a technique to discriminate the pixels
into background and object according to the characteristics around every pixel. The major drawback
of such a method is t h a t binarization is based on the feature around every pixel in an image, therefore
the computational cost is much higher than others which makes it unsuitable for online applications.
Koker and Sari [60] used ANN to automatically select a global threshold value for an industrial
vision system based on the histogram of the image. The image is preprocessed by using a median
filter to remove the effects of noise. In this method the histogram of the supervised training data
(256 levels) is used as input and global threshold value t h a t is determined by visually inspecting the
histogram of the training image is used as target value. Using this procedure the training data is
prepared in different illumination environment for this particular application. In training phase, the
produced output is compared to the target output, calculates the error, adjust the synaptic weights
of the ANN until an acceptable weight is achieved to minimize the error between produced and
target outputs. This method works for this specific application and it fails for composite image with
complex background.
Khashman [61] used a supervised neural network for document image binarization where local