An improved wrapper-based feature selection
method for machinery fault diagnosis
Kar Hoou Hui*☯, Ching Sheng Ooi☯, Meng Hee Lim☯, Mohd Salman Leong☯, Salah Mahdi Al-Obaidi☯
Institute of Noise and Vibration, Universiti Teknologi Malaysia, Kuala Lumpur, Malaysia
☯These authors contributed equally to this work. *[email protected]
Abstract
A major issue of machinery fault diagnosis using vibration signals is that it is over-reliant on personnel knowledge and experience in interpreting the signal. Thus, machine learning has been adapted for machinery fault diagnosis. The quantity and quality of the input features, however, influence the fault classification performance. Feature selection plays a vital role in selecting the most representative feature subset for the machine learning algorithm. In contrast, the trade-off relationship between capability when selecting the best feature subset and computational effort is inevitable in the wrapper-based feature selection (WFS) method. This paper proposes an improved WFS technique before integration with a support vector machine (SVM) model classifier as a complete fault diagnosis system for a rolling element bearing case study. The bearing vibration dataset made available by the Case Western Reserve University Bearing Data Centre was executed using the proposed WFS and its per-formance has been analysed and discussed. The results reveal that the proposed WFS secures the best feature subset with a lower computational effort by eliminating the redun-dancy of re-evaluation. The proposed WFS has therefore been found to be capable and effi-cient to carry out feature selection tasks.
Introduction
Condition monitoring and fault diagnosis is essential for a wide range of mechanical compo-nents to ensure optimal performance. A bearing is a common mechanical component that has an appreciable impact on machine integrity. Vibration signal analysis has been proven to be the most effective method for rotating machinery fault diagnosis. Its effectiveness, however, is highly dependent on the knowledge and experience of the operator [1]. There has been increasing interest in automated machinery fault diagnosis through the adaptive machine learning approach. This provides a more consistent diagnostic outcome; however, the quantity and quality of the input features have a great influence on the fault diagnostic performance. The complexity of the features that have been extracted from a continuous vibration signal leads to the capability of the features remaining unknown, resulting in unconvincing informa-tion conversion and representativeness for various condiinforma-tions, stages or intermediate cycles [2–6]. Meanwhile, an abundance of feature inputs leads to overfitting outcomes. Thus, feature a1111111111 a1111111111 a1111111111 a1111111111 a1111111111 OPEN ACCESS
Citation: Hui KH, Ooi CS, Lim MH, Leong MS,
Al-Obaidi SM (2017) An improved wrapper-based feature selection method for machinery fault diagnosis. PLoS ONE 12(12): e0189143.https:// doi.org/10.1371/journal.pone.0189143
Editor: Quan Zou, Tianjin University, CHINA
Received: June 4, 2017
Accepted: November 20, 2017
Published: December 20, 2017
Copyright:©2017 Hui et al. This is an open access article distributed under the terms of theCreative Commons Attribution License, which permits unrestricted use, distribution, and reproduction in any medium, provided the original author and source are credited.
Data Availability Statement: Data are available
from the Case Western Reserve University Bearing Data Centre website (http://csegroups.case.edu/ bearingdatacenter).
Funding: This work was supported by Higher
Institution Centre of Excellence (HICoE) Grant Scheme-R.K130000.7809.4J226-MSL; Higher Institution Centre of Excellence (HICoE) Grant Scheme-R.K130000.7843.4J227-MHL; and Higher Institution Centre of Excellence (HICoE) Grant Scheme-R.K130000.7843.4J228-MHL.
Competing interests: The authors have declared
selection is usually performed to identify the most representative feature subsets for the machine learning algorithm to achieve the greatest classification performance by eliminating the overfitting issue [7]. Feature selection is therefore a necessary task to select the most repre-sentative feature subsets for the machine learning algorithm.
The feature selection approach can generally be classified into three categories: the filter, wrapper, and embedded methods. Wrapper feature selection alternatives are usually combined with machine learning classifiers to develop a heuristic mechanism that aims to provide an optimal input for targeting optimization functions by considering the options available within a search space boundary. This is performed by the renowned genetic algorithm (GA) [8,9], particle swarm optimization (PSO) [10,11], the ensemble learning algorithm [12], extreme learning machines (ELM) [13], ant colony optimization (ACO) [14,15], the imperialist com-petitive algorithm (ICA) [16], and the harmony search (HS) algorithm [17,18], among others. This distinctive characteristic gives the wrapper method a much-needed robustness and accu-racy, especially with regard to massive, multidimensional data processing, which requires a highly sophisticated classification [19]. Nonetheless, it is obvious that the trade-off relationship between capability in selecting the best feature subset and computational effort is inevitable in the wrapper-based feature selection (WFS) method [20–24]. For instance, the GA involves the iterative identification of a probable solution based on genetic evolution theory. The evaluation resource increases exponentially with regard to the population size and offspring selection strategy. Six extracted features present 63 feature combinations evaluation, while 12 extracted features present 4095 feature combinations for evaluation.Table 1displays the number of fea-ture combinations for the number of extracted feafea-tures. It is clear that it would be very compu-tationally demanding for a feature evaluation to be carried out for all feature combinations. Hence, a simplified classification model is beneficial for post-processing system identification, cost-savings and minimizing uncertainty.
Various feature selection crossover combinations such as the hybrid filter-wrapper method have been implemented, with a twofold aim: To refine the feature selection performance and reduce the disadvantages introduced by individual techniques [25–27]. Nonetheless, the pat-tern recognition classifier design for real-world cases typically resembles a black box study scheme; it is rather tedious to justify a satisfactory equilibrium among multiple influencing fac-tors withouta prioriknowledge [28]. In addition, overemphasis on either dimension (perfor-mance effectiveness or modelling simplification), setting simple algorithm assumptions and overlooking the influence of interrelationships between variables [29] likely jeopardizes the fulfilment of the machine learning objective. As a result, in addition to performing feature selection, a tendency to avoid overdesign in simulation together with sluggishness and prema-ture local optima convergence are equally crucial.
This paper proposes an improved WFS method that aims to select the fittest feature subset with minimum computational resources via selecting potential candidates only through unique feature combinations. This provides the advantage of avoiding the unnecessary consid-eration of repetitive feature combinations and previously eliminated candidates. In this
Table 1. Number of combinations based on the number of features extracted.
Number of features Number of combinations
3 7
6 63
12 4,095
24 16,777,215
48 281,474,976,710,655
section, the necessities of the feature selection in automated machinery fault diagnosis and the limitations and drawbacks of the WFS method have been discussed in detail. The methodology for the bearing data collection, from the feature extraction to the proposed selection strategy, is described in the following section. The performance of the proposed WFS method is dis-cussed based on the k-fold cross-validated classifier performance and compared to the recently published Max-Relevance-Max-Distance (MRMD) technique.
Materials and methods
The following part of this paper describes the methodology of the bearing data collection, the feature extraction and the proposed WFS strategy in greater detail.
Data collection
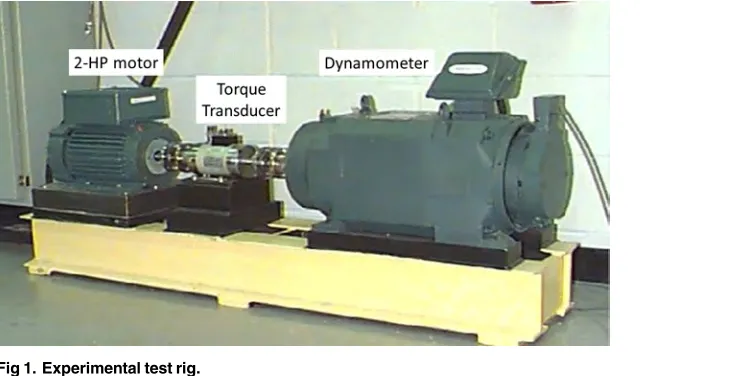
The bearing conditions dataset used in this study was downloaded from the Case Western Reserve University Bearing Data Centre website with the intention of specifically representing ball bearings in healthy and faulty conditions (rolling element, inner raceway and outer race-way faults). The test rig consisted of a 2-horse power (HP) motor, a torque transducer and a dynamometer. The arrangement of the test rig was used to simulate different bearing condi-tions (Fig 1). The motor operated at approximately 1750 rpm with a 1-HP load. Vibration data were collected at a sampling rate of 12 kHz by accelerometers that were attached to the bearing housing.
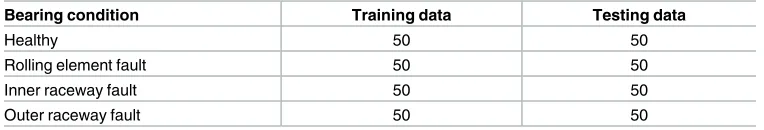
A total of 400 sets of time series vibrations were extracted from the raw continuous tion signal collected from a 7-mil fault diameter with a 1-HP load. Then, the 400 sets of vibra-tion data were divided into two sets of data, one of which was used to establish the relavibra-tionship between the input and output of the machine learning model (training phase), while the other set was used to validate the trained machine learning model (testing phase). The distribution of the vibration dataset employed in this study is tabulated inTable 2.
Feature extraction
In this section, the time series vibration data from Section 3 is subjected to statistical analyses. The features obtained, namely, the skewness factor, kurtosis factor, crest factor, shape factor, impulse factor and margin factor, were converted from the corresponding equations in
Fig 1. Experimental test rig.
Table 3. The statistical features were subsequently used as features (inputs) for SVM model training and testing purposes. Each statistical feature presented has unique characteristics and reveals informative data regarding system status.
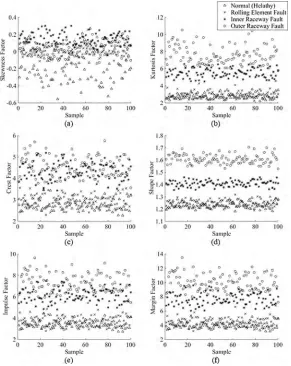
Fig 2shows the data distribution of the skewness factor, kurtosis factor, crest factor, shape factor, impulse factor and margin factor, respectively, for the vibration signals collected from a 7-mil fault diameter with a 1-HP motor load. The dataset was attached asS1 Data File.
Since there was a total of 100 samples for each bearing condition, 50% of the samples were randomly selected as training data to synthesize the machine learning model, while the remaining 50% of the samples were used to validate the trained machine learning model.
The proposed wrapper-based feature selection method
In this study, an improved WFS method was proposed for performing the feature selection task. The proposed WFS method employed the SVM as a classifier in feature selection. The performance of each feature was based on SVM classifier training accuracy after multi-fold cross-validation appraisal [30] in pursuance of model consistency, by minimizing bias and overfitting. The proposed WFS reduced execution time by avoiding repeated computations of identical and undesirable feature combinations. Thus, for every iteration, the proposed WFS method only evaluated unique combinations of features via two approaches. It is observed by ignoring the repetitive assessment of identical feature combinations that occur during the random generation process of feature combinations and undesirable low quality solutions from past recursive simulation. In addition, the proposed WFS method generated next-level feature combinations based on the performance of the previous level.Fig 3 illus-trates the methodology of the proposed WFS algorithm. In first-level selection, the algorithm
Table 2. Vibration data distribution.
Bearing condition Training data Testing data
Healthy 50 50
Rolling element fault 50 50
Inner raceway fault 50 50
Outer raceway fault 50 50
https://doi.org/10.1371/journal.pone.0189143.t002
Table 3. Statistical features.
No. Statistical Feature Equation
A Skewness factor 1
N
PN n¼1ðxðnÞxÞ
3
ffiffiffiffiffiffiffiffiffiffiffiffiffiffiffiffiffiffiffiffiffiffiffiffiffiffi
1
N
PN n¼1ðxðnÞxÞ
2
q
3
B Kurtosis factor 1
N
PN n¼1ðxðnÞxÞ
4
ffiffiffiffiffiffiffiffiffiffiffiffiffiffiffiffiffiffiffiffiffiffiffiffiffiffi
1
N
PN n¼1ðxðnÞxÞ
2
q
4
C Crest factor ffiffiffiffiffiffiffiffiffiffiffiffiffiffiffiffiffiffiffiffimaxjxðnÞj
1
N
PN
n¼1xðnÞ2
q
D Shape factor ffiffiffiffiffiffiffiffiffiffiffiffiffiffiffiffiffiffiffiffi1 N
PN n¼1xðnÞ
2
q
1
N
PN n¼1jxðnÞj
E Impulse factor maxjxðnÞj
1
N
PN n¼1jxðnÞj
F Margin factor maxjxðnÞj
1
N
PN n¼1
ffiffiffiffiffiffiffi
jxðnÞj p
2
evaluated each individual feature. Then, the algorithm generated the second-level feature com-binations by combining unselected individual features with the features that performed at an above-average level (red-outlined rectangle inFig 3). This process terminated when the feature combination had fully utilized all the features extracted. Finally, the algorithm selected the fea-ture combinations with the least number of feafea-tures from the highest training accuracy (yel-low-filled rectangle inFig 3) as the most representative features of the entire dataset. In addition to selecting the most representative features of the dataset, the feature selection also reduced the feature dimensionality for machine learning algorithms. As a result, the skewness factor and shape factor (i.e., features A and D) were selected in this example.
Results and discussion
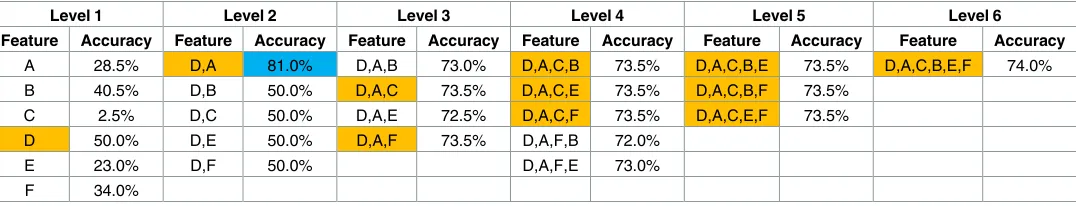
Table 4shows the training accuracy of the key combinations of features at each level. The yel-low-shaded feature combinations are those with the best training accuracy at each level, and the blue-shaded training accuracy cell designates the best training accuracy in the table. As a result, features A and D (skewness and shape factor) were selected to represent the entire bear-ing conditions dataset. The trainbear-ing accuracy inTable 4indicates that entering all the extracted
Fig 2. (a) Skewness factor, (b) kurtosis factor, (c) crest factor, (d) shape factor, (e) impulse factor and (f)
margin factor of all bearing conditions.
features into the machine learning algorithm does not guarantee the highest classification accuracy, as the training accuracy for the selected features (i.e., features A and D) was 81%, and the training accuracy for all the features extracted was 74%. In contrast, the testing accu-racy of the bearing faults dataset was 83% for the selected features and 76% for all the features extracted. A representative feature combination for the entire dataset was therefore selected using the proposed WFS algorithm.
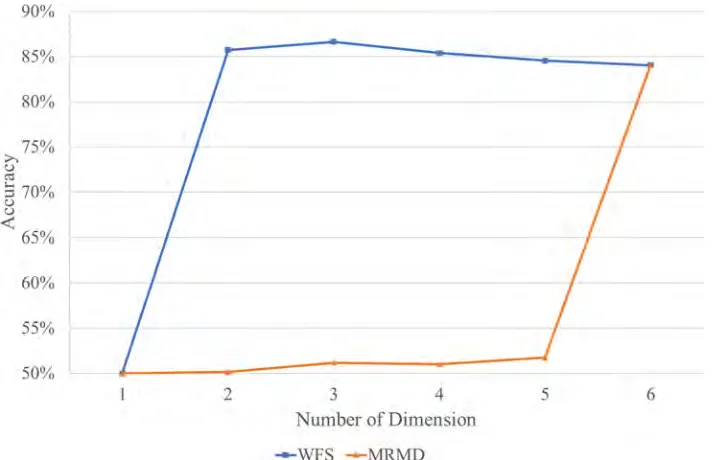
Further investigation has been conducted using a recently published feature selection tech-nique in order to validate the proposed WFS method. The MRMD techtech-nique was selected after it demonstrated a good balance between classifier accuracy and stability when subjected to an image processing dataset [31,32]. Its superiority was compared to alternatives such as minimal-redundancy-maximal-relevance (mRMR) [33] and Information Gain. Tables5and6 tabulate the cyclical assessment of the proposed WFS and MRMD. The testing accuracy was obtained through 10-fold cross-validation to represent a more reliable testing result.Fig 4 dis-plays the comparison of the testing accuracy for feature subsets selected by the proposed WFS and MRMD in different dimensions. The proposed WFS became saturated after selecting the second features. Compared to the MRMD, the training accuracy of the WFS is higher until the sixth feature is selected. It is important to acknowledge that the WFS method obtained the optimal feature subset more quickly than the MRMD; however, the latter provides a better
Fig 3. The proposed feature selection algorithm (features A, B, C, D, E and F represent skewness factor,
kurtosis factor, crest factor, shape factor, impulse factor and margin factor, respectively).
https://doi.org/10.1371/journal.pone.0189143.g003
Table 4. Training accuracy for the key combination of features (features A, B, C, D, E and F represent skewness factor, kurtosis factor, crest factor, shape factor, impulse factor and margin factor, respectively).
Level 1 Level 2 Level 3 Level 4 Level 5 Level 6
Feature Accuracy Feature Accuracy Feature Accuracy Feature Accuracy Feature Accuracy Feature Accuracy
A 28.5% D,A 81.0% D,A,B 73.0% D,A,C,B 73.5% D,A,C,B,E 73.5% D,A,C,B,E,F 74.0%
B 40.5% D,B 50.0% D,A,C 73.5% D,A,C,E 73.5% D,A,C,B,F 73.5%
C 2.5% D,C 50.0% D,A,E 72.5% D,A,C,F 73.5% D,A,C,E,F 73.5%
D 50.0% D,E 50.0% D,A,F 73.5% D,A,F,B 72.0%
E 23.0% D,F 50.0% D,A,F,E 73.0%
F 34.0%
consistency in term of classifier outcome when selecting the feature and is more significant when enormous feature subsets are available. This is probably because, initially, the WFS tar-geted a machinery faults application that supplies limited features while the MRMD aims for an image processing practice.
Conclusion
The aim of this study was to improve the capability of the WFS method for selecting the best feature subset with a reduced computational effort. The analysis of the results revealed that the proposed WFS is capable of selecting the most representative feature subset for the bearing dataset. In addition, this study also confirmed that entering all the extracted features into the machine learning algorithm does not guarantee the best classification performance. Thus, fea-ture selection plays a vital role in ensuring the optimum performance of a classifier. The pro-posed WFS method also reduces the number of feature combinations needing to be evaluated by avoiding the re-evaluation of identical feature combinations. This reduced the computa-tional effort required by two thirds. In sum, the main advantage of the novel, state-of-the-art
Table 5. Cyclical assessment for the proposed WFS by 10-fold cross-validation.
Cycle Number of Feature Dimension
1 2 3 4 5 6
1 0.500 0.850 0.880 0.815 0.845 0.850
2 0.500 0.870 0.880 0.835 0.880 0.860
3 0.500 0.840 0.870 0.875 0.875 0.865
4 0.500 0.825 0.845 0.860 0.805 0.805
5 0.500 0.885 0.900 0.865 0.745 0.850
6 0.500 0.845 0.845 0.845 0.860 0.845
7 0.500 0.860 0.840 0.885 0.870 0.870
8 0.500 0.860 0.865 0.875 0.860 0.825
9 0.500 0.880 0.860 0.820 0.850 0.835
10 0.500 0.860 0.880 0.865 0.865 0.800
Mean 0.500 0.858 0.867 0.854 0.846 0.841
±SD ±0 ±0.018 ±0.019 ±0.024 ±0.041 ±0.024
https://doi.org/10.1371/journal.pone.0189143.t005
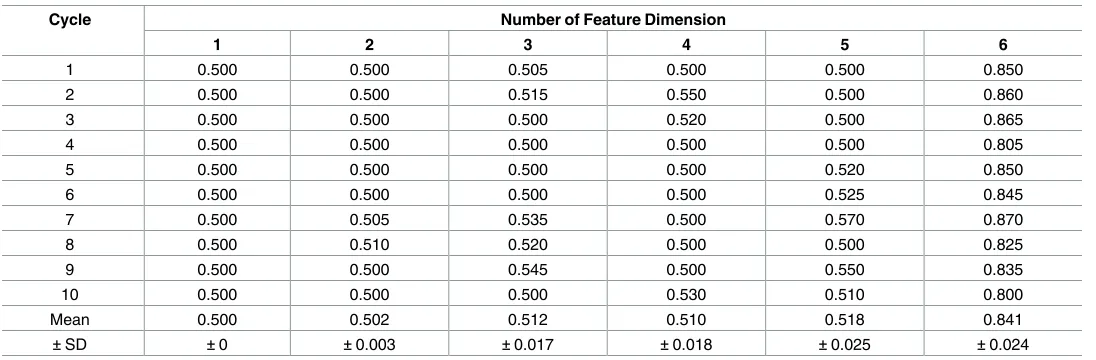
Table 6. Cyclical assessment for the MRMD by 10-fold cross-validation.
Cycle Number of Feature Dimension
1 2 3 4 5 6
1 0.500 0.500 0.505 0.500 0.500 0.850
2 0.500 0.500 0.515 0.550 0.500 0.860
3 0.500 0.500 0.500 0.520 0.500 0.865
4 0.500 0.500 0.500 0.500 0.500 0.805
5 0.500 0.500 0.500 0.500 0.520 0.850
6 0.500 0.500 0.500 0.500 0.525 0.845
7 0.500 0.505 0.535 0.500 0.570 0.870
8 0.500 0.510 0.520 0.500 0.500 0.825
9 0.500 0.500 0.545 0.500 0.550 0.835
10 0.500 0.500 0.500 0.530 0.510 0.800
Mean 0.500 0.502 0.512 0.510 0.518 0.841
±SD ±0 ±0.003 ±0.017 ±0.018 ±0.025 ±0.024
WFS method introduced here is its ability to select the best feature subset using less computa-tional effort. This is essential when analysing a large number of inputs. This proposed WFS method should be embedded into machine learning algorithms in order to improve their per-formance. A further improvement of the proposed WFS method can focus on the selection of image related visual features.
Supporting information
S1 Data File. Dataset for features selection.
(MAT)
Acknowledgments
The authors would like to extend their deepest gratitude to the Institute of Noise and Vibration UTM for funding the study under the Higher Institution Centre of Excellence (HICoE) Grant Scheme (R.K130000.7809.4J226, R.K130000.7843.4J227 and R.K130000.7843.4J228).
Author Contributions
Conceptualization: Kar Hoou Hui, Ching Sheng Ooi.
Data curation: Kar Hoou Hui, Ching Sheng Ooi.
Formal analysis: Kar Hoou Hui, Ching Sheng Ooi.
Funding acquisition: Meng Hee Lim, Mohd Salman Leong.
Investigation: Kar Hoou Hui, Ching Sheng Ooi.
Methodology: Kar Hoou Hui, Ching Sheng Ooi.
Resources: Kar Hoou Hui, Meng Hee Lim.
Fig 4. Comparison of the testing accuracy (average of 10-fold cross-validation).
Software: Kar Hoou Hui, Ching Sheng Ooi, Meng Hee Lim.
Supervision: Meng Hee Lim, Mohd Salman Leong.
Validation: Kar Hoou Hui, Ching Sheng Ooi, Meng Hee Lim, Salah Mahdi Al-Obaidi.
Writing – original draft: Kar Hoou Hui, Ching Sheng Ooi.
Writing – review & editing: Meng Hee Lim, Mohd Salman Leong, Salah Mahdi Al-Obaidi.
References
1. Li Y, Yang Y, Li G, Xu M, Huang W. A fault diagnosis scheme for planetary gearboxes using modified multi-scale symbolic dynamic entropy and mRMR feature selection. Mech Syst Signal Process. 2017; 91: 295–312.https://doi.org/10.1016/j.ymssp.2016.12.040
2. Chen G, Chen J. A novel wrapper method for feature selection and its applications. Neurocomputing. 2015; 159: 219–226.https://doi.org/10.1016/j.neucom.2015.01.070
3. Zhu P, Xu Q, Hu Q, Zhang C, Zhao H. Multi-label Feature Selection with Missing Labels. Pattern Recog-nit. Elsevier Ltd; 2017; 74: 488–502.https://doi.org/10.1016/j.patcog.2017.09.036
4. Zhu P, Zhu W, Hu Q, Zhang C, Zuo W. Subspace clustering guided unsupervised feature selection. Pat-tern Recognit. Elsevier Ltd; 2017; 66: 364–374.https://doi.org/10.1016/j.patcog.2017.01.016
5. Zhu P, Hu Q, Zhang C, Zuo W. Coupled Dictionary Learning for Unsupervised Feature Selection. Proc 30th Conf Artif Intell (AAAI 2016). 2016; 2422–2428.
6. Zhao H, Zhu P, Wang P, Hu Q. Hierarchical feature selection with recursive regularization. IJCAI 2017. 2017; 3483–3489.
7. Liu C, Wang W, Zhao Q, Shen X, Konan M. A new feature selection method based on a validity index of feature subset. Pattern Recognit Lett. Elsevier B.V.; 2017; 92: 1–8.https://doi.org/10.1016/j.patrec. 2017.03.018
8. Soufan O, Kleftogiannis D, Kalnis P, Bajic VB. DWFS: A wrapper feature selection tool based on a par-allel Genetic Algorithm. PLoS One. 2015; 10.https://doi.org/10.1371/journal.pone.0117988PMID:
25719748
9. Ma B, Xia Y. A tribe competition-based genetic algorithm for feature selection in pattern classification. Appl Soft Comput. 2017; 58: 328–338.https://doi.org/10.1016/j.asoc.2017.04.042
10. Zhang Y, Wang S, Phillips P, Ji G. Binary PSO with mutation operator for feature selection using deci-sion tree applied to spam detection. Knowledge-Based Syst. Elsevier B.V.; 2014; 64: 22–31.https://doi. org/10.1016/j.knosys.2014.03.015
11. Tsai CY, Chen CJ. A PSO-AB classifier for solving sequence classification problems. Appl Soft Comput J. 2015; 27: 11–27.https://doi.org/10.1016/j.asoc.2014.10.029
12. Panthong R, Srivihok A. Wrapper Feature Subset Selection for Dimension Reduction Based on Ensem-ble Learning Algorithm. Procedia Comput Sci. 2015; 72: 162–169.https://doi.org/10.1016/j.procs.2015. 12.117
13. Chyzhyk D, Savio A, Graña M. Evolutionary ELM wrapper feature selection for Alzheimer’s disease CAD on anatomical brain MRI. Neurocomputing. 2014; 128: 73–80.https://doi.org/10.1016/j.neucom. 2013.01.065
14. Shekofteh H, Ramazani F, Shirani H. Optimal feature selection for predicting soil CEC: Comparing the hybrid of ant colony organization algorithm and adaptive network-based fuzzy system with multiple lin-ear regression. Geoderma. 2017; 298: 27–34.https://doi.org/10.1016/j.geoderma.2017.03.010
15. Erguzel TT, Tas C, Cebi M. A wrapper-based approach for feature selection and classification of major depressive disorder–bipolar disorders. Comput Biol Med. 2015; 64: 127–137.https://doi.org/10.1016/j. compbiomed.2015.06.021PMID:26164033
16. Barak S, Dahooie JH, Tichy´ T. Wrapper ANFIS-ICA method to do stock market timing and feature selection on the basis of Japanese Candlestick. Expert Syst Appl. 2015; 42: 9221–9235.https://doi.org/ 10.1016/j.eswa.2015.08.010
17. Das S, Singh PK, Bhowmik S, Sarkar R, Nasipuri M. A Harmony Search Based Wrapper Feature Selec-tion Method for Holistic Bangla Word RecogniSelec-tion. Procedia Comput Sci. 2016; 89: 395–403.https:// doi.org/10.1016/j.procs.2016.06.087
19. Guyon I, Elisseeff A, De AM. An Introduction to Variable and Feature Selection. J Mach Learn Res. 2003; 3: 1157–1182.https://doi.org/10.1016/j.aca.2011.07.027
20. Wang A, An N, Chen G, Li L, Alterovitz G. Knowledge-Based Systems Accelerating wrapper-based fea-ture selection with K -nearest-neighbor. Knowledge-Based Syst. 2015; 83: 81–91.https://doi.org/10. 1016/j.knosys.2015.03.009
21. Wang A, An N, Yang J, Chen G, Li L, Alterovitz G. Wrapper-based gene selection with Markov blanket. Comput Biol Med. 2017; 81: 11–23.https://doi.org/10.1016/j.compbiomed.2016.12.002PMID:
28006702
22. Li H, Li CJ, Wu XJ, Sun J. Statistics-based wrapper for feature selection: An implementation on financial distress identification with support vector machine. Appl Soft Comput J. 2014; 19: 57–67.https://doi. org/10.1016/j.asoc.2014.01.018
23. Ye Y-F, Shao Y-H, Deng N-Y, Li C-N, Hua X-Y. Robust Lp-norm least squares support vector regres-sion with feature selection. Appl Math Comput. 2017; 305: 32–52.https://doi.org/10.1016/j.amc.2017. 01.062
24. Bermejo P, Ga´mez JA, Puerta JM. Speeding up incremental wrapper feature subset selection with Naive Bayes classifier. Knowledge-Based Syst. Elsevier B.V.; 2014; 55: 140–147.https://doi.org/10. 1016/j.knosys.2013.10.016
25. Bermejo P, De La Ossa L, Ga´mez JA, Puerta JM. Fast wrapper feature subset selection in high-dimen-sional datasets by means of filter re-ranking. Knowledge-Based Syst. 2012; 25: 35–44.https://doi.org/ 10.1016/j.knosys.2011.01.015
26. Goswami S, Das AK, Chakrabarti A, Chakraborty B. A feature cluster taxonomy based feature selection technique. Expert Syst Appl. 2017; 79: 76–89.https://doi.org/10.1016/j.eswa.2009.05.055
27. Hu Z, Bao Y, Xiong T, Chiong R. Hybrid filter–wrapper feature selection for short-term load forecasting. Eng Appl Artif Intell. 2015; 40: 17–27.https://doi.org/10.1016/j.engappai.2014.12.014
28. Vignolo LD, Milone DH, Scharcanski J. Feature selection for face recognition based on multi-objective evolutionary wrappers. Expert Syst Appl. Elsevier Ltd; 2013; 40: 5077–5084.https://doi.org/10.1016/j. eswa.2013.03.032
29. Senawi A, Wei H-L, Billings SA. A new maximum relevance-minimum multicollinearity (MRmMC) method for feature selection and ranking. Pattern Recognit. Elsevier Ltd; 2017; 67: 47–61.https://doi. org/10.1016/j.patcog.2017.01.026
30. Hastie T, Tibshirani R, Friedman J. Model Assessment and Selection. In: The Elements of Statistical Learning. Springer Series in Statistics. Springer; 2009: 219–259. https://doi.org/10.1007/978-0-387-84858-7
31. Zou Q, Zeng J, Cao L, Ji R. A novel features ranking metric with application to scalable visual and bioin-formatics data classification. Neurocomputing. 2016; 173: 346–354.https://doi.org/10.1016/j.neucom. 2014.12.123
32. Zou Q, Wan S, Ju Y, Tang J, Zeng X. Pretata: predicting TATA binding proteins with novel features and dimensionality reduction strategy. BMC Syst Biol. BMC Systems Biology; 2016; 10: 401–412.https:// doi.org/10.1186/s12918-016-0353-5PMID:28155714