Learning Attack Strategies from Intrusion Alerts
∗Peng Ning and Dingbang Xu Cyber Defense Laboratory Department of Computer Science
North Carolina State University Raleigh, NC 29695-8207
Email: [email protected], [email protected]
Abstract
Understanding the strategies of attacks is crucial for security applications such as computer and network forensics, intrusion response, and prevention of future attacks. This paper presents techniques to automatically learn attack strategies from intrusion alerts. Central to these techniques is a model that represents an attack strategy as a graph of attacks with constraints on the attack attributes and the temporal order among these attacks. To learn the intrusion strategy is then to extract such a graph from a sequences of intrusion alerts. To further facilitate the analysis of attack strategies, which is essential to many security applications such as computer and network forensics and incident handling, this paper presents techniques to measure the similarity between attack strategies. The basic idea is to reduces the similarity measurement of attack strategies into error-tolerant graph isomorphism problem, and measures the similarity between attack strategies in terms of the cost to transform one strategy into another. Finally, this paper presents some experimental results, which demonstrate the potential of the aforementioned techniques.
1
Introduction
It has become a well-known problem that current intrusion detection systems (IDSs) produce large volumes of alerts, including both actual and false alerts. As the network performance improves and more network-based applications are being introduced, the IDSs are generating increasingly overwhelming alerts. This problem makes it extremely challenging to understand and manage the intrusion alerts, let alone respond to intrusions timely.
It is often desirable, and sometimes necessary, to understand attack strategies in security applications such as computer forensics and intrusion responses. For example, it is easier to predict an attacker’s next move, and decrease the damage caused by intrusions, if the attack strategy is known during intrusion re-sponse. However, in practice, it usually requires that human users analyze the intrusion data manually to understand the attack strategy. This process is not only time-consuming, but also error-prone. An alternative is to enumerate and reason about attack strategies through static vulnerability analysis (e.g., [1, 21, 35, 37]). However, these techniques usually require predefined security properties so that they can identify possible attack sequences that may lead to violation of these properties. Although it is easy to specify certain security
∗The authors would like to thank the anonymous reviewers for their valuable comments. This work is partially supported by the
properties such as compromise of root privilege, it is non-trivial to enumerate all possible ones. Moreover, analyzing strategies from intrusion alerts allows inspecting actual executions of attack strategies with differ-ent levels of details, providing additional information not available in static vulnerability analysis. Thus, it is desirable to have complementary techniques that can profile attack strategies from intrusion alerts.
In this paper, we present techniques to automatically learn attack strategies from intrusion alerts reported by IDSs. Our approach is based on the recent advances in intrusion alert correlation [11, 32]. By examining correlated intrusion alerts, our method extracts the constraints intrinsic to the attack strategy automatically. Specifically, an attack strategy is represented as a directed acyclic graph (DAG), which we call an attack
strategy graph, with nodes representing attacks, edges representing the (partial) temporal order of attacks,
and constraints on the nodes and edges. These constraints represent the conditions that any attack instance must satisfy in order to use the strategy. To cope with variations in attacks, we use generalization techniques to hide the differences not intrinsic to the attack strategy. By controlling the degree of generalization, users may inspect attack strategies at different levels of details.
To facilitate intrusion analysis in applications such as computer and network forensics, we further develop techniques to measure the similarity between sequences of intrusion alerts based on their attack strategies. Similarity measurement of alert sequences is a fundamental problem in many security applications such as profiling hackers or hacking tools, identification of undetected attacks, attack prediction, and so on. To achieve this goal, we harness the results on error tolerant graph/subgraph isomorphism detection in the pattern recognition field. By analyzing the semantics and constraints in similarity measurement of alert sequences, we transform this problem into error tolerant graph/subgraph isomorphism detection.
Our contribution in this paper is three-fold. First, we develop a model to represent attack strategies as well as algorithms to extract attack strategies from correlated alerts. Second, we develop techniques to measure the similarity between sequences of alerts on the basis of the attack strategy model. Third, we perform a number of experiments to validate the proposed techniques. Our experimental results show that our techniques can successfully extract invariant attack strategies from sequences of alerts, measure the similarity between alert sequences conforming to human intuition, and identify attacks possibly missed by IDSs.
The remainder of this paper is organized as follows. The next section presents a model to represent and extract attack strategies from a sequence of correlated intrusion alerts. Section 3 discusses the methods to measure the similarity between sequences of related alerts based on their strategies. Section 4 presents the experiments we perform to validate the proposed methods. Section 5 discusses the related work, and Section 6 concludes this paper. The appendices give details of proof, analysis, and experimental results.
2
Modeling Attack Strategies
In this section, we present a method to represent and automatically learn attack strategies from a sequence of related intrusion alerts. Our techniques are developed on the basis of our previous work on alert correlation [32], which we refer to as the correlation model in this paper. In the following, we first give a brief overview of the correlation model, and then discuss our new techniques.
2.1 An Overview of the Correlation Model
67343
67432
67434
67436
67440
67558
67559
67553
67776 67554
67773 67560
Sadmind_Amslverify_Overflow Sadmind_Ping
Rsh
Mstream_Zombie
Stream_DoS Attacking Host: 202.77.162.213 Victim Host: 172.16.112.50
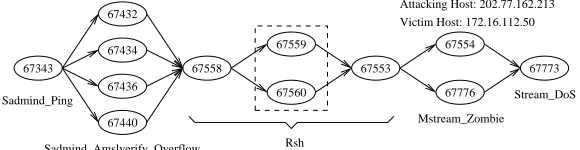
Figure 1: An example of hyper-alert correlation graph
intrusions. The prerequisite of an intrusion is the necessary condition for the intrusion to be successful. For example, the existence of a vulnerable ftp service is the prerequisite of a ftp buffer overflow attack against this service. The consequence of an intrusion is the possible outcome of the intrusion. For example, gaining local access as root from a remote machine may be the consequence of a ftp buffer overflow attack. This method then correlates two alerts if the consequence of the earlier alert prepares for the prerequisites of the later one.
The correlation method uses logical formulas, which are logical combinations of predicates, to represent the prerequisites and consequences of intrusions. For example, a scanning attack may discover UDP ser-vices vulnerable to certain buffer overflow attacks. Then the predicate UDPVulnerableToBOF (VictimIP,
VictimPort) may be used to represent this discovery.
The correlation model formally represents the prerequisites and consequences of known attacks as hyper-alert types. A hyper-hyper-alert type is a triple (fact, prerequisite, consequence), where fact is a set of hyper-alert attribute names, prerequisite is a logical formula whose free variables are all in fact, and consequence is a set of logical formulas such that all the free variables in consequence are in fact. Intuitively, a hyper-alert type encodes the knowledge about the corresponding attacks. Given a hyper-alert type T = (fact, prerequisite,
consequence), a type T hyper-alert h is a finite set of tuples on fact, where each tuple is associated with an
interval-based timestamp [begin time, end time]. The hyper-alerthimplies that prerequisite must evaluate
to True and all the logical formulas in consequence might evaluate to True for each of the tuples.
The correlation process is to identify the prepare-for relations between hyper-alerts. Intuitively, it is to check if an earlier hyper-alert contributes to the prerequisite of a later one. In the formal model, this is performed through the notions of prerequisite and consequence sets. Consider a hyper-alert type T =
(fact, prerequisite, consequence). The prerequisite set (or consequence set) ofT, denotedP rereq(T)(or
Conseq(T)), is the set of all predicates that appear in prerequisite (or consequence). Moreover, the
ex-panded consequence set of T, denoted ExpConseq(T), is the set of all predicates that are implied by
Conseq(T). Thus, Conseq(T) ⊆ ExpConseq(T). This is computed using the implication relationships
between predicates [32]. Given a typeT hyper-alert h, the prerequisite set, consequence set, and expanded
consequence set ofh, denoted P rereq(h), Conseq(h), andExpConseq(h)), respectively, are the
predi-cates inP rereq(T),Conseq(T), andExpConseq(T)whose arguments are replaced with the
correspond-ing attribute values of each tuple inh. Each element inP rereq(h),Conseq(h), orExpConseq(h)is
asso-ciated with the timestamp of the corresponding tuple inh. Then hyper-alerth1 prepares for hyper-alerth2
if there existp∈P rereq(h2)andc∈ExpConseq(h1)such thatp=candc.end time < p.begin time.
We use a hyper-alert correlation graph to represent a set of correlated alerts. A hyper-alert correlation
graphCG= (N,E) is a connected directed acyclic graph (DAG), whereN is a set of hyper-alerts, and for
each pairn1, n2 ∈N, there is a directed edge from n1ton2 inEif and only ifn1 prepares forn2. Figure
Limitations of the correlation model. The correlation model can be used to construct attack scenarios
(represented as hyper-alert correlation graphs) from intrusion alerts. Although such attack scenarios reflect attack strategies, they do not capture the essence of the strategies. Indeed, even with the same attack strategy, if an attacker changes certain details during attacks, the correlation model will generate different hyper-alert correlation graphs. For example, an attacker may repeat (unnecessarily) one step in a sequence of attacks many times, and the correlation model will generate a much more complex attack scenario. As another example, if an attacker uses equivalent, but different attacks, the correlation model will generate different hyper-alert correlation graphs as well. It is then up to the user to figure out manually the common strategy used in two sequences of attacks. This certainly increases the overhead in intrusion alert analysis.
2.2 Attack Strategy Graph
In the following, we present a model to represent and automatically extract attack strategies from correlated alerts. The goal of this model is to capture the invariants in attack strategies that do not change across multiple instances of attacks.
The strategy behind a sequence of attacks is indeed about how to arrange earlier attacks to prepare for the later ones so that the attacker can reach his/her final goal. Thus, the prepare for relations between the intrusion alerts (i.e., detected attacks) is intrinsic to attack strategies. However, in the correlation model, the prepare for relations are between specific intrusion alerts; they do not directly capture the conditions that have to be met by related attacks. To facilitate the representation of the invariant attack strategy, we transform the prepare for relation into some common conditions that have to be satisfied by all possible instances of the same strategy. In the following, we formally represent such a conditions as an equality
constraint.
Definition 1 Given a pair of hyper-alert types(T1, T2), an equality constraint for(T1, T2)is a conjunction
of equalities in the form of u1 = v1 ∧ · · · ∧un = vn, where u1,· · ·, un are attribute names in T1 and
v1,· · ·, vn are attribute names in T2, such that there exist p(u1,· · ·, un)and p(v1,· · ·, vn), which are the
same predicate with possibly different arguments, inExpConseq(T1)andP rereq(T2), respectively. Given
a typeT1 hyper-alerth1and a typeT2hyper-alert h2,h1andh2 satisfy the equality constraint if there exist
t1 ∈h1 andt2 ∈h2such thatt1.u1=t2.v1∧ · · · ∧t1.un=t2.vnevaluates to True.
There may be several equality constraints for a pair of hyper-alert types. However, if a typeT1hyper-alert
h1 prepares for a typeT2hyper-alert h2, thenh1andh2must satisfy at least one of the equality constraints.
Indeed,h1 preparing forh2 is equivalent to the conjunction ofh1 andh2 satisfying at least one equivalent
constraint andh1 occurring beforeh2. Assume thath1 occurs beforeh2. Ifh1 and h2 satisfy an equality
constraint for (T1, T2), then by Definition 1, there must be a predicate p(u1,· · ·, un)inExpConseq(T1)
such that the same predicate with possibly different arguments, p(v1,· · ·, vn), is inP rereq(T2). Sinceh1
andh2satisfy the equality constraint,p(u1,· · ·, un)andp(v1,· · ·, vn)will be instantiated to the same
predi-cate inExpConseq(h1)andP rereq(h2). This implies thath1prepares forh2. Similarly, ifh1prepares for
h2, there must be an instantiated predicate that appears inExpConseq(h1)andP rereq(h2). This implies
that there must be a predicate with possibly different arguments inExpConseq(T1)and P rereq(T2)and
that this predicate leads to an equality constraint for(T1, T2)satisfied byh1andh2.
Example 1 Let us use an example from [32] to illustrate the notion of equality constraint. Consider the
fol-lowing hyper-alert types: SadmindPing = ({VictimIP, VictimPort}, ExistsHost(VictimIP),{VulnerableSadmind
(VictimIP)}), and SadmindBufferOverflow = ({VictimIP, VictimPort}, ExistHost (VictimIP) ∧
! ! %
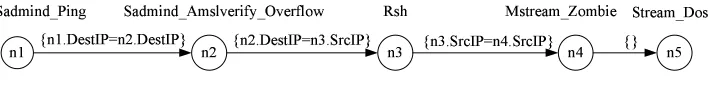
Figure 2: An example of attack strategy graph
is a type of attacks that requires the existence of a host at the VictimIP to succeed, and as a result, the attacker may find out that this host has a vulnerable Sadmind service. The second hyper-alert type indi-cates that this type of attacks requires a vulnerable Sadmind service at the VictimIP, and as a result, the
attack may gain root access. It is easy to see that there is a common predicate V ulnerableSadmindin
bothP rereq(SadmindBuf f erOverf low)andExpConseq(SadmindP ing). Thus, we have an equality
constraintV ictimIP = V ictimIP for (SadmindPing, SadmindBufferOverflow), where the first VictimIP
comes from SadmindPing, and the second VictimIP comes from SadmindBufferOverflow.
We observe in many occasions that one step in a sequence of attacks may trigger multiple intrusion alerts, and the number of alerts may vary in different situations. This is partially due to the existing vulnerabilities
and the hacking tools. For example, unicode shell [33], which is a hacking tool against Microsoft
IIS web server, checks about 20 vulnerabilities at the scanning stage and usually triggers the same number of alerts. As another example, in the attack scenario reported in [32], the attacker tried 3 different stack pointers and 2 commands in Sadmind Amslverify Overflow attacks for each victim host until one attempt succeeded. Even if not necessary, an attacker may still deliberately repeat the same step multiple times to confuse IDSs and/or system administrators. However, such variations do not change the corresponding attack strategy. Indeed, these variations make the attack scenarios unnecessarily complex, and may hinder manual or automatic analysis of the attack strategy. Thus, we decide to disallow such situations in our representation of attack strategies.
In the following, an attack strategy is formally represented as an attack strategy graph.
Definition 2 Given a setSof hyper-alert types, an attack strategy graph overSis a quadruple(N, E, T, C),
where (1)(N, E)is a connected DAG (directed acyclic graph); (2)Tis a mapping that maps eachn∈N to
a hyper-alert type inS; (3)Cis a mapping that maps each edge(n1, n2)∈Eto a set of equality constraints
for(T(n1), T(n2)); (4) For anyn1, n2 ∈ N,T(n1) = T(n2)implies that there exists n3 ∈ N such that
T(n3)6=T(n1)andn3is in a path betweenn1 andn2.
In an attack strategy graph, each node represents a step in a sequence of related attacks. Each edge
(n1, n2)represents that a typeT(n1)attack is needed to prepare for a successful type T(n2)attack. Each
edge may also be associated with a set of equality constraints satisfied by the intrusion alerts. These equality constraints indicate how one attack prepares for another. Finally, as represented by condition 4 in Definition 2, same type of attacks should be considered as one step, unless they depend on each other through other types of attacks.
Now let us see an example of an attack strategy graph.
Example 2 Figure 2 is the attack strategy graph extracted from the hyper-alert correlation graph in Figure
2.2.1 Learning Attack Strategies from Correlated Intrusion Alerts
As discussed earlier, our goal is to learn attack strategies automatically from correlated intrusion alerts. This requires that we extract the constraints intrinsic to attack strategy from alerts so that the same constraints apply to all the other instances of the same strategy.
Our strategy to achieve this goal is to process the correlated intrusion alerts in two steps. First, we aggregate intrusion alerts that belong to the same step of a sequence of attacks into one hyper-alert. For example, in Figure 1, alerts 67432, 67434, 67436, and 67440 are indeed attempts of the same attack with different parameters, and thus they should be aggregated as one step in the attack sequence. Second, we extract the constraints between the attack steps and represent them as an attack strategy graph. For example, after we aggregate the hyper-alerts in the first step, we may extract the attack strategy graph shown in Figure 2.
The challenge lies in the first step. Because of the variations of attacks as well as the signatures that IDSs use to recognize attacks, there is no clear way to identify intrusion alerts that belong to the same step in a sequence of attacks. In the following, we first attempt to use the attack type information to do so. The notion of aggregatable hyper-alerts is introduced formally to clarify when the same type of hyper-alerts can be aggregated.
Definition 3 Given a hyper-alert correlation graphCG= (N, E), a subsetN′ ⊆N is aggregatable, if (1)
all nodes inN′are the same type of hyper-alerts, and (2)∀n1, n2 ∈N′, if there is a path fromn1ton2, then
all nodes in this path must be inN′.
Intuitively, in a hyper-alert correlation graph, where intrusion alerts have been correlated together, the same type of hyper-alerts can be aggregated as long as they are not used in different stages in the attack sequence. Condition 1 in Definition 3 is quite straightforward, but condition 2 deserves more explanation.
Consider the same type of hyper-alerts h1 and h2. Ifh1 prepares for a different type of hyper-alert h′
(directly or indirectly), andh′ further prepares forh2(directly or indirectly), h1andh2obviously belong to
different steps in the same sequence of attacks. Thus, we shouldn’t allow them to be aggregated together. Although we have never observed such situations, we cannot rule out such possibilities.
Based on the notion of aggregatable alerts, the first step in learning attack strategy from a alert correlation graph is quite straightforward. We only need to identify and merge all aggregatable hyper-alerts. To proceed to the second step in strategy learning, we need a hyper-alert correlation graph in which each hyper-alert represents a separate step in the attack sequence. Formally, we call such a hyper-alert correlation graph an irreducible hyper-alert correlation graph.
Definition 4 A hyper-alert correlation graph CG= (N, E)is irreducible if for allN′ ⊆N, where|N′|>
1,N′ is not aggregatable.
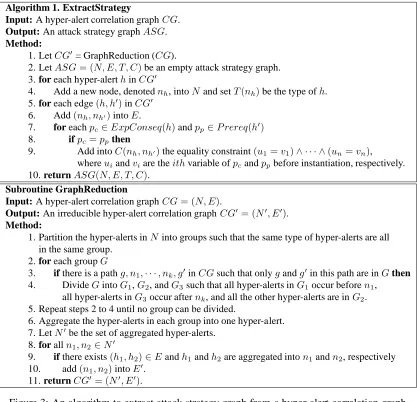
Figure 3 shows the algorithm to extract attack strategy graphs from hyper-alert correlation graphs. The subroutine GraphReduction is used to generate an irreducible hyper-alert correlation graph, and the rest of the algorithm extracts the components of the output attack strategy graph. The steps in this algorithm are self-explanatory; we do not repeat them in the text. Lemma 1 ensures that the output of algorithm 1 indeed satisfies the constraints of an attack strategy graph.
Lemma 1 The output of Algorithm 1 is an attack strategy graph.
PROOF. We first prove the output of the subroutine GraphReduction is an irreducible hyper-alert
Algorithm 1. ExtractStrategy
Input: A hyper-alert correlation graphCG. Output: An attack strategy graphASG. Method:
1. LetCG′= GraphReduction (CG).
2. LetASG= (N, E, T, C)be an empty attack strategy graph. 3. for each hyper-alerthinCG′
4. Add a new node, denotednh, intoN and setT(nh)be the type ofh.
5. for each edge(h, h′)inCG′
6. Add(nh, nh′)intoE.
7. for eachpc∈ExpConseq(h)andpp∈P rereq(h′)
8. ifpc=ppthen
9. Add intoC(nh, nh′)the equality constraint(u1=v1)∧ · · · ∧(un=vn),
whereuiandviare theithvariable ofpcandppbefore instantiation, respectively.
10. returnASG(N, E, T, C). Subroutine GraphReduction
Input: A hyper-alert correlation graphCG= (N, E).
Output: An irreducible hyper-alert correlation graphCG′ = (N′, E′).
Method:
1. Partition the hyper-alerts inN into groups such that the same type of hyper-alerts are all in the same group.
2. for each groupG
3. if there is a pathg, n1,· · ·, nk, g′inCGsuch that onlygandg′in this path are inGthen
4. DivideGintoG1,G2, andG3such that all hyper-alerts inG1occur beforen1,
all hyper-alerts inG3occur afternk, and all the other hyper-alerts are inG2.
5. Repeat steps 2 to 4 until no group can be divided.
6. Aggregate the hyper-alerts in each group into one hyper-alert. 7. LetN′be the set of aggregated hyper-alerts.
8. for alln1, n2∈N′
9. if there exists(h1, h2)∈Eandh1andh2are aggregated inton1andn2, respectively
10. add(n1, n2)intoE′.
11. returnCG′= (N′, E′).
Figure 3: An algorithm to extract attack strategy graph from a hyper-alert correlation graph
existsNs ⊆N′, where|Ns|>1, such thatNsis aggregatable. Thus, all nodes inNsare the same type of
hyper-alerts, and for any two different nodes n1, n2 ∈ Ns, if there is a path fromn1 ton2, then all nodes
in the path are inNs. SinceCG′ is aggregated from the input hyper-alert correlation graph, for all pairs of
nodesn′1 andn′2, wheren1′ and n′2 are aggregated into n1 andn2, respectively, if there exists a path from
n′1 ton′2 in the input graph, all the nodes in the path must be in the group of nodes aggregated into the
nodes inNs. According to steps 3 and 4 in GraphReduction, they should have been kept in the same group
and aggregated into one node in CG′. This leads to a contradiction to the assumption that n′1 and n′2 are
aggregated inton1andn2, respectively.
Now we prove the output of Algorithm 1 is an attack strategy graph. Consider the output of Algorithm 1ASG= (N, E, T, C). It is easy to see thatT is a mapping that maps eachn∈ N to a hyper-alert type,
and C is a mapping that maps each edgee ∈ E to a set of equality constraints. In addition, because the
input hyper-alert correlation graph is a DAG, (N, E) must be a directed graph. Suppose there is a cycle
n1, n2,· · ·, n1 in(N, E). There must exist two nodesn11,n12, andn21in the input hyper-alert correlation
graph such that n11 and n12 are aggregated into n1, n21 is aggregated into n2, and there exists a path
been put into two separate groups. Thus,(N, E)cannot have any cycle. Finally, for anyn1, n2 ∈N, since
the output of GraphReduction is irreducible, if T(n1) = T(n2), then there must existn3 ∈ N in a path
betweenn1andn2such thatT(n3)6=T(n1). 2
2.3 Dealing with Variations of Attacks
Algorithm 1 in Figure 3 has ignored equivalent but different attacks in sequences of attacks. For example, an attacker may use either pmap dump or Sadmind Ping to find a vulnerable Sadmind service. As another example, an attacker may use either SadmindBufferOverflow or TooltalkBufferOverflow attack gain remote access to a host. Obviously, at the same stage of two sequences of attacks, if an attacker uses equivalent but different attacks, Algorithm 1 will return two different attack strategy graphs, though the strategies behind them are the same.
We propose to generalize hyper-alert types so that the syntactic difference between equivalent hyper-alert types is hidden. For example, we may generalize both SadmindBufferOverflow and TooltalkBufferOverflow attacks into RPCBufferOverflow.
A generalized hyper-alert type is created to hide the unnecessary difference between specific hyper-alert types. Thus, an occurrence of any of the specific hyper-alerts should imply an occurrence of the generalized one. This is to say that satisfaction of the prerequisite of a specific hyper-alert implies the satisfaction of the prerequisite of the generalized hyper-alert. Moreover, to cover all possible impact of all the specific hyper-alerts, the consequences of all the specific hyper-alert types should be included in the consequence of the generalized hyper-alert type. It is easy to see that this generalization may cause loss of information. Thus, generalization of hyper-alert types must be carefully handled so that information essential to attack strategy is not lost.
In the following, we formally clarify the relationship between specific and generalized hyper-alert types.
Definition 5 Given two hyper-alert types Tg and Ts, where Tg = (f actg, prereqg, conseqg) and Ts = (f acts, prereqs, conseqs), we sayTgis more general thanTs(or, equivalently,Tsis more specific thanTg)
if there exists an injective mappingf fromf actgtof actssuch that the following conditions are satisfied:
• If we replace all variablesxinprereqgwithf(x),prereqsimpliesprereqg, and
• If we replace all variables x in conseqg with f(x), then all formulas in conseqs are implied by
conseqg.
The mappingf is called the generalization mapping fromTstoTg.
Example 3 Suppose the hyper-alert types SadmindBufferOverflow and TooltalkBufferOverflow are
spec-ified as follows: SadmindBufferOverflow = ({VictimIP, VictimPort}, ExistHost (VictimIP) ∧
Vulnerable-Sadmind (VictimIP),{GainRootAccess (VictimIP)}), and TooltalkBufferOverflow = ({VictimIP, VictimPort},
ExistHost (VictimIP)∧VulnerableTooltalk (VictimIP),{GainRootAccess (VictimIP)}). Assume that
Vulner-ableSadmind (VictimIP) imply VulnerableRPC (VictimIP). Intuitively, this represents that if there is a
vulner-able Sadmind service at VictimIP, then there must be a vulnervulner-able RPC service (i.e., the Sadmind service) at VictimIP. Similarly, we assume VulnerableTooltalk (VictimIP) also implies VulnerableRPC (VictimIP). Then we can generalize both SadmindBufferOverflow and TooltalkBufferOverflow into RPCBufferOverflow = ({VictimIP}, ExistHost (VictimIP) ∧VulnerableRPC (VictimIP),{GainRootAccess (VictimIP)}), where
By identifying a generalization mapping, we can specify how a specific hyper-alert can be generalized into a more general hyper-alert. Following the generalization mapping, we can find out what attribute values of a specific hyper-alert should be assigned to the attributes of the generalized hyper-alert. The attack strategy learning algorithm can be easily modified: We first generalize the alerts in the input hyper-alert correlation graph into generalized hyper-hyper-alerts following the generalization mapping, and then apply Algorithm 1 to extract the attack strategy graph.
Although a hyper-alert can be generalized in different granularities, it is not an arbitrary process. In particular, if one alert prepares for another alert before generalization, the generalized hyper-alerts should maintain the same relationship. Otherwise, the dependency between different attack stages, which is intrinsic in an attack strategy, will be lost.
The remaining challenge is how to get the “right” generalized hyper-alert types and generalization map-pings. The simplest way is to manually specify them. For example, Apache2, Back, and Crashiis are all Denial of Service attacks. We may simply generalize all of them into one WebServiceDOS. However, there are often different ways to generalize. To continue the above example, Apache2 and Back attacks are against the apache web servers, while Crashiis is against the Microsoft IIS web server. To keep more information about the attacks, we may want to generalize Apache and Back into ApacheDOS, while generalize Crashiis and possibly other DOS attacks against the IIS web server into IISDOS. Nevertheless, this doesn’t affect the attack strategy graphs extracted from correlated intrusion alerts as long as the constraints on the related alerts are satisfied.
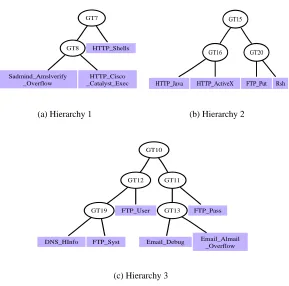
Automatic Generalization of Hyper-Alert Types It is time-consuming and error-prone to manually
gener-alize hyper-alert types. One way to partially automate this process is to use clustering techniques to identify the hyper-alert types that should be generalized into a common one. In our experiments, we use the bottom-up hierarchical clustering [20] to grobottom-up hyper-alert types hierarchically on the basis of the similarity between them, which is derived from the similarity between the prerequisites and consequences of hyper-alert types. The method used to compute the similarity is described below.
To facilitate the computation of similarity between prerequisites of hyper-alert types, we convert each prerequisite into an expanded prerequisite set, which includes all the predicates that appear or are implied by the prerequisite. Similarly, we can get the expanded consequence set. Consider two sets of predicates,
denotedS1 andS2, respectively. We adopt the Jaccard similarity coefficient [19] to compute the similarity
between S1 and S2, denoted Sim(S1, S2). That is, Sim(S1, S2) = a+ab+c, where a is the number of
predicates in both S1 and S2,b is the number of predicates only in S1, andcis the number of predicates
only inS2.
Given two hyper-alert typesT1 andT2, the similarity betweenT1and T2, denoted Sim(T1, T2), is then
computed asSim(T1, T2) =Sim(XP1, XP2)×wp+Sim(XC1, XC2)×wc,whereXP1andXP2are the
expanded prerequisite sets ofT1andT2,XC1andXC2are the expanded consequence sets ofT1andT2, and
wp andwc = 1−wp are the weights for prerequisite and consequence, respectively. (In our experiments,
we use wp = wc = 0.5 to give equal weight to both prerequisite and consequence of hyper-alert types.)
We may then set a thresholdtso that two hyper-alert types are grouped into the same cluster only if their
similarity measure is greater than or equal to t. Appendix A includes some generalization hierarchies we
encountered in our experiments.
Remark Generalization of hyper-alert types is intended to hide unnecessary differences between different
A limitation of this method is that the attack strategies extracted from intrusion alerts heavily depend on the underlying IDSs and alert correlation system. In particular, if the IDSs miss a critical attack, or the alert correlation system leaves a critical step out of the corresponding attack scenario, the attack strategy may be split into multiple ones. Moreover, if the alert correlation system incorrectly places a false alert into an attack scenario, the quality of attack strategy will also degrade. Nevertheless, these problems exist even for manual intrusion analysis, and they have to be addressed by better intrusion detection and alert correlation techniques.
3
Measuring the Similarity between Attack Strategies
In this section, we present techniques to measure the similarity between attack strategy graphs based on error tolerant graph/subgraph isomorphism detection, which has been studied extensively in pattern recognition [4, 24–27]. Since the attack strategy graphs are extracted from sequences of correlated alerts, the similarity between two attack strategy graphs are indeed the similarity between the original alert sequences in terms of their strategies. Such similarity measurement is a fundamental problem in intrusion analysis; it has potential applications in incident handling, computer and network forensics, and other security management areas.
We are particularly interested in two problems. First, how similar are two attack strategies? Second, how likely is one attack strategy a part of another attack strategy? These two problems can be mapped naturally to error tolerant graph isomorphism and error tolerant subg raph isomorphism problems, respectively.
To facilitate the later discussion, we give a brief overview of error tolerant graph/subgraph isomorphism. Further details can be found in the rich literature on graph/subgraph isomorphism [4, 24–27].
3.1 Error Tolerant Graph/Subgraph Isomorphism
In graph/subgraph isomorphism, a graph is a quadrupleG= (N, E, T, C), where N is the set of nodes,E
is the set of edges,T is a mapping that assigns labels to the nodes, andCis a mapping that assigns labels to
the edges. Given two graphsG1 = (N1, E1, T1, C1)andG2 = (N2, E2, T2, C2), a bijective functionfis a
graph isomorphism fromG1 toG2if
• for alln1∈N1, T1(n1) =T2(f(n1));
• for alle1 = (n1, n′1)∈E1, there existse2 = (f(n1), f(n′1))∈E2such thatC(e1) =C(e2), and for
alle2 = (n2, n′2)∈E2, there existse1= (f−1(n2), f−1(n′2))∈E1 such thatC(e2) =C(e1).
Given a graph G = (N, E, T, C), a subgraph of G is a graph Gs = (Ns, Es, Ts, Cs) such that (1)
Ns ⊆ N, (2) Es = E ∩(Ns ×Ns), (3) for all ns ∈ Ns, Ts(ns) = T(ns), and (4) for all es ∈ Es,
Cs(es) = C(es). Given two graphs G1 = (N1, E1, T1, C1) and G2 = (N2, E2, T2, C2), an injective
functionf is a subgraph isomorphism fromG1toG2, if there exists a subgraph G2sofG2such thatf is a
graph isomorphism fromG1toG2s.
As a further step beyond graph/subgraph isomorphism, error tolerant graph/subgraph isomorphism (which is also known as error correcting graph/subgraph isomorphism) is introduced to cope with noises or distor-tion in the input graphs. There are two approaches for error tolerant graph/subgraph isomorphism: graph edit distance and maximal common graph. In this paper, we focus on graph edit distance to study the application of error tolerant graph/subgraph isomorphism in intrusion detection.
of the least cost sequence of edit operations that transforms one graph into the other. We denote the edited
graph after a sequence of edit operations ∆ as ∆(G). Consider two graphs G1 and G2. The distance
D(G1, G2) from G1 to G2 w.r.t. graph isomorphism is the minimum sum of edit costs associated with a
sequence of edit operations ∆ on G1 that leads to a graph isomorphism from ∆(G1) toG2. Similarly,
the distance Ds(G1, G2) from G1 to G2 w.r.t. subgraph isomorphism is the minimum sum of edit costs
associated with a sequence of edit operations∆onG1that leads to a subgraph isomorphism from∆(G1)to
G2. An error tolerant graph/subgraph isomorphism fromG1 toG2is a pair (∆, f), where∆is a sequence
of edit operations onG1, andf is a graph/subgraph isomorphism from∆(G1)toG2.
It is well known that subgraph isomorphism detection is an NP-complete problem [17]. Error tolerant sub-graph isomorphism detection, which involves subsub-graph isomorphism detection, is also in NP and generally harder than exact subgraph isomorphism detection [25]. Nevertheless, error tolerant subgraph isomorphism has been widely applied in image processing and pattern recognition [4, 24–27]. In our application, all the attack strategy graphs we have encountered are small graphs with less than 10 nodes. We argue that it is very unlikely to have very large attack strategy graphs in practice. Thus, we believe error tolerant graph/subgraph isomorphism can be applied to measure the similarity between attack strategy graphs with reasonable response time. Indeed, we did not observe any noticeable delay in our experiments.
3.2 Working with Attack Strategy Graphs
To successfully use error tolerant graph/subgraph isomorphism detection techniques, we need to answer at least the following three questions. What are the edit operations on an attack strategy graph? What are reasonable edit costs of these edit operations? What is the right similarity measurement between attack strategy graphs?
All the edit operations on a labeled graph are applicable to attack strategy graphs. Specifically, an edit
operation on an attack strategy graphASG= (N, E, T, C)is one of the following:
1. Inserting a noden:$→n. This represents adding a stage into an attack strategy. This edit operation
is only needed for error-tolerant graph isomorphism.
2. Deleting a noden: n → $. This represents removing a stage from an attack strategy. Note that this
implies deleting all edges adjacent withn.
3. Substituting the hyper-alert type of a noden:T(n)→t, wheretis a hyper-alert type. This represents
changing the attack at one stage of the attack strategy.
4. Inserting an edgee= (n1, n2): $→ e, wheren1, n2 ∈N. This represents adding dependency (i.e.,
prepare for relation) between two attack stages.
5. Deleting an edge e = (n1, n2): e → $. This represents removing dependency (i.e., prepare for
relation) between two attack stages.
6. Substituting the label of an edgee = (n1, n2): C(e) → c, where cis a set of equality constraints.
This represents changing the way in which two attack stages are related to each other. (Note thatcis
not necessarily a set of equality constraints for(T(n1), T(n2)).)
These edit operations do not necessarily transform one attack strategy graph into another attack strategy graph. Indeed, a labeled graph must satisfy some constraints to be an attack strategy graph. For
exam-ple, all the equality constraints in the label associated with (n1, n2)must be valid equality constraints for
One may suggest these constraints be enforced throughout the transformation of attack strategy graphs. As an additional benefit, this can be used to reduce the search space required for graph/subgraph isomor-phism. However, this approach may not find the least expensive sequence of edit operations, and may even fail to find a transformation from one attack strategy graph to (the subgraph of) another. Indeed, editing distance is one way to measure the difference between attack strategy graphs; it is not necessary to require that all the intermediate edited graphs are attack strategy graph. As long as the final edited graph is isomor-phic to an attack strategy graph, it is guaranteed to be an attack strategy graph. Thus, we do not require the intermediate graphs during graph transformation be attack strategy graphs.
Assignment of edit costs to the edit operations is a critical step in error tolerant graph/subgraph isomor-phism. The actual costs are highly dependent on the domain in which these techniques are applied. In our application, there are multiple reasonable ways to assign the edit costs. In the following, we attempt to give some constraints that the cost assignment must satisfy.
In an attack strategy graph, a node represents a stage in an attack strategy, while an edge represents the causal relationship between two steps in the strategy. Obviously, changing the stages in an attack strategy affects the attack strategy significantly more than modifying the causal relationships between stages. Thus, the edit costs of node related operations should be significantly more expensive than those of the edge related operations.
Inserting or deleting a node implies having one more or fewer step in the strategy, while substituting a node type implies to replace the attack in one step in the strategy. Thus, inserting or deleting a node has at least the same impact on the strategy as substituting the node type. Moreover, deleting a node and inserting a node are both manipulations of a stage; there is no reason to say one operation has more impact than the other. Therefore, they should have the same cost. Both inserting and deleting an edge changes the causal relationship between two attack stages, and they should have the same impact on the attack strategy. However, substituting the label of an edge is just to change the way in which two attack stages are related. Thus, it should have less cost than edge insertion and deletion. In summary, we can derive the following constraint in edit cost assignments.
Constraint 1 Costn→$=Cost$→n≥CostT(n)→t>> Cost$→e=Coste→$≥CostC(e)→c.
The labels in an attack strategy graph is indeed a set of equality constraints. As a result, labels are not entirely independent of each other. This further implies that edit costs for edge label substitution should not
be uniformly assigned. For example, substituting an edge label {A, B} for{A, C}should have less cost
than substituting{A, B}for{C, D}. This observation leads to another constraint.
Constraint 2 Assume that the edit operation C(e) → c replaces C(e) = cold withcnew. The edit cost
CostC(e)→cshould be smaller whencoldandcnewhave more equality constraints in common.
Intuitively, Constraint 2 says the more equality constraints two labels have in common, the less cost the replacement operation should have. Here we give a simple way to accommodate Constraint 2. We assume
there is a maximum edit cost for label substitution operation, denoted asM axCostC(e)→c. The edit cost of
a label substitution is thenCostC(e)→c=M axCostC(e)→c×||ccoldold∩∪ccnewnew||, wherecoldandcneware the labels
(i.e., sets of equality constraints) before and after the operation.
Consider an attack strategy graph ASG. We refer to the distance from ASG to an empty graph as the
reductive weight ofASG, denoted asWr(ASG). Similarly, we refer to the distance from an empty graph to
ASGas the constructive weight ofASG, denotedWc(ASG).
Definition 6 Consider two attack strategy graphs ASG1 and ASG2. The similarity between ASG1 and ASG2w.r.t. (attack) strategy isSim(ASG1, ASG2) = Sim(ASG1→ASG2)+Sim(ASG2→ASG1)
2 ,whereSim(ASGx →
ASGy) = 1−Wr(DASG(ASGx)+x,ASGWc(ASGy) y).
Definition 7 Consider two attack strategy graphs ASG1 and ASG2. The similarity between ASG1 and
ASG2w.r.t. (attack) sub-strategy isSimSub(ASG1, ASG2) = 1−WrD(ASGs(ASG1)+1W,ASGc(ASG2) 2).
3.3 Influence of the Edit Cost on Similarity Measurement
Suppose we have two graph Ga and Gb, which havena and nb nodes, and ea and eb edges, respectively.
Suppose we perform an error tolerant graph isomorphism from Ga to Gb, the node operations have the
same cost CN, and edge operations have the same cost CE, where CN ≫ CE. In the sequence of edit
operations, suppose there are NN node operations, andNE edge operations. Then the similarity measure
can be simplified as follows:
Sim(Ga, Gb) = 1−
D(Ga, Gb)
Wr(Ga) +Wc(Gb)
= 1− CN ×NN+CE ×NE CN ×(na+nb) +CE×(ea+eb)
Further letea+eb =k×(na+nb), andNE =s×NN. Then we have
Sim(Ga, Gb) = 1−
CN ×NN +CE×s×NN
CN×(na+nb) +CE ×k×(na+nb)
= 1− NN ×(CN +CE×s)
(na+nb)×(CN+CE×k)
Whenkandsare not large, sinceCN ≫CE, the formula can be further simplified below:
Sim(Ga, Gb) = 1−
NN
na+nb
Thus, under the above assumptions, the similarity is approximately determined by the proportion of the number of edited nodes to the total number of nodes.
In summary, when the number of edges are not substantially more than the number of nodes, and the number of edge operations are not substantially more than the number of node operations, the similarity measure is mainly determined by the number of nodes and node operations rather than the edit costs.
4
Experiments
We have performed a series of experiments to study the techniques proposed in this paper. In our exper-iments, we used the implementation of the correlation model, the NCSU Intrusion Alert Correlator [31], to correlate intrusion alerts. Following their example, we also used GraphViz [2] to visualize graphs. In addition, we used GUB [24], A Toolkit for Graph Matching, to perform error tolerant graph/subgraph iso-morphism detection and compute distances between attack strategy graphs. We used Snort [36] as our IDS sensor.
IPsweep, probes of sadmind services, breakins through sadmind exploits, installations of DDoS programs, and finally the DDoS attack. LLDOS 2.0.2 is similar to LLDOS 1.0; however, the attacks in LLDOS 2.0.2 are more stealthy than those in LLDOS 1.0. In addition to the DARPA data sets, we also performed three sequences of attacks in an isolated network. In all these three attack sequences, the attacker started with nmap [16] scans of the victim. Then, in the first sequence, the attacker sent malformed urls [8] to the victim’s Internet Information Services (IIS) to get a cmd.exe shell. In the second sequence, the attacker took advantage of the flaws of IP fragment reassembly on Windows 2000 [7] to launch a DoS attack. In the third sequence, the attacker launched a buffer overflow attack against the Internet Printing Protocol accessed via IIS 5.0 [5, 9]. Further details of these attack sequences are included in Appendix B. We also used the alert sets provided along with the Intrusion Alert Correlator [31]. These alerts were generated by RealSecure Network Sensor [18] on the 2000 DARPA data sets, too. We label their alert sets with RealSecure, while label ours with Snort to distinguish between them.
4.1 Learning Attack Strategies from Correlated Intrusion Alerts
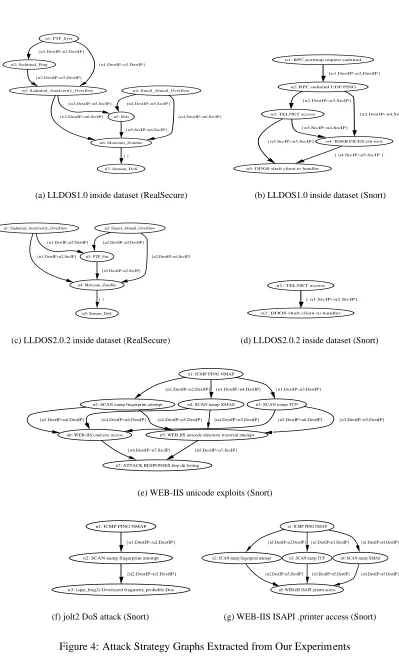
Our first goal is to evaluate the effectiveness of our approach on extracting the attack strategies. Figure 4 shows all of the attack strategy graphs extracted from the test data sets. The label inside each node is the node ID followed by the hyper-alert type of the node. The label of each edge describes the set of equality constraints for the hyper-alert types associated with the two end nodes.
The attack strategy graphs we extracted from LLDOS 1.0 (inside part) are shown in Figure 4(a) and 4(b). (Note that Figure 4(a) has 7 nodes, which is much simplified compared with 44 nodes in the corresponding attack scenario reported in [32].) Based on the description of the data set [28], we know that both Figures 4(a) and 4(b) have captured most of the attack strategy. The missing parts are due to the attacks missed by the IDSs. In this part of experiments, we did not generalize variations of hyper-alert types. Thus, these graphs still have syntactic differences despite their common strategy. (Note that the “RPC sadmind UDP PING” alert reported by Snort is indeed the “Sadmind Amslverify Overflow” alert by RealSecure, and the “RPC portmap sadmind request UDP” alert by Snort is the “Sadmind Ping” alert by RealSecure.) Moreover, false alerts are also reflected in the attack strategy graphs. For example, the hyper-alert types “Email Almail Overflow” and “FTP Syst” in Figure 4(a) do not belong to the attack strategy, but they are included because of the false detection.
The attack strategies extracted from LLDOS 2.0.2 are shown in Figures 4(c) and 4(d). Compared with the five phases of attack scenarios [28], it is easy to see that Figure 4(c) reveals most of the adversary’s strategy. However, Figure 4(d) reveals two steps fewer than Figure 4(c). Our further investigation indicates that this is because one critical attack step, the buffer overflow attacks against sadmind service, was completely missed by Snort. Figures 4(e), 4(f), and 4(g) show the attack strategies extracted from the three sequences of attacks we performed. By comparing with the attacks, which are described in Appendix B, we can see that the stages as well as the constraints intrinsic to these attack strategies are mostly captured by these graphs.
Though showing some potential, these experimental results also reveal a limitation of the attack strategy learning method: That is, our method depends on the underlying IDSs as well as the alert correlation method. If the hyper-alert correlation graphs do not reveal the entire attack strategy, or include false alerts, the attack strategy graphs generated by our method will not be perfect. Nevertheless, our technique is intended to automate the analysis process typically performed by human analysts, who may make the same mistake if no other information is used. More research is clearly needed to mitigate the impact of imperfect IDS and correlation.
n1: FTP_Syst n2: Sadmind_Ping {n1.DestIP=n2.DestIP} n3: Sadmind_Amslverify_Overflow {n1.DestIP=n3.DestIP} {n2.DestIP=n3.DestIP} n5: Rsh {n3.DestIP=n5.SrcIP} n6: Mstream_Zombie {n3.DestIP=n6.SrcIP} {n5.SrcIP=n6.SrcIP} n7: Stream_DoS { } n4: Email_Almail_Overflow {n4.DestIP=n5.SrcIP} {n4.DestIP=n6.SrcIP}
(a) LLDOS1.0 inside dataset (RealSecure)
n1: RPC portmap request sadmind
n2: RPC sadmind UDP PING {n1.DestIP=n2.DestIP}
n3: TELNET access
{n2.DestIP=n3.SrcIP}
n4: RSERVICES rsh root {n2.DestIP=n4.SrcIP}
{n3.SrcIP=n4.SrcIP}
n5: DDOS shaft client to handler {n3.SrcIP=n5.SrcIP}
{ n4.SrcIP=n5.SrcIP }
(b) LLDOS1.0 inside dataset (Snort)
n1: Sadmind_Amslverify_Overflow n3: FTP_Put {n1.DestIP=n2.DestIP} n4: Mstream_Zombie {n1.DestIP=n2.SrcIP} {n3.DestIP=n2.SrcIP} n5: Stream_DoS { } n2: Email_Almail_Overflow {n2.DestIP=n3.DestIP} {n2.DestIP=n4.SrcIP}
(c) LLDOS2.0.2 inside dataset (RealSecure)
n1: TELNET access
n2: DDOS shaft client to handler { n1.SrcIP=n2.SrcIP}
(d) LLDOS2.0.2 inside dataset (Snort)
n1: ICMP PING NMAP
n2: SCAN namp fingerprint attempt
{n1.DestIP=n2.DestIP}
n3: SCAN namp TCP {n1.DestIP=n3.DestIP}
n4: SCAN namp XMAS {n1.DestIP=n4.DestIP}
n5: WEB-IIS unicode directory traversal attempt {n2.DestIP=n5.DestIP}
n6: WEB-IIS cmd.exe access
{n2.DestIP=n6.DestIP} {n4.DestIP=n6.DestIP} {n4.DestIP=n5.DestIP} {n3.DestIP=n6.DestIP} {n3.DestIP=n5.DestIP}
n7: ATTACK RESPONSES http dir listing
{n5.DestIP=n7.SrcIP} {n6.DestIP=n7.SrcIP}
(e) WEB-IIS unicode exploits (Snort)
n1: ICMP PING NMAP
n2: SCAN namp fingerprint attempt {n1.DestIP=n2.DestIP}
n3: (spp_frag2) Oversized fragment, probable Dos {n2.DestIP=n3.DestIP}
(f) jolt2 DoS attack (Snort)
n1: ICMP PING NMAP
n2: SCAN namp fingerprint attempt
{n1.DestIP=n2.DestIP}
n3: SCAN namp TCP {n1.DestIP=n3.DestIP}
n4: SCAN namp XMAS {n1.DestIP=n4.DestIP}
n5: WEB-IIS ISAPI .printer access
{n2.DestIP=n5.DestIP} {n3.DestIP=n5.DestIP} {n4.DestIP=n5.DestIP}
(g) WEB-IIS ISAPI .printer access (Snort)
Table 1: The similarity w.r.t. attack strategy between attack strategy graphs in Figure 4
G4(a) G4(b) G4(c) G4(d) G4(e) G4(f) G4(g)
G4(a) / 0.72 0.73 0.21 0.29 0.31 0.25
G4(b) 0.72 / 0.66 0.55 0.25 0.25 0.29
G4(c) 0.73 0.66 / 0.40 0.34 0.38 0.30
G4(d) 0.21 0.55 0.40 / 0.21 0.40 0.38
G4(e) 0.29 0.25 0.34 0.21 / 0.48 0.74
G4(f) 0.31 0.25 0.38 0.40 0.48 / 0.61
G4(g) 0.25 0.29 0.30 0.38 0.74 0.61 /
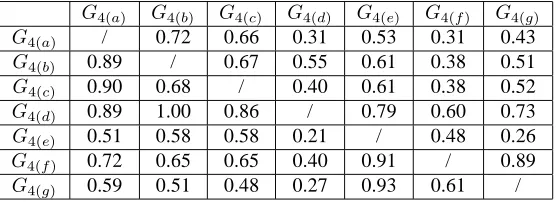
Table 2: The similarity w.r.t. attack sub-strategy between attack strategy graphs in Figure 4
G4(a) G4(b) G4(c) G4(d) G4(e) G4(f) G4(g)
G4(a) / 0.72 0.66 0.31 0.53 0.31 0.43
G4(b) 0.89 / 0.67 0.55 0.61 0.38 0.51
G4(c) 0.90 0.68 / 0.40 0.61 0.38 0.52
G4(d) 0.89 1.00 0.86 / 0.79 0.60 0.73
G4(e) 0.51 0.58 0.58 0.21 / 0.48 0.26
G4(f) 0.72 0.65 0.65 0.40 0.91 / 0.89
G4(g) 0.59 0.51 0.48 0.27 0.93 0.61 /
against sadmind service and then use telnet to access the victim machine.
Note that we do not give a quantitative performance evaluation of attack strategy extraction (i.e., the false positive and false negative of the extracted attack strategies). This is because such measures are indeed determined by the underlying intrusion alert correlation algorithm. As long as correlation is performed correctly, our method can always extract the strategy reflected by the correlated alerts.
4.2 Measuring the Similarity between Alert Sequences
We performed some experiments to measure the similarity between the previously extracted seven attack strategy graphs. To hide the unnecessary differences between alert types, we generalized similar alert types. Due to space reasons, we do not redraw the attack strategy graphs. The generalization details are given in Appendix B. We assume the edit costs for node operations are all 10, and the edit costs for the edge operations are all 1.
Tables 1 and 2 show the similarity measurements between each pair of attack strategy graphs w.r.t. attack strategy and attack sub-strategy, respectively. Each subscript in the tables denotes the graph it represents.
We notice thatSimSub(Gi, Gj)may not necessarily be equal toSimSub(Gj, Gi).
Table 1 indicates that Figure 4(a) is more similar to Figures 4(b), and 4(c) to the other graphs. In addition, Figure 4(g) is more similar to Figures 4(e) and 4(f) than the other graphs. Based on the description of these attack sequences, we can see these similarity measures conform to human perceptions.
with these attack sequences, we can see these measures also conform to human perceptions.
The experiments also reveal some remaining problems that haven’t been addressed by our techniques. First, the similarity measures make sense in terms of their relative values. However, we still do not under-stand what a specific similarity measure represents. Second, false alerts generated by IDSs have a negative impact on the measurement. It certainly requires further research to address these issues.
4.3 Identification of Missed Detections
Our last set of experiments is intended to study the possibility to apply the similarity measurement method to identify attacks missed by IDSs. For the sake of presentation, we first introduce two terms: precedent set
and successive set. Intuitively, the precedent set of a nodenin an attack strategy graph is the set of nodes
from which there are paths ton, while the successive set ofnis the set of nodes to whichnhas a path. In
the following, we show two examples we encountered in our experiments.
Example 4 The attack strategy graph in Figure 4(c) has no network probe phase, but Figure 4(a) does. The
similarity measurement SimSub(G4(c), G4(a)) = 0.90 and Sim(G4(c), G4(a)) = 0.73 indicate that these
two strategies are very similar and it is very likely that Figure 4(c) is a sub-strategy of Figure 4(a). Thus, it is possible that some probe attacks are missed by the IDS when the IDS detected the attacks corresponding to Figure 4(c). Indeed, this is exactly what happened in LLDOS 2.0.2. The adversary uses some stealthy attacks (i.e., HINFO query to the DNS server) to get the information about the victim host.
Example 5 Consider Figures 4(d) and 4(b). We haveSimSub(G4(d), G4(b)) = 1.0. Thus, G4(d) is exactly
a sub-strategy ofG4(b). By checking the LLDOS2.0.2 alerts reported by Snort, we know that there are also
“RPC portmap sadmind request UDP” alerts as in Figure 4(b). However, since Snort did not detect the later buffer overflow attack, these “RPC portmap sadmind request UDP” alerts aren’t correlated with the later alerts.
We then perform the following steps, trying to identify attacks possibly missed in LLDOS 2.0.2. We pick
noden1in Figure 4(d), and find its corresponding node n3in Figure 4(b), which is mapped to n1 by the
subgraph isomorphism. It is easy to see that in Figure 4(b), the precedent set ofn3is{n1n2}, andn1has
the type “RPC portmap sadmind request UDP”. We then go back to LLDOS 2.0.2 alerts, and find “RPC
portmap sadmind request UDP” alerts before “TELNET ACCESS”. By comparing the precedent set ofn1
in Figure 4(d) and the precedent set ofn3in Figure 4(b), we suspect that “RPC sadmind UDP PING” (which
corresponds to noden2in Figure 4(b)) has been missed in LLDOS 2.0.2. If we add such an alert, we may
correlate it with “RPC portmap sadmind request UDP” and further with “TELNET access” in Figure 4(d). Indeed, “RPC sadmind UDP PING” is the buffer overflow attack missed by Snort in LLDOS 2.0.2.
The later part of example 5 is very similar to the abductive correlation proposed in [11]. The additional feature provided by the similarity measurement is the guidelines about what attacks may be missed. In this sense, the similarity measurement is complementary to the abductive correlation. Moreover, these examples are provided to demonstrate the potential of identifying missed attacks through measuring similarity of attack sequences. It is also possible that the attacker didn’t launch those attacks. Additional research is necessary to improve the performance and reduce false identification rate.
5
Related Work
together based on their relationships, we further extract the attack strategy used in the attacks, and use them to measure the similarity between sequences of alerts.
There are other alert correlation techniques. The techniques in [10, 13, 38, 41] correlate alerts on the basis of the similarities between the alert attributes. The Tivoli approach correlates alerts based on the observation that some alerts usually occur in sequence [14]. M2D2 correlates alerts by fusing information from multiple sources besides intrusion alerts, such as the characteristics of the monitored systems and the vulnerability information [29], thus having a potential to result in better results than those simply looking at intrusion alerts. The mission-impact-based approach correlates alerts raised by INFOSEC devices such as IDS and firewalls with the importance of system assets [34]. The alert clustering techniques in [22, 23] use conceptual clustering and generalization hierarchy to aggregate alerts into clusters. Alert correlation may also be performed by matching attack scenarios specified by attack languages. Examples of such languages include STATL [15], LAMBDA [12], and JIGSAW [39]. We consider these techniques as complementary to ours.
Our approach is also closely related to techniques for static vulnerability analysis (e.g., [1, 21, 35, 37]). In particular, the methods in [1, 37] also use a model of exploits (possible attacks) in terms of their pre-conditions (prerequisites) and post-pre-conditions (consequences). Our approach complements static vulnera-bility analysis methods by providing the capavulnera-bility of examining the actual execution of attack strategies in different details (e.g., an attacker tries different variations of the same attack), and thus gives human users more information to respond to attacks.
Our approach to similarity measurement of attack strategies is based on error-tolerant graph/subgraph isomorphism techniques [3, 6, 24, 25, 40]. The early work about graph/subgraph isomorphism was presented in [3, 6, 40]. The traditional methods are A* based approaches [30]. The more efficient algorithms proposed recently include decomposition-based approaches [24–26] and decision tree-based approaches [24, 27].
6
Conclusion and Future Work
In this paper, we developed techniques to extract attack strategies from correlated intrusion alerts based on the recent advances in intrusion alert correlation [11, 32]. Our contributions include a model to represent and algorithms to extract attack strategies from intrusion alerts. Moreover, to accommodate variations in attacks that are not intrinsic to attack strategies, we propose to generalize different types of intrusion alerts to hide the unnecessary difference between them. Finally, we developed techniques to measure the similar-ity between sequences of attacks based on their strategies. Our experimental results have shown that our techniques can successfully extract invariant attack strategies from sequences of alerts, measure the similar-ity between alert sequences in a way conforming to human intuition, and has a potential to identify attacks missed by IDSs.
Several future research directions are worth investigating. First, we would like to study how to take advantage of relationships between attack strategies extracted at different generalization levels. Second, we plan to develop techniques that can hypothesize and reason about attacks possibly missed IDSs. Finally, system support for learning and using attack strategies is also a desirable issue to look into.
References
[1] P. Ammann, D. Wijesekera, and S. Kaushik. Scalable, graph-based network vulnerability analysis. In
Proceedings of the 9th ACM Conference on Computer and Communications Security, pages 217–224,
[2] AT & T Research Labs. Graphviz - open source graph layout and drawing software. http://www.
research.att.com/sw/tools/graphviz/.
[3] A. T. Berztiss. A backtrack procedure for isomorphism of directed graphs. Journal of the Association
for Computing Machinery, 20(3):51–64, July 1973.
[4] H. Bunke and K. Shearer. A graph distance metric based on the maximal common subgraph. Pattern
Recognition Letters, 19(3-4):255–259, 1998.
[5] CERT Coordination Center. Cert advisory CA-2001-10 buffer overflow vulnerability in microsoft IIS
5.0. http://www.cert.org/advisories/CA-2001-10.html, 2001.
[6] D. G. Corneil and C. C. Gotlieb. An efficient algorithm for graph isomorphism. Journal of the
Asso-ciation for Computing Machinery, 17(1):51–64, January 1970.
[7] Microsoft Corporation. Microsoft security bulletin (ms00-029). http://www.microsoft.
com/technet/treeview/default.asp?url=/technet/secu%rity/bulletin/ MS00-029.asp, 2000.
[8] Microsoft Corporation. Microsoft security bulletin (ms00-078). http://www.microsoft.
com/technet/treeview/default.asp?url=/technet/secu%rity/bulletin/ MS00-078.asp, 2000.
[9] Microsoft Corporation. Microsoft security bulletin (ms01-023). http://www.microsoft.
com/technet/treeview/default.asp?url=/technet/secu%rity/bulletin/ MS01-023.asp, 2001.
[10] F. Cuppens. Managing alerts in a multi-intrusion detection environment. In Proceedings of the 17th
Annual Computer Security Applications Conference, December 2001.
[11] F. Cuppens and A. Miege. Alert correlation in a cooperative intrusion detection framework. In
Pro-ceedings of the 2002 IEEE Symposium on Security and Privacy, May 2002.
[12] F. Cuppens and R. Ortalo. LAMBDA: A language to model a database for detection of attacks. In
Proc. of Recent Advances in Intrusion Detection (RAID 2000), pages 197–216, September 2000.
[13] O. Dain and R.K. Cunningham. Building scenarios from a heterogeneous alert stream. In Proceedings
of the 2001 IEEE Workshop on Information Assurance and Security, pages 231–235, June 2001.
[14] H. Debar and A. Wespi. Aggregation and correlation of intrusion-detection alerts. In Recent Advances
in Intrusion Detection, LNCS 2212, pages 85 – 103, 2001.
[15] S.T. Eckmann, G. Vigna, and R.A. Kemmerer. STATL: An Attack Language for State-based Intrusion Detection. Journal of Computer Security, 10(1/2):71–104, 2002.
[16] Fyodor. Nmap free security scanner. http://www.insecure.org/nmap, 2003.
[17] M. R. Gary and D. S. Johnson. Computers and Intractability: A Guide to the Theory of
NP-Completeness. Freeman and Company, 1979.
[18] Internet Security Systems. RealSecure intrusion detection system. http://www.iss.net.
[20] A.K. Jain and R.C. Dubes. Algorithms for Clustering Data. Prentice Hall, 1988.
[21] S. Jha, O. Sheyner, and J.M. Wing. Two formal analyses of attack graphs. In Proceedings of the 15th
Computer Security Foundation Workshop, June 2002.
[22] K. Julisch. Mining alarm clusters to improve alarm handling efficiency. In Proceedings of the 17th
Annual Computer Security Applications Conference (ACSAC), pages 12–21, December 2001.
[23] Klaus Julisch and Marc Dacier. Mining intrusion detection alarms for actionable knowledge. In The
8th ACM International Conference on Knowledge Discovery and Data Mining, July 2002.
[24] B. T. Messmer. Efficient Graph Matching Algorithms for Preprocessed Model Graphs. PhD thesis, University of Bern, Switzerland, November 1995.
[25] B. T. Messmer and H. Bunke. A new algorithm for error-tolerant subgraph isomorphism detection.
IEEE Transactions on Pattern Analysis and Machine Intelligence, 20(5):493–504, 1998.
[26] B. T. Messmer and H. Bunke. Efficient subgraph isomorphism detection: A decomposition approach.
IEEE Transactions on Knowledge and Data Engineering, 12(2):307–323, 2000.
[27] B.T. Messmer and H. Bunke. A decision tree approach to graph and subgraph isomorphism detection.
Pattern Recognition, 32(12):1979–1998, 1999.
[28] MIT Lincoln Lab. 2000 DARPA intrusion detection scenario specific datasets. http://www.ll.
mit.edu/IST/ideval/data/2000/2000_data_index.html, 2000.
[29] B. Morin, L. M´e, H. Debar, and M. Ducass´e. M2D2: A formal data model for IDS alert correlation.
In Proceedings of the 5th International Symposium on Recent Advances in Intrusion Detection (RAID
2002), pages 115–137, 2002.
[30] N. J. Nilsson. Principles of Artificial Intelligence. Tioga, 1980.
[31] P. Ning and Y. Cui. Intrusion alert correlator (version 0.2). http://discovery.csc.ncsu.
edu/software/correlator/ver0.2/iac.html, 2002.
[32] P. Ning, Y. Cui, and D. S Reeves. Constructing attack scenarios through correlation of intrusion alerts. In Proceedings of the 9th ACM Conference on Computer and Communications Security, pages 245– 254, Washington, D.C., November 2002.
[33] Packet storm. http://packetstormsecurity.nl. Accessed on April 30, 2003.
[34] P.A. Porras, M.W. Fong, and A. Valdes. A mission-impact-based approach to INFOSEC alarm corre-lation. In Proceedings of the 5th International Symposium on Recent Advances in Intrusion Detection
(RAID 2002), pages 95–114, 2002.
[35] C.R. Ramakrishnan and R. Sekar. Model-based analysis of configuration vulnerabilities. Journal of
Computer Security, 10(1/2):189–209, 2002.
[36] M. Roesch. Snort - lightweight intrusion detection for networks. In Proceedings of the 1999 USENIX
LISA conference, 1999.
GT7
GT8 HTTP_Shells
Sadmind_Amslverify _Overflow
HTTP_Cisco _Catalyst_Exec
(a) Hierarchy 1
GT15
GT16 GT20
HTTP_Java HTTP_ActiveX FTP_Put Rsh
(b) Hierarchy 2
GT10
GT12 GT11
GT19 FTP_User GT13 FTP_Pass
Email_Debug Email_Almail _Overflow DNS_HInfo FTP_Syst
(c) Hierarchy 3
Figure 5: Generalization hierarchies for the hyper-alert types in DARPA 2000 dataset. Thresholdt= 0.5.
[38] S. Staniford, J.A. Hoagland, and J.M. McAlerney. Practical automated detection of stealthy portscans.
Journal of Computer Security, 10(1/2):105–136, 2002.
[39] S. Templeton and K. Levitt. A requires/provides model for computer attacks. In Proceedings of New
Security Paradigms Workshop, pages 31 – 38. ACM Press, September 2000.
[40] J. R. Ullmann. An algorithm for subgraph isomorphism. Journal of the Association for Computing
Machinery, 23(1):31–42, 1976.
[41] A. Valdes and K. Skinner. Probabilistic alert correlation. In Proceedings of the 4th International
Symposium on Recent Advances in Intrusion Detection (RAID 2001), pages 54–68, 2001.
A
Automatic Generalization of Hyper-Alert Types
Sadmind Buffer Overflow
Sadmind_Amslverify_Overflow RPC sadmind UDP PING
(a) Hierarchy 1
Rsh access
Rsh RSERVICES rsh root
(b) Hierarchy 2
DDoS Master_Zombie_Comm
Mstream_Zombie DDOS shaft client to handler
(c) Hierarchy 3
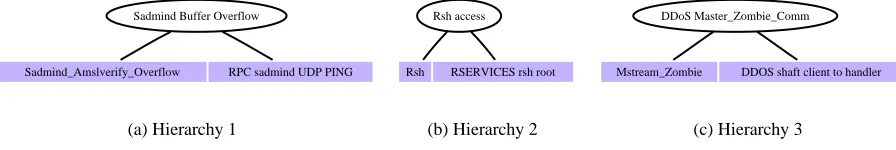
Figure 6: Additional generalizations of hyper-alert types in our experiments
B
Further Details of The Experiments
Attack Sequences in Our Experiments. Here we describe the three sequences of attacks performed in our experiments. Since the descriptions of the attacks in the DARPA datasets are available on-line [28], we don’t repeat them in this paper.
In the first sequence of attacks (Figure 4(e)), the attacker first uses nmap [16] to scan the victim machine. (Nmap supports ping sweeps, port scans, and operating system detection.) After knowing that the OS of the victim may be windows 2000 and port 80 is open, the attacker runs a Perl script which includes 20 different malformed urls [8] against the victim machine’s Internet Information Services (IIS). The output of the Perl script is a list of malformed urls to which the victim IIS is vulnerable. The attacker then selects one of the vulnerabilities to perform the actual attack and gets a cmd.exe shell on the victim machine. The attacker then uses interactive commands to list and delete some files, and finally exit the command shell. Figure 4(e) reveals this strategy.
In the second sequence of attacks (Figure 4(f)), the attacker uses nmap to scan the victim machine. However, after knowing that the OS of the victim may be windows 2000, the attacker ran a “jolt2” Perl script, which would create a DoS attack to the victim machine. (Jolt2 is a DoS attack which can take advantage of the flaws of IP fragment reassembly on Windows 2000 [7].) Figure 4(f) reveals this strategy, and because of the limitation of the Snort’s signatures, it can only tell administrators “(spp frag2) Oversized fragment, probable DoS”.
In the third sequence of attacks (Figure 4(g)), the attacker uses nmap to scan the victim machine. After knowing the OS of the victim may be windows 2000 and the port 80 is open, the attacker sets up a netcat listening port on his machine, and runs a program “iis5hack” buffer overflow attack, which may result in a buffer overflow on the Internet Printing Protocol accessed via IIS 5.0 [5, 9]. Following a successful iishack attack, the attaker’s machine would get a reverse cmd.exe shell on the netcat listening port, and the attacker can do whatever he/she wants on the victim machine, such as listing and deleting files. In Figure 4(g), the netcat command shell attack is missing, because Snort cannot detect such attacks.
Generalization of Hyper-alert Types. The generalizations of hyper-alert types in our experiments include