HIGHLIGHTED ARTICLE
| INVESTIGATION
Assessing the Relationship of Ancient and
Modern Populations
Joshua G. Schraiber1
Department of Biology, and Institute for Genomics and Evolutionary Medicine, Temple University, Philadelphia, Pennsylvania 19122 ORCID ID: 0000-0002-7912-2195 (J.G.S.)
ABSTRACTGenetic material sequenced from ancient samples is revolutionizing our understanding of the recent evolutionary past. However, ancient DNA is often degraded, resulting in low coverage, error-prone sequencing. Several solutions exist to this problem, ranging from simple approach, such as selecting a read at random for each site, to more complicated approaches involving genotype likelihoods. In this work, we present a novel method for assessing the relationship of an ancient sample with a modern population, while accounting for sequencing error and postmortem damage by analyzing raw reads from multiple ancient individuals simultaneously. We show that, when analyzing SNP data, it is better to sequence more ancient samples to low coverage: two samples sequenced to 0.53coverage provide better resolution than a single sample sequenced to 23coverage. We also examined the power to detect whether an ancient sample is directly ancestral to a modern population,finding that, with even a few high coverage individuals, even ancient samples that are very slightly diverged from the modern population can be detected with ease. When we applied our approach to European samples, we found that no ancient samples represent direct ancestors of modern Europeans. We also found that, as shown previously, the most ancient Europeans appear to have had the smallest effective population sizes, indicating a role for agriculture in modern population growth.
KEYWORDSpopulation continuity; diffusion theory; ancient DNA; SNP data
A
NCIENT DNA (aDNA) is now ubiquitous in populationgenetics. Advances in DNA isolation (Dabneyet al.2013), library preparation (Meyeret al.2012), bone sampling (Pinhasi et al.2015), and sequence capture (Haaket al.2015) make it possible to obtain genome-wide data from hundreds of samples (Allentoftet al.2015; Haaket al.2015; Mathiesonet al.2015; Fuet al.2016). Analysis of these data can provide new insight into recent evolutionary processes, which leave faint signatures in modern genomes, including natural selection (Jewettet al. 2016; Schraiber et al. 2016) and population replacement (Lazaridiset al.2014; Sjödinet al.2014).
One of the most powerful uses of aDNA is to assess the continuity of ancient and modern populations. In many cases, it is unclear whether populations that occupied an area in the past are the direct ancestors of the current inhabitants of that area. However, this can be next to impossible to assess using only modern genomes. Questions of population continuity and replacement have particular relevance for the spread of cultures and technology in humans (Lazaridiset al.2016). For instance, recent work showed that modern South Americans are descended from people associated with the Clovis culture that inhabited North America over 10,000 years ago, further enhancing our understanding of the peopling of the Americas (Rasmussenet al.2014).
Despite its utility in addressing difficult-to-answer ques-tions in evolutionary biology, aDNA also has several limita-tions. Most strikingly, DNA decays rapidly following the death of an organism, resulting in highly fragmented, degraded starting material when sequencing (Sawyer et al. 2012). Thus, ancient data are frequently sequenced to low cov-erage, and has a significantly higher rate of misleadingly called nucleotides than modern samples. When working with diploid data, as in aDNA extracted from plants and
Copyright © 2018 Schraiber
doi:https://doi.org/10.1534/genetics.117.300448
Manuscript received July 24, 2017; accepted for publication November 17, 2017; published Early Online November 22, 2017.
Available freely online through the author-supported open access option.
This is an open-access article distributed under the terms of the Creative Commons Attribution 4.0 International License (http://creativecommons.org/licenses/by/4.0/), which permits unrestricted use, distribution, and reproduction in any medium, provided the original work is properly cited.
Supplemental material is available online atwww.genetics.org/lookup/suppl/doi:10. 1534/genetics.117.300448/-/DC1.
animals, the low coverage prevents genotypes from being called with confidence.
Several strategies are commonly used to address the low-coverage data. One of the most common approaches is to sample a random read from each covered site, and use that as a haploid genotype call (Skoglundet al.2012; Allentoftet al. 2015; Haak et al. 2015; Mathiesonet al. 2015; Fu et al. 2016; Lazaridiset al.2016). Many common approaches to the analyses of aDNA, such as the usage of F-statistics (Greenet al.2010; Pattersonet al.2012), are designed with this kind of dataset in mind. F-statistics can be interpreted as linear combinations of simpler summary statistics, and can often be understood in terms of testing a tree-like structure relating populations. Nonetheless, despite the simplicity and appeal of this approach, it has several drawbacks. Pri-marily, it throws away reads from sites that are covered more than once, resulting in a potential loss of informa-tion from expensive, difficult-to-acquire data. Moreover, as shown by Peter (2016), F-statistics are fundamentally based on heterozygosity, which is determined by samples of size 2, and thus limited in power. Finally, these approaches are also strongly impacted by sequencing error, postmortem damage (PMD), and contamination.
On the other hand, several approaches exist to either work with genotype likelihoods or the raw read data. Genotype likelihoods are the probabilities of the read data at a site, given each of the three possible diploid genotypes at that site. They can be used in calculation of population genetic statistics, or likelihood functions, to average over uncertainty in the geno-type (Korneliussen et al. 2014). However, many such ap-proaches assume that genotype likelihoods are fixed by the SNP calling algorithm [although they may be recalibrated to account for aDNA-specific errors, as in Jónssonet al.(2013)]. However, with low coverage data, an increase in accuracy is expected if genotype likelihoods are coestimated with other parameters of interest, due to the covariation between process-es that influence read quality and genetic diversity, such as contamination.
A recent method that coestimates demographic parameters, along with error and contamination rates, by using genotype likelihoods, showed that there can be significant power to assess the relationship of a single ancient sample to a modern population (Racimoet al.2016). Nonetheless, they found that, for very low coverage data, inferences were not reliable. Thus, they were unable to apply their method to the large number of extremely low coverage (,13) genomes that are available. Moreover, they were unable to explore the tradeoffs that come with a limited budget: can we learn more by sequencing fewer individuals to high coverage, or more individuals at lower coverage?
Here, we develop a novel maximum likelihood approach for analyzing low coverage aDNA in relation to a modern population. We work directly with raw read data and explicitly model errors due to sequencing and portmortem damage. Crucially, our approach incorporates data from multiple indi-viduals that belong to the same ancient population, which we
show substantially increases power and reduces error in pa-rameter estimates. We then apply our new methodology to ancient human data, and show that we can perform accurate demographic inference, even from very low coverage samples, by analyzing them jointly.
Methods
Sampling alleles in ancient populations
We assume a scenario in which allele frequencies are known with high accuracy in a modern population. Suppose that an allele is known to be at frequencyx2 ð0;1Þin the modern population, and we wish to compute the probability of obtainingkcopies of that allele in a sample ofn(0#k#n) chromosomes from an ancient population. As we show in the Appendix, conditioning on the frequency of the allele in the modern population minimizes the impact of ascertainment, and allows this approach to be used for SNP capture data.
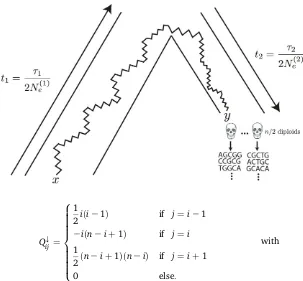
To calculate the sampling probability, we assume a simple demographic model, in which the ancient individual belongs to a population that split off from the modern populationt1 gen-erations ago, and subsequently existed as an isolated popula-tion fort2 generations. Further, we assume that the modern population has effective sizeNeð1Þ;and that the ancient popu-lation has effective size Nðe2Þ;and measure time in diffusion units, ti¼ti=ð2NeðiÞÞ:If we know the conditional probability that an allele is at frequencyyin the ancient sample, given that it is at frequency x in the modern population, denoted fðy;x;t1;t2Þ; then the sampling probability is simply an integral,
Pn;kðxÞ ¼
Z 1
0
n
k
ykð12yÞn2k fðy;x;t1;t2Þdy
¼n
k
ExðYkð12YÞn2k;t1;t2Þ
[nkpn;kðt1;t2Þ
(1)
Thus, we must compute the binomial moments of the allele frequency distribution in the ancient population. In theAppendix, we show that this can be computed using matrix exponentiation,
pn;kðt1;t2Þ ¼
eQt2eQYt1h n
i; (2)
where ðvÞi indicates the ith element of the vector v;
hn¼
ð12xÞn;xð12xÞn21;. . .;xnT and Q and QY are the
sparse matrices
Qij¼
1
2iði21Þ if j¼i21
2iðn2iÞ if j¼i 1
2ðn2iÞðn2i21Þ if j¼iþ1
QYij ¼ 1
2iði21Þ if j¼i21
2iðn2iþ1Þ if j¼i 1
2ðn2iþ1Þðn2iÞ if j¼iþ1
0 else:
8 > > > > > > > > < > > > > > > > > :
This result has an interesting interpretation: the matrixQYcan be thought of as evolving the allele frequencies back in time, from the modern population to the common ancestor of the ancient and modern populations, whileQevolves the allele frequencies forward in time, from the common ancestor to the ancient population (Figure 1).
Because of the fragmentation and degradation of DNA that is inherent in obtaining sequence data from ancient individuals, it is difficult to obtain the high coverage data necessary to make high quality genotype calls from ancient individuals. To address this, we instead work directly with raw read data, and average over all the possible genotypes weighted by their probability of producing the data. Specifically, we follow Nielsenet al.(2012) in modeling the probability of the read data in the ancient population, given the allele frequency at sitelas
ℙðRljkÞ ¼
X2
g1;l¼0
. . . X
2
gn;l¼0
I X
m
i¼1
gi;l¼k
! Yn
i¼1
2 gi;l
!
ℙRi;ljgi;l
;
whereRi;l¼ ðai;l;di;lÞare the counts of ancestral and derived reads in individualiat sitel,gi;l2 f0;1;2gindicates the pos-sible genotype of individualiat sitel(i.e., 0 = homozygous ancestral, 1 = heterozygous, 2 = homozygous derived), and ℙðRi;ljgi;lÞis the probability of the read data at sitelfor indi-viduali, assuming that the individual truly has genotypegi;l: We use a binomial sampling with error model, in which the probability that a truly derived site appears ancestral (and vice versa) is given bye. We emphasize that the parameterewill capture both sequencing error as well as PMD [cf. Racimoet al. (2016), who found that adding an additional parameter to specifically model PMD does not improve inferences]. Thus,
ℙðRjgÞ ¼
aþd
d
pdgð12pgÞa
with
p0¼e
p1¼
1 2
p2¼12e
Combining these two aspects together by summing over possible allele frequencies weighted by their probabilities, we obtain our likelihood of the ancient data,
LðDÞ ¼Y
L
l¼1
Xn
k¼0
ℙðRljkÞpn;kðxlÞ: (3)
Data availability
The most recent Python implementations of the described meth-ods are available atwww.github.com/schraiber/continuity/. A snapshot of the code used as of the publication of the manuscript is available athttps://zenodo.org/record/1054127.
Results
Impact of coverage and number of samples on inferences
To explore the tradeoff of sequencing more individuals at lower depth compared to fewer individuals at higher cover-age, we performed simulations using msprime (Kelleheret al. 2016) combined with custom scripts to simulate error and low coverage data. Briefly, we assumed a Poisson distribution of reads at every site with mean given by the coverage, and then simulated reads by drawing from the binomial distribu-tion described in theMethods.
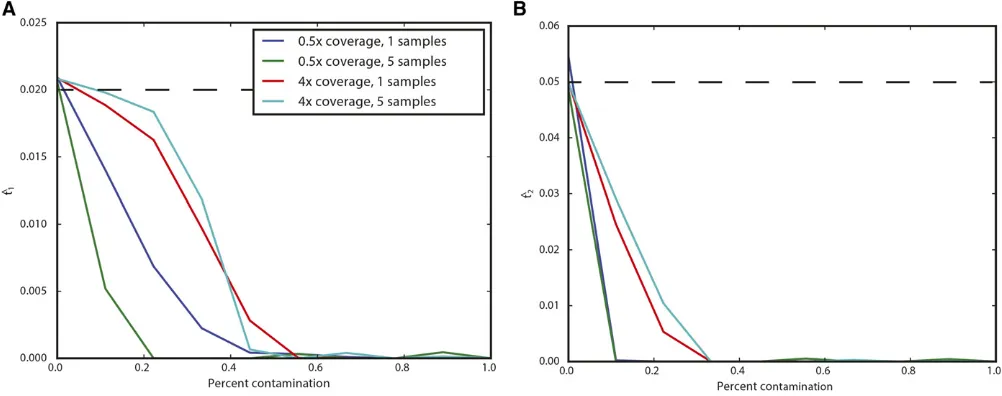
First, we examined the impact of coverage and number of samples on the ability to recover the drift times in the modern
and ancient populations. Figure 2 shows results for data sim-ulated with t1 ¼0:02 and t2 ¼0:05; corresponding to an ancient individual who died 300 generations ago from a pop-ulation of effective size 1000. The poppop-ulations split 400 gen-erations ago, and the modern population has an effective size
of 10,000. We simulated 180,000 SNPs by simulating
100,000 500-bp fragments. Inferences oft1can be relatively accurate even with only one low coverage ancient sample
(Figure 2A). However, inferences of t2 benefit much more from increasing the number of ancient samples, as opposed to coverage (Figure 2B). Supplemental Material, Table S1
shows that there is very little change in the average estimated parameter, indicating that most of the change in RMSE is due to decreased sampling variance. Thus, two individuals se-quenced to 0.53coverage have a much lower error than a single individual sequenced to 23 coverage, even though
Figure 2 Impact of sampling scheme on parameter estimation error. In each panel, thex-axis represents the number of simulated ancient samples, while they-axis shows the relative root mean square error for each parameter. Each different line corresponds to individuals sequenced to different depth of coverage. (A) shows results fort1while (B) shows results fort2:Simulated parameters aret1¼0:02 andt2¼0:05:
there is very little bias in either case. To explore this effect further, we derived the sampling probability of alleles cov-ered by exactly one sequencing read (see Appendix). We found that sites covered only once have no information about t2;suggesting that evidence of heterozygosity is very impor-tant for inferences about t2: Finally, though we showed through simulation that there is sufficient power to disentan-glet1 fromt2;estimates of these parameters are negatively correlated, due to the necessity offitting the total drift time
t1þt2(Figure S1; all supplementary legends can be found in
File S1).
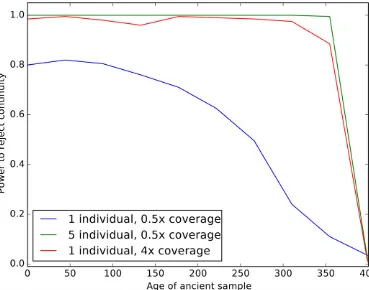
We next examined the impact of coverage and sampling on the power to reject the hypothesis that the ancient individuals came from a population that is directly ancestral to the modern population. We analyzed both low coverage (0.53) and higher coverage (43) datasets consisting of one (for both low and high coverage samples) or five individuals (only for low coverage). We simulated data with parameters iden-tical to the previous experiment, except we now examined the impact of varying the age of the ancient sample from 0 generations ago through to the split time with the modern population. We then performed a likelihood ratio test com-paring the null model of continuity, in which t2¼0; to a model in which the ancient population is not continuous. Figure 3 shows the power of the likelihood ratio test. For a single individual sequenced to low coverage, we see that the test only has power for very recently sampled ancient indi-viduals (i.e., samples that are highly diverged from the mod-ern population). However, the power increases dramatically as the number of individuals or the coverage per individual is increased; sequencing five individuals to 0.53 coverage results in essentially perfect power to reject continuity. None-theless, for samples that are very close to the divergence time, it will be difficult to determine if they are ancestral
to the modern population or not, because differentiation is incomplete.
Impact of admixture
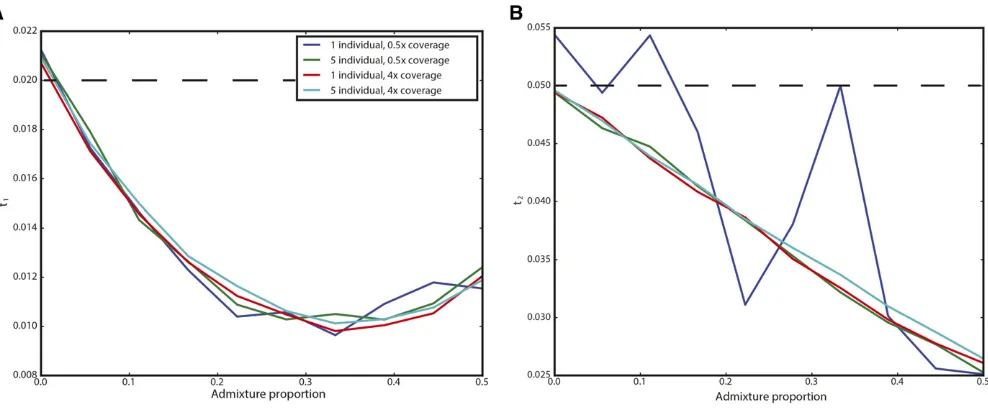
We examined two possible ways that admixture can result in violations of the model to assess their impact on inference. In many situations, there may have been secondary contact between the population from which the ancient sample is derived and the modern population used as a reference. We performed simulations of this situation by modifying the simulation corresponding to Figure 2 (300-generation-old ancient sample from population of size 1000 split from a population of size 10,000 400 generations ago) to include subsequent admixture from the ancient population to the modern population 200 generations ago (NB: this admixture occurredmore recentlythan the ancient sample). In Figure 4, we show the results for admixture proportions ranging from 0 to 50%:Counterintuitively, estimates oft1initiallydecrease before again increasing. This is likely a result of the increased heterozygosity caused by admixture, which acts to artificially inflate the effective size of the modern population, and, thus, decrease t1:As expected,t2 is estimated to be smaller the more admixture there is; indeed, for an admixture rate of 100%; the modern and ancient samples are continuous. The impact on t2 appears to be linear, and is well approxi-mated byð12fÞt2if the admixture fraction isf.
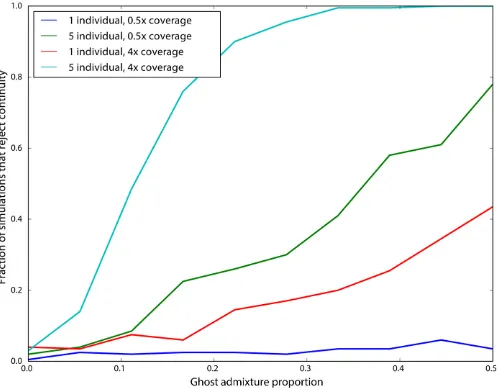
In other situations, there may be admixture from an unsampled“ghost”population into the modern population. If the ghost admixture is of a high enough proportion, it is likely to cause a sample that is, in fact, a member of a directly ancestral population to appear not to be ancestral. We ex-plored this situation by augmenting our simulations in which the ancient sample is continuous with an outgroup popula-tion diverged from the modern populapopula-tion 0.04 time units
ago (corresponding to 800 generations ago), and contributed genes to the modern population 0.01 time units ago (corre-sponding to 200 generations ago). We then assessed the im-pact on rejecting continuity using the likelihood ratio test (Figure 5). As expected, we see that low-power sampling strategies (such as a single individual sequenced to low cov-erage) are very minimally impacted by ghost admixture. However, for more powerful sampling strategies, moder-ate rmoder-ates of ghost admixture (10%) result in rejection of continuity.
Impact of contamination
We also explored the impact of foreign DNA contamination on inferences made using this approach. Briefly, we modified the simulations to include a chance c of a read being from a modern sample instead of the ancient sample when simulat-ing reads. We again simulated data correspondsimulat-ing to Figure 2, with a 300-generation-old ancient sample from population of size 1000 split from a population of size 10,000 400 gen-erations ago. In Figure 6, we see that relatively modest
amounts of contamination can result in estimating zero, or near-zero, drift times. Interestingly, for the same contamina-tion fraccontamina-tion, higher coverage samples are impacted slightly less. Together, this suggests that contamination will result in samples to be falsely inferred to be directly continuous with the modern population.
Application to ancient humans
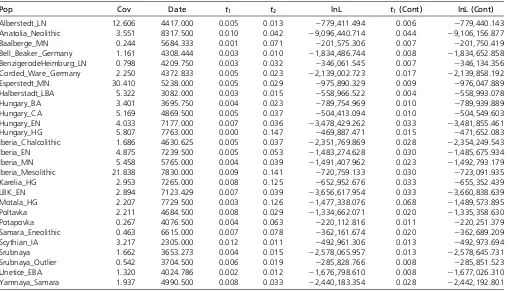
We applied our approach to ancient human data from Mathieson et al.(2015), which is primarily derived from a SNP capture approach that targeted 1.2 million SNPs. Based on sampling location and associated archeological materials, the individuals were grouped intoa prioripanels, which we used to specify population membership when analyzing indi-viduals together. We analyzed all samples for their relation-ship to the CEU individuals from the 1000 Genomes Project Consortium (2015). Based on our results, which suggested that extremely low coverage samples would yield unreliable estimates, we excluded panels that are composed of only a single individual sequenced to,23coverage.
We computed maximum likelihood estimates oft1andt2 for individuals as grouped into populations (Figure 7A and Table 1). We observe thatt2is significantly greater than zero for all populations according to the likelihood ratio test. Thus, none of these populations are consistent with directly making up a large proportion of the ancestry of modern CEU individuals. Strikingly, we see that t2t1;despite the fact these samples died in the past, and thus they belonged to a lineage that must have existed for fewer generations since the population split than the modern samples. This suggests that all of the ancient populations are characterized by extremely small effective population sizes.
We further explored the relationship between the dates of the ancient samples and the parameters of the model by plottingt1andt2against the mean sample date of all samples in that population (Figure 7, B and C). We expected tofind thatt1correlated with sample age, under the assumption that samples were members of relatively short-lived populations that diverged from the“main-stem”of CEU ancestry. Instead, we see no correlation betweent1and sample time, suggesting that the relationship of these populations to the CEU is com-plicated, and not summarized well by the age of the samples. On the other hand, we see a strong positive correlation be-tweent2 and sampling time (P,131024). Becauset2 is a compound parameter, it is difficult to directly interpret this relationship. However, it is consistent with the most ancient samples belonging to populations with the smallest effective sizes, consistent with previous observations (Skoglundet al. 2014).
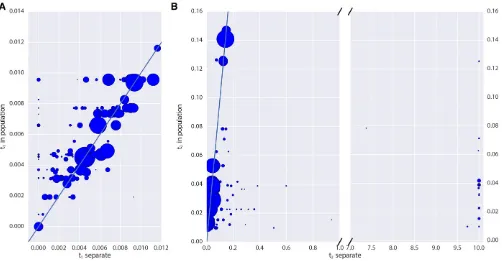
Finally, we examined the impact of grouping individuals into populations in real data. We see that estimates oft1 for low coverage samples are typically lower when analyzed in-dividually than when pooled with other individuals of the same panel (Figure 8A); becauseTable S1shows that there is no downward bias int1for low coverage, this suggests that
there may be some heterogeneity in these panels. On the other hand, there is substantial bias toward overestimating t2when analyzing samples individually, particularly for very low coverage samples (Figure 8B). This again shows that, for estimates that rely on heterozygosity in ancient populations, pooling many low coverage individuals can significantly im-prove estimates.
Discussion
aDNA presents unique opportunities to enhance our under-standing of demography and selection in recent history. How-ever, it also comes equipped with several challenges, due to DNA PMD (Sawyeret al.2012). Several strategies have been developed to deal with the low quality of aDNA data, from relatively simple options like sampling a read at random at every site (Greenet al.2010) to more complicated methods making use of genotype likelihoods (Racimo et al. 2016). Here, we presented a novel maximum likelihood approach for making inferences about how ancient populations are re-lated to modern populations by analyzing read counts from multiple ancient individuals, and explicitly modeling rela-tionship between the two populations. We explicitly condi-tion on the allele frequency in a modern populacondi-tion; as we show in the Appendix, this renders our method robust to ascertainment in modern samples. Thus, it can be used with SNP capture data. Moreover, confidence intervals can be cal-culated using a nonparametric bootstrap, although this will be computational intensive for large ancient panels, such as those considered in this manuscript. Using this approach, we examined some aspects of sampling strategy for aDNA anal-ysis, and we applied our approach to ancient humans.
We found that sequencing many individuals from an an-cient population to low coverage (0.5–13) can be a signifi-cantly more cost-effective strategy than sequencing fewer
individuals to relatively high coverage. For instance, we saw from simulations that far more accurate estimates of the drift time in an ancient population can be obtained by pooling two
individuals at 0.53coverage than by sequencing a single in-dividual to 23coverage (Figure 2). We saw this replicated in our analysis of the real data: low coverage individuals
showed a significant amount of variation and bias in estimat-ing the model parameters that was substantially reduced when individuals were analyzed jointly in a population (Fig-ure 8). To explore this further, we showed that sites se-quenced to 13 coverage in a single individual retain no information about the drift time in the ancient population. This can be intuitively understood because the drift time in the ancient population is strongly related the amount of het-erozygosity in the ancient population: an ancient population with a longer drift time will have lower heterozygosity at sites shared with a modern population. When a site is only se-quenced once in a single individual, there is no information about the heterozygosity of that site. We also observed a pro-nounced upward bias in estimates of the drift time in the ancient population from low coverage samples. We speculate that this is due to the presence of few sites covered more than once being likely to be homozygous, thus deflating the esti-mate of heterozygosity in the ancient population. Thus, for analysis of SNP data, we recommend that aDNA sampling be conduced to maximize the number of individuals from each ancient population that can be sequenced to 13, rather than attempting to sequence fewer individuals to high cov-erage. This suggestion can be complicated when samples have vastly different levels of endogenous DNA, where it may be cost effective to sequence high quality samples to higher coverage. In that case, we recommend sequencing samples to at least 3–43coverage; as evidenced by Figure
2 and Figure 3, single samples at ,43 coverage provide extremely limited information about the drift time in the an-cient population, and, thus, little power to reject continuity.
When we looked at the impact of model misspecification, we saw several important patterns. First, the influence of admixture from the ancient population on inferences of t2 is approximately linear, suggesting that if there are estimates of the amount of admixture between the modern and ancient population, a bias-corrected estimate oft2could be produced (Figure 4B). The impact on inference oft1 is more compli-cated: admixture actuallyreducesestimates oft1(Figure 4A). This is likely because admixture increases the heterozygosity in the modern population, thus causing the amount of drift time to seem reduced. In both cases, the bias is not impacted by details of sampling strategy, although the variance of es-timates is highly in a way consistent with Figure 2.
Of particular interest in many studies of ancient popula-tions is the question of direct ancestry: are the ancient samples members of a population that contributed substantially to a modern population? We emphasize that this does not mean that the particular samples were direct ancestors of any modern individuals; indeed, this is exceedingly unlikely for old samples (Donnelly 1983; Chang 1999; Bairdet al.2003; Rohdeet al.2004). Instead, we are asking whether an ancient sample was a member of a population that is directly contin-uous with a modern population. Several methods have been proposed to test this question, but thus far they have been
Table 1 Details of populations included in analysis
Pop Cov Date t1 t2 lnL t1(Cont) lnL (Cont)
Alberstedt_LN 12.606 4417.000 0.005 0.013 2779,411.494 0.006 2779,440.143
Anatolia_Neolithic 3.551 8317.500 0.010 0.042 29,096,440.714 0.044 29,106,156.877
Baalberge_MN 0.244 5684.333 0.001 0.071 2201,575.306 0.007 2201,750.419
Bell_Beaker_Germany 1.161 4308.444 0.003 0.010 21,834,486.744 0.008 21,834,652.858 BenzigerodeHeimburg_LN 0.798 4209.750 0.003 0.032 2346,061.545 0.007 2346,134.356 Corded_Ware_Germany 2.250 4372.833 0.005 0.023 22,139,002.723 0.017 22,139,858.192
Esperstedt_MN 30.410 5238.000 0.005 0.029 2975,890.329 0.009 2976,047.889
Halberstadt_LBA 5.322 3082.000 0.003 0.015 2558,966.522 0.004 2558,993.078
Hungary_BA 3.401 3695.750 0.004 0.023 2789,754.969 0.010 2789,939.889
Hungary_CA 5.169 4869.500 0.005 0.037 2504,413.094 0.010 2504,549.603
Hungary_EN 4.033 7177.000 0.007 0.036 23,478,429.262 0.033 23,481,855.461
Hungary_HG 5.807 7763.000 0.000 0.147 2469,887.471 0.015 2471,652.083
Iberia_Chalcolithic 1.686 4630.625 0.005 0.037 22,351,769.869 0.028 22,354,249.543
Iberia_EN 4.875 7239.500 0.005 0.053 21,483,274.628 0.030 21,485,675.934
Iberia_MN 5.458 5765.000 0.004 0.039 21,491,407.962 0.023 21,492,793.179
Iberia_Mesolithic 21.838 7830.000 0.009 0.141 2720,759.133 0.030 2723,091.935
Karelia_HG 2.953 7265.000 0.008 0.125 2652,952.676 0.033 2655,352.439
LBK_EN 2.894 7123.429 0.007 0.039 23,656,617.954 0.033 23,660,838.639
Motala_HG 2.207 7729.500 0.003 0.126 21,477,338.076 0.068 21,489,573.895
Poltavka 2.211 4684.500 0.008 0.029 21,334,662.071 0.020 21,335,358.630
Potapovka 0.267 4076.500 0.004 0.063 2220,112.816 0.011 2220,251.379
Samara_Eneolithic 0.463 6615.000 0.007 0.078 2362,161.674 0.020 2362,689.209
Scythian_IA 3.217 2305.000 0.012 0.011 2492,961.306 0.013 2492,973.694
Srubnaya 1.662 3653.273 0.004 0.015 22,578,065.957 0.013 22,578,645.731
Srubnaya_Outlier 0.542 3704.500 0.006 0.019 2285,828.766 0.008 2285,851.523
Unetice_EBA 1.320 4024.786 0.002 0.012 21,676,798.610 0.008 21,677,026.310
Yamnaya_Samara 1.937 4990.500 0.008 0.033 22,440,183.354 0.028 22,442,192.801
Pop, population name; cov, mean coverage of individuals in the population; date, mean date of individuals in the population;t1;maximum likelihood estimate oft1in the full
model;t2;maximum likelihood estimate oft2in the full model; LnL, maximum likelihood value in the full model;t1(cont), maximum likelihood estimate oft1in the model
limited to many individuals sequenced at a single locus (Sjödinet al.2014) or to a single individual with genome-wide data (Rasmussenet al.2014). Our approach provides a rigorous, maximum-likelihood framework for testing ques-tions of population continuity using multiple low coverage ancient samples. We saw from simulations (Figure 3) that data from single, low coverage individuals result in very little power to reject the null hypothesis of continuity unless the ancient sample is very recent (i.e., it has been diverged from the modern population for a long time). Nonetheless, when low coverage individuals are pooled together, or a single high coverage individual is used, there is substantial power to re-ject continuity for all but the most ancient samples (i.e., sam-ples dating from very near the population split time).
Because many modern populations may have experienced admixture from unsampled“ghost”populations, we also per-formed simulations to test the impact of ghost admixture on the probability of falsely rejecting continuity. We find that single ancient samples do not provide sufficient power to re-ject continuity, even for high levels of ghost admixture, while increasingly powerful sampling schemes, adding more indi-viduals or higher coverage per individual, reject continuity at higher rates. However, in these situations, whether we regard rejection of continuity as a false or true discovery is some-what subjective: how much admixture from an outside pop-ulation is required before considering a poppop-ulation to not be directly ancestral? In future work it will be extremely impor-tant to estimate the“maximum contribution”of the popula-tion an ancient sample comes from (cf. Sjödinet al.2014).
To gain new insights from empirical data, we applied our approach to ancient samples throughout Europe. Notably, we rejected continuity for all populations that we analyzed. This is unsurprising, given that European history is extremely com-plicated, and has been shaped by many periods of admixture (Lazaridiset al.2014, 2016; Haaket al.2015). Thus, modern Europeans have experienced many periods of“ghost” admix-ture (relative to any particular ancient sample). Nonetheless, our results show that none of these populations are even particularly close to directly ancestral, as our simulations have shown that rejection of continuity will not occur with low levels of ghost admixture.
Second, we observed that the drift time in the ancient population was much larger than the drift time in the modern population. Assuming that the ancient sample were a con-temporary sample, the ratiot1=t2is an estimator of the ratio Neð2Þ=Neð1Þ; in fact, because the ancient sample existed for fewer generations since the common ancestor of the ancient and modern populations, t1=t2 acts as an upper bound on Neð2Þ=Neð1Þ:Moreover, this is unlikely to be due to unmodeled error in the ancient samples: error would be expected in-crease the heterozygosity in the ancient sample, and thus decreaseour estimates oft2:Another potential complication is the fact that modern Europeans are a mixture of multiple ancestral populations (Lazaridis et al. 2014; Haak et al. 2015). As shown through simulation, admixture increases heterozygosity in the modern population and thus de-creases estimates oft1:However, even very large amounts of ghost admixture did not result in the order-of-magnitude
Figure 8 Impact of pooling individuals into populations when estimating model parameters from real data. In both panels, thex-axis indicates the parameter estimate when individuals are analyzed separately, while they-axis indicates the parameter estimate when individuals are grouped into populations. Size of points is proportional to the coverage of each individual. (A) reports the impact on estimation oft1;while (B) reports the impact on
differences we see in the real data, suggesting that ghost admixture cannot account for all the discrepancy between modern and ancient Ne: Thus, we find strong support for the observation that ancient Europeans were often members of small, isolated populations (Skoglund et al. 2014). We interpret these two results together as suggestive that many ancient samples found thus far in Europe were members of small populations that ultimately went locally extinct. None-theless, there may be many samples that belonged to larger metapopulations, and further work is necessary to specifi-cally examine those cases.
We further examined the effective sizes of ancient popu-lations through time by looking for a correlation between the age of the ancient populations and the drift time leading to them (Figure 7C). We saw a strong positive correlation, and, although this drift time is a compound parameter, which complicates interpretations, it appears that the oldest Euro-peans were members of the smallest populations, and that effective population size has grown through time as agricul-ture spread through Europe.
We anticipate the further development of methods that explicitly account for differential drift times in ancient and modern samples will become important as aDNA research becomes even more integrated into population genomics. This is because many common summary methods, such as the use of Structure (Pritchard et al. 2000) and Admixture (Alexanderet al.2009), are sensitive to differential amounts of drift between populations (Falushet al.2016). As we have shown in ancient Europeans, ancient samples tend to come from isolated subpopulations with a large amount of drift, thus confounding such summary approaches. Moreover, stan-dard population genetics theory shows that allele frequencies are expected to be deterministically lower in ancient samples, even if they are direct ancestors of a modern population. In-tuitively, this arises because the alleles must have arisen at some point from new mutations, and thus were at lower frequencies in the past. A potentially fruitful avenue to com-bine these approaches moving forward may be to separate regions of the genome based on ancestry components, and assess the ancestry of ancient samples relative to specific ancestry components, rather than to genomes as a whole.
Our current approach leaves several avenues for improve-ment. We use a relatively simple error model that wraps up both PMD and sequencing error into a single parameter. While Racimoet al.(2016) shows that adding an additional param-eter for PMD-related error does not significantly change re-sults, the recent work of Kousathanaset al.(2017) shows that building robust error models is challenging and essential to estimating heterozygosity properly. Although our method is robust to nonconstant demography because we consider only alleles that are segregating in both the modern and the an-cient population, we are losing information by not modeling new mutations that arise in the ancient population. Similarly, we only consider a single ancient population at a time, albeit with multiple samples. Ideally, ancient samples would be embedded in complex demographic models that include
ad-mixture, detailing their relationships to each other and to modern populations (Pattersonet al.2012; Lipson and Reich 2017). However, inference of such complex models is diffi-cult, and, though there has been some progress in simplified cases (Pickrell and Pritchard 2012; Lipson et al.2014), it remains an open problem due to the difficult of simulta-neously inferring a nontree-like topology along with demo-graphic parameters. Software such as momi (Kamm et al. 2017), which can compute the likelihood of SNP data in an admixture graph, may be able to be used to integrate over genotype uncertainty in larger settings than considered here.
Acknowledgments
We wish to thank Melinda Yang, Iain Mathieson, Pontus Skoglund, and Fernando Racimo for several discussions during the conception of this work that greatly improved its scope and rigor. We are grateful to Fernando Racimo and Benjamin Vernot for comments on early versions of this work that significantly improved its quality. We also appreciate comments on the preprint from Alex Kim and Aylwyn Scally. We would also like to thank Tamara Broderick for several stimulating discussions about clustering that ultimately did not result in any interesting application to ancient DNA (aDNA). This work was supported by NIH grant R35 GM124745.
Literature Cited
Alexander, , H. D., J. Novembre, and K. Lange, 2009 Fast model-based estimation of ancestry in unrelated individuals. Genome Res. 19: 1655–1664.
Allentoft, M. E., M. Sikora, K. G. Sjögren, S. Rasmussen, M. Rasmussenet al., 2015 Population genomics of bronze age Eurasia. Nature 522: 167–172.
Baird, S. J. E., N. H. Barton, and A. M. Etheridge, 2003 The distribution of surviving blocks of an ancestral genome. Theor. Popul. Biol. 64: 451–471.
Chang, J. T., 1999 Recent common ancestors of all present-day individuals. Adv. Appl. Probab. 31: 1002–1026.
Dabney, J., M. Meyer, and S. Pääbo, 2013 Ancient DNA damage. Cold Spring Harb. Perspect. Biol. 5: a012567.
Donnelly, , and . P. K, 1983 The probability that related individ-uals share some section of genome identical by descent. Theor. Popul. Biol. 23: 34–63.
Ewens, W. J., 2012 Mathematical Population Genetics 1: Theoret-ical Introduction, Vol. 27. Springer Science & Business Media, Berlin.
Falush, D., L. van Dorp, and D. Lawson, 2016 A tutorial on how (not) to over-interpret structure/admixture bar plots. bioRxiv doi:https://doi.org/10.1101/066431.
Fu, Q., C. Posth, M. Hajdinjak, M. Petr, S. Mallicket al., 2016 The genetic history of ice age Europe. Nature 534: 200–205. 1000 Genomes Project Consortium, 2015 A global reference for
human genetic variation. Nature 526: 68–74.
Green, R. E., J. Krause, A. W. Briggs, T. Maricic, U. Stenzelet al., 2010 A draft sequence of the Neandertal genome. Science 328: 710–722.
Haak, W., I. Lazaridis, N. Patterson, N. Rohland, S. Mallicket al., 2015 Massive migration from the steppe was a source for Indo-European languages in Europe. Nature 522: 207–211. Jewett, E. M., M. Steinrücken, and Y. S. Song, 2016 The effects of
population size histories on estimates of selection coefficients from time-series genetic data. Mol. Biol. Evol. 33: 3002–3027. Jónsson, H., A. Ginolhac, M. Schubert, P. L. Johnson, and L. Orlando,
2013 mapdamage2.0: fast approximate Bayesian estimates of ancient DNA damage parameters. Bioinformatics 29: 1682–1684.
Kamm, J. A., J. Terhorst, and Y. S. Song, 2017 Efficient compu-tation of the joint sample frequency spectra for multiple popu-lations. J. Comput. Graph. Stat. 26:182–194.
Karlin, S., and H. E. Taylor, 1981 A Second Course in Stochastic Processes. Elsevier, Amsterdam.
Kelleher, J., A. M. Etheridge, and G. McVean, 2016 Efficient co-alescent simulation and genealogical analysis for large sample sizes. PLOS Comput. Biol. 12: e1004842.
Korneliussen, T. S., A. Albrechtsen, and R. Nielsen, 2014 ANGSD: analysis of next generation sequencing data. BMC Bioinfor-matics 15: 356.
Kousathanas, A., C. Leuenberger, V. Link, C. Sell, J. Burgeret al., 2017 Inferring heterozygosity from ancient and low coverage genomes. Genetics 205: 317–332.
Lazaridis, I., N. Patterson, A. Mittnik, G. Renaud, S. Mallicket al., 2014 Ancient human genomes suggest three ancestral popu-lations for present-day Europeans. Nature 513: 409–413. Lazaridis, I., D. Nadel, G. Rollefson, D C. Merrett, N. Rohlandet al.,
2016 Genomic insights into the origin of farming in the an-cient near east. Nature 536: 419–424.
Lipson, M., and D. Reich, 2017 A working model of the deep relationships of diverse modern human genetic lineages outside of Africa. Mol. Biol. Evol. 34: 889–902.
Lipson, M., P.-R. Loh, N. Patterson, P. Moorjani, Y.-C. Ko et al., 2014 Reconstructing Austronesian population history in island Southeast Asia. Nat. Commun. 5: 4689.
Mathieson, I., I. Lazaridis, N. Rohland, S. Mallick, N. Patterson
et al., 2015 Genome-wide patterns of selection in 230 ancient Eurasians. Nature 528: 499–503.
Meyer, M., M. Kircher, M. T. Gansauge, H. Li, F. Racimo et al., 2012 A high-coverage genome sequence from an archaic De-nisovan individual. Science 338: 222–226.
Nielsen, R., and J. Signorovitch, 2003 Correcting for ascertainment biases when analyzing SNP data: applications to the estimation of linkage disequilibrium. Theor. Popul. Biol. 63: 245–255.
Nielsen, R., T. Korneliussen, A. Albrechtsen, Y. Li, and J. Wang, 2012 SNP calling, genotype calling, and sample allele fre-quency estimation from new-generation sequencing data. PLoS One 7: e37558.
Patterson, N., P. Moorjani, Y. Luo, S. Mallick, N. Rohland et al., 2012 Ancient admixture in human history. Genetics 192: 1065– 1093.
Peter, B. M., 2016 Admixture, population structure, and F-statistics. Genetics 202: 1485–1501.
Pickrell, J. K., and J. K. Pritchard, 2012 Inference of population splits and mixtures from genome-wide allele frequency data. PLoS Genet. 8: e1002967.
Pinhasi, R., D. Fernandes, K. Sirak, M. Novak, S. Connell et al., 2015 Optimal ancient DNA yields from the inner ear part of the human petrous bone. PLoS One 10: e0129102.
Pritchard, J. K., M. Stephens, and P. Donnelly, 2000 Inference of population structure using multilocus genotype data. Genetics 155: 945–959.
Racimo, F., G. Renaud, and M. Slatkin, 2016 Joint estimation of contamination, error and demography for nuclear DNA from ancient humans. PLoS Genet. 12: e1005972.
Rasmussen, M., S. L. Anzick, M. R. Waters, P. Skoglund, M. DeGiorgio
et al., 2014 The genome of a late Pleistocene human from a clovis burial site in western Montana. Nature 506: 225–229. Rohde, D. L., S. Olson, and J. T. Chang. 2004 Modelling the
re-cent common ancestry of all living humans. Nature 431: 562– 566.
Sawyer, S., J. Krause, K. Guschanski, V. Savolainen, and S. Pääbo, 2012 Temporal patterns of nucleotide misincorporations and DNA fragmentation in ancient DNA. PLoS One 7: e34131. Schraiber, J. G., S. N. Evans, and M. Slatkin. 2016 Bayesian
in-ference of natural selection from allele frequency time series. Genetics 203: 493–511.
Sjödin, P., P. Skoglund, and M. Jakobsson, 2014 Assessing the maximum contribution from ancient populations. Mol. Biol. Evol. 31: 1248–1260.
Skoglund, P., H. Malmström, M. Raghavan, J. Storå, P. Hallet al., 2012 Origins and genetic legacy of Neolithic farmers and hunter-gatherers in Europe. Science 336: 466–469.
Skoglund, P., H. Malmström, A. Omrak, M. Raghavan, C. Valdiosera
et al., 2014 Genomic diversity and admixture differs for stone-age Scandinavian foragers and farmers. Science 344: 747–750.
Appendix
Computing Allele Frequency Moments in the Ancient Population
We wish to compute moments of the form
Ex
gðYÞ;t1;t2
¼
Z 1
0
gðyÞfðy;x;t1;t2Þdy (4)
To do so, we make use of several results from diffusion theory. To ensure that this paper is self-contained, we briefly review those results here. The interested reader mayfind much of this material covered in Karlin and Taylor (1981) and Ewens (2012). Several similar calculations can be found in Griffiths (2003).
Let the probability of an allele going from frequencyxto frequencyyintgenerations in a population of sizeNebefðx;y;tÞ; wheret¼t=ð2NeÞ:Under a wide variety of models, the change in allele frequencies through time is well approximated by the Wright-Fisher diffusion, which is characterized by its generator,
L ¼1
2xð12xÞ d2 dx2:
The generator of a diffusion process is useful, because it can be used to define a differential equation for the moments of that process,
d dtEx
gðXtÞ
¼Ex
LgðXtÞ
: (5)
We will require thespeed measureof the Wright-Fisher diffusion,mðxÞ ¼x21ð12xÞ21;
which essentially describes how slow a diffusion at positionxis“moving”compared to a Brownian motion at positionx. Note that all diffusions are reversible with respect to their speed measures,i.e.
mðxÞfðx;y;tÞ ¼mðyÞfðy;x;tÞ:
We additionally require the probability of loss,i.e.the probability that the allele currently at frequencyxis ultimately lost from the population. This is
u0ðxÞ ¼12x:
Note that it is possible to condition the Wright-Fisher diffusion to eventually be lost. The transition density can be computed as
fYðx;y;tÞ ¼fðx;y;tÞu0ðyÞ u0ðxÞ
by using Bayes theorem. The diffusion conditioned on loss is characterized by its generator,
LY¼ 2x d dxþ
1
2xð12xÞ d2
dx2:
In an infinite sites model, in which mutations occur at the times of a Poisson process with rateu=2;and then each drift according to the Wright-Fisher diffusion, a quasi-equilibrium distribution will be reached, known as the frequency spectrum. The frequency spectrum, fðxÞ;predicts the number of sites at frequencyx, and can be written in terms of the speed measure and the probability of loss,
To proceed with calculating (4), note that the conditional probability of an allele being at frequencyyin the ancient population, given that it is at frequencyxin the modern population, can be calculated as
fðy;x;t1;t2Þ ¼
fðx;y;t1;t2Þ
fðxÞ
wherefðx;y;t1;t2Þis the joint probability of the allele frequencies in the modern and ancient populations, andfðxÞis the frequency spectrum in the modern population.
Assuming that the ancestral population of the modern and ancient samples was at equilibrium, the joint distribution of allele frequencies can be computed by sampling alleles from the frequency spectrum of the ancestor, and evolving them forward in time via the Wright-Fisher diffusion. This can be written mathematically as
fðx;y;t1;t2Þ ¼
Z 1
0
fðz;x;t1Þfðz;y;t2ÞfðzÞdz:
We now expand the frequency spectrum in terms of the speed measure and the probability of loss and use reversibility with respect to the speed measure to rewrite the equation,Z
1
0
fðz;x;t1Þfðz;y;t2ÞfðzÞdz¼u
Z 1
0
fðz;x;t1Þfðz;y;t2ÞmðzÞu0ðzÞdz
¼u
Z 1
0
mðxÞ
mðzÞfðx;z;t1Þfðz;y;t2ÞmðzÞu0ðzÞdz
¼umðxÞu0ðxÞ
Z 1
0
fðx;z;t1Þu0ðzÞ
u0ðxÞfðz;y;t2Þdz
¼fðxÞ
Z 1
0
fYðx;z;t1Þfðz;y;t2Þdz:
The third line follows by multiplying byu0ðxÞ=u0ðxÞ ¼1:This equation has the interpretation of sampling an allele from the frequency spectrum in the modern population, then evolving itbackwardin time to the common ancestor, before evolving it forwardin time to the ancient population. The interpretation of the diffusion conditioned on loss as evolving backward in time arises by considering the fact that alleles arose from unique mutations at some point in the past; hence, looking backward, alleles must eventually be lost at some point in the past.
To compute the expectation, we substitute this form for the joint probability into (4),
Z 1
0
gðyÞfðy;x;t1;t2Þdy¼
Z 1
0
gðyÞ
Z 1
0
fYðx;z;t1Þfðz;y;t2Þdz
!
dy
¼
Z 1
0
Z 1
0
gðyÞfðz;y;t2Þdy
!
fYðx;z;t1Þdz;
where the second line follows by rearranging terms and exchanging the order of integration. Note that this formula takes the form of nested expectations. Specifically,
Z 1
0
gðyÞfðz;y;t2Þdy¼EzðgðYt2ÞÞ
[hðzÞ
and Z
1
0
hðzÞfYðx;z;t1Þdz¼EYxðhðZt1ÞÞ
¼ExðgðYÞ;t1;t2Þ:
d dtpn;k¼
kðk21Þ
2 pn;k212kðn2kÞpn;kþ
ðn2kÞðn2k21Þ 2 pn;kþ1
and
d dtp
Y
n;k¼
kðk21Þ
2 p
Y
n;k212kðn2kþ1ÞpYn;kþ
ðn2kþ1Þðn2kÞ
2 p
Y
n;kþ1
with obvious boundary conditionspn;kð0;zÞ ¼zkð12zÞ n2k
andpYn;kð0;xÞ ¼xkð12xÞn2k :
These systems of differential equations can be rewritten as matrix differential equations with coefficient matricesQandQY respectively. Because they are linear,first order equations, they can be solved by matrix exponentiation. Because the expec-tation of a polynomial in the Wright-Fisher diffusion remains a polynomial, the nested expecexpec-tations can be computed via matrix multiplication of the solutions to these differential equations, yielding the formula (2).
Robustness to Ascertainment in the Modern Population
By conditioning on the allele frequency in the modern population, we gain the power to make inferences that are robust to ascertainment in the modern population. To see this, note from Equation 3 in Nielsen and Signorovitch (2003) that
fðxjAÞ ¼fðx;AÞ fðAÞ
whereAindicates the event that the allele was ascertained in the modern population. A simple generalization of this shows that
fðx;yjAÞ ¼fðx;y;AÞ fðAÞ :
So,
fðyjx;AÞ ¼fðx;yjAÞ fðxjAÞ
¼fðx;y;AÞ
fðx;AÞ
¼fðAjx;yÞfðx;yÞ
fðAjxÞfðxÞ
¼fðx;yÞ
fðxÞ
where thefinal line follows by recognizing thatfðAjx;yÞ ¼fðAjxÞsince the allele was ascertained in the modern population. Thus, we see that the ascertainment is removed by conditioning, and we recover the original formula. Note that the robustness to ascertainment is only exact if the allele is ascertained in the modern population, but is expected to be very close to true, so long as the allele is ascertained in a population closer to the modern population than to the ancient population.
Sites Covered Exactly Once Have no Information About Drift in the Ancient Population
Consider a simplified model in which each site has exactly one read. When we have sequence from only a single individual, we have a setlaof sites where the single read is an ancestral allele, and a setldof sites where the single read is a derived allele. Thus, we can rewrite (3) as
LðDÞ ¼Y
l2la
ð12eP2;0xlÞ þ
1
2P2;1ðxlÞ þeP2;2ðxlÞ
! Y
l2ld
eP2;0ðxlÞ þ
1
2P2;1ðxlÞ þ ð12eÞP2;2ðxlÞ
!
We can use formulas from Racimoet al.(2016) to computeP2;kðxlÞfork2 f0;1;2g;
P2;0ðxlÞ ¼12xle2t12
1 2xle
2ðt1þt2Þþx l
xl2
1 2
e2ð3t1þt2Þ
P2;1ðxlÞ ¼xle2ðt1þt2Þþxlð122xlÞe2ð3t1þt2Þ
P2;2ðxlÞ ¼xle2t12
1 2xle
2ðt1þt2Þþx l
xl2
1 2
e2ð3t12t2Þ:
Note then that
ð12eÞP2;0ðxlÞ þ
1
2P2;1ðxlÞ þeP2;2ðxlÞ ¼12e2xð122eÞe
2t1
and
eP2;0ðxlÞ þ
1
2P2;1ðxlÞ þ ð12eÞP2;2ðxlÞ ¼eþxð122eÞe
2t1: