University of Windsor University of Windsor
Scholarship at UWindsor
Scholarship at UWindsor
Electronic Theses and Dissertations Theses, Dissertations, and Major Papers
1-1-2006
Surface-enhanced Raman and resonance Raman scattering:
Surface-enhanced Raman and resonance Raman scattering:
Substrate development, interpretation, and single -molecule
Substrate development, interpretation, and single -molecule
detection.
detection.
Paul J. G. Goulet University of Windsor
Follow this and additional works at: https://scholar.uwindsor.ca/etd
Recommended Citation Recommended Citation
Goulet, Paul J. G., "Surface-enhanced Raman and resonance Raman scattering: Substrate development, interpretation, and single -molecule detection." (2006). Electronic Theses and Dissertations. 7228.
https://scholar.uwindsor.ca/etd/7228
SURFACE-ENHANCED RAMAN AND RESONANCE RAMAN SCATTERING: SUBSTRATE DEVELOPMENT, INTERPRETATION, AND SINGLE
MOLECULE DETECTION
BY
PAUL J. G. GOULET
A Dissertation
Submitted to the Faculty o f Graduate Studies and Research through Chemistry and Biochemistry
in Partial Fulfillment o f the Requirements for the Degree o f Doctor o f Philosophy at the University o f Windsor
Windsor, Ontario, Canada 2006
© 2006 Paul J. G. Goulet
1*1
Library and
Archives Canada
Published Heritage
Branch
395 W ellington Street Ottawa ON K 1 A 0N 4 Canada
Bibliotheque et
Archives Canada
Direction du
Patrimoine de I'edition
395, rue W ellington Ottawa ON K 1 A 0N 4 Canada
Your file Votre reference ISBN: 978-0-494-42389-9 Our file Notre reference ISBN: 978-0-494-42389-9
NOTICE:
The author has granted a non
exclusive license allowing Library
and Archives Canada to reproduce,
publish, archive, preserve, conserve,
communicate to the public by
telecommunication or on the Internet,
loan, distribute and sell theses
worldwide, for commercial or non
commercial purposes, in microform,
paper, electronic and/or any other
formats.
AVIS:
L'auteur a accorde une licence non exclusive
permettant a la Bibliotheque et Archives
Canada de reproduire, publier, archiver,
sauvegarder, conserver, transmettre au public
par telecommunication ou par I'lnternet, preter,
distribuer et vendre des theses partout dans
le monde, a des fins commerciales ou autres,
sur support microforme, papier, electronique
et/ou autres formats.
The author retains copyright
ownership and moral rights in
this thesis. Neither the thesis
nor substantial extracts from it
may be printed or otherwise
reproduced without the author's
permission.
L'auteur conserve la propriete du droit d'auteur
et des droits moraux qui protege cette these.
Ni la these ni des extraits substantiels de
celle-ci ne doivent etre imprimes ou autrement
reproduits sans son autorisation.
In compliance with the Canadian
Privacy Act some supporting
forms may have been removed
from this thesis.
While these forms may be included
in the document page count,
their removal does not represent
Conformement a la loi canadienne
sur la protection de la vie privee,
quelques formulaires secondaires
ont ete enleves de cette these.
ABSTRACT
In this work, the results o f several fundamental and applied studies employing surface-enhanced Raman scattering (SERS) and surface-enhanced resonance Raman scattering (SERRS) are presented.
First, the fabrication, characterization, and application o f several new substrates for SERS/SERRS are demonstrated. These SERS/SERRS substrates include mixed Ag/Au evaporated nanoparticle films; self-sustained, Au nanoparticle embedded chitosan films; dendrimer/Ag nanosphere LbL films; dendrimer/Ag nanowire LbL films; and avidin/Ag nanoparticle LbL films. They are characterized using a variety o f techniques including: UV-visible surface plasmon absorption spectroscopy, X-ray photoelectron spectroscopy, atomic force microscopy, transmission electron microscopy, and infrared absorption. They are shown to be excellent substrates for SERS/SERRS measurements, demonstrating significant enhancement capability and several other valuable characteristics.
Next, the SERS spectra o f the surface complexes o f salicylic acid and 1- naphthylamine on Ag are studied. Density functional theory (DFT) calculations and several vibrational spectroscopic techniques are employed to aid in the interpretation o f the SERS results. It is concluded that salicylate chemically adsorbs on Ag nanoparticles through its carboxylate group in a tilted, head-on orientation, while 1-NA on Ag forms a coordination complex that is highly sensitive to water solvation.
Finally, single-molecule SERS/SERRS from Langmuir-Blodgett monolayers on nanostructured metal films is discussed. Six molecular systems are studied at the single molecule level, using three nanostructured metal films, a variety o f laser excitation
iii
For Nicole.
ACKNOWLEDGEMENTS
First, I thank my research advisor, friend, and mentor, Ricardo Aroca. He has expanded my world several times over. His support, guidance, patience, and encouragement can never be repaid.
I also thank the many friends that I have been fortunate to work with in the Materials and Surface Science Group: Nik, David, Lalo, Teo, Case, Tibebe, Daniel, Igor, Mat, Salwen, Ben, Shazia, Eduardo, Aldo, Francisco, Ramon, Clavijo, Miguel-Angel, Domingo, Golam, Grace, Marta, and Alicia. I cannot begin to detail the ways in which they have enriched my life.
I also thank all o f my friends and family (and adopted families) for their love, support, and understanding in the face o f my too frequent inattention.
TABLE OF CONTENTS
ABSTRACT iii
DEDICATION v
ACKNOWLEDGEMENTS vi
LIST OF TABLES xi
LIST OF FIGURES xii
LIST OF ABBREVIATIONS xvi
CHAPTER
1. INTRODUCTION 1
1.1 Introduction 2
References 5
2. BACKGROUND 8
2.1 Introduction 9
2.2 Raman and Resonance Raman Scattering 9
2.3 Surface-Enhanced Raman and Resonance Raman Scattering 16
2.4 Surface-Enhanced Fluorescence (SEF) 21
2.5 Langmuir-Blodgett Monolayers 22
References 25
3. EXPERIMENTAL AND COMPUTATIONAL DETAILS 34
3.1 Samples 35
3.1.1 Reagents 35
3.1.2 Evaporated Metal Films 36
3.1.3 Colloidal Solutions o f Silver 37
3.1.4 Langmuir-Blodgett Monolayers 38
3.1.5 Gold Nanoparticle Embedded, Self-Sustained
Chitosan Films 41
3.1.6 Dendrimer/Ag Nanosphere Layer-by-Layer Films 42
3.1.7 Silver Nanowire Layer-by-Layer Films 43
3.1.8 Avidin/Ag Nanoparticle Layer-by-Layer Films 44
3.1.9 Salicylate-Silver Complex 45
3.1.10 l-Naphthylamine-Silver Complex 45
3.2 Characterization 46
3.2.1 UV-visible Absorption 46
3.2.2 Atomic Force Microscopy (AFM) 46
3.2.3 Transmission Electron Microscopy (TEM) 47
3.2.4 X-ray Photoelectron Spectroscopy (XPS) 48
v i i
3.2.5 Infrared Absorption (IR) 48
3.2.6 Raman Microscopy 49
3.2.7 Fluorescence Spectroscopy 52
3.2.8 Photon Correlation Spectroscopy 52
3.2.9 Scanning Electron Microscopy (SEM) 53
3.3 Computation 53
3.3.1 Salicylic Acid and Silver-Salicylate Complexes 53
3.3.2 1-Nap hthylamine 54
References 54
4. FABRICATION, CHARACTERIZATION, AND APPLICATION OF NEW SUBSTRATES FOR SURFACE-ENHANCED RAMAN
AND RESONANCE RAMAN SCATTERING 56
4.1 SERS/SERRS Substrate Development 57
4.2 Mixed Ag/Au Vacuum Evaporated Nanostructured Films 58
4.2.1 Introduction 58
4.2.2 Characterization o f Mixed Ag/Au Films 59
4.2.3 Resonance Raman Scattering of BBIP PTCD 61
4.2.4 Ensemble LB SERRS and SEF from Mixed Ag/Au Films 63 4.2.5 Single-Molecule LB SERRS from Mixed Ag/Au Films 64
4.2.6 Conclusions 66
4.3 Gold Nanoparticle Embedded, Self-Sustained Chitosan Films 67
4.3.1 Introduction 67
4.3.2 Characterization of Chitosan/Au Nanoparticle Films 70
4.3.3 SERS from Chitosan/Au Nanoparticle Films 74
4.3.4 Conclusions 75
4.4 Dendrimer/Ag Nanosphere Layer-by-Layer Films 76
4.4.1 Introduction 76
4.4.2 Characterization o f Dendrimer/Ag Nanosphere LbL Films 78
4.4.3 SERS from Dendrimer/Ag Nanosphere LbL Films 83
4.4.4 Conclusions 89
4.5 Dendrimer/Ag Nanowire Layer-by-Layer Films 89
4.5.1 Introduction 89
4.5.2 Characterization o f Dendrimer/Ag Nanowire LbL Films 91 4.5.3 SERS/SERRS from Dendrimer/Ag Nanowire LbL Films 94 4.5.4 LB SERS/SERRS from Dendrimer/Ag Nanowire
LbL Films 96
4.5.5 Conclusions 97
4.6 Avidin/Ag Nanoparticle Layer-by-Layer Films 98
4.6.1 Introduction 98
4.6.2 Characterization o f Avidin/Ag Nanoparticle LbL Films 100 4.6.3 SERS/SERRS from Avidin/Ag Nanoparticle LbL Films 103 4.6.4 Concentration Enhancement Through Chemical
Selectivity 106
4.7 Summary References
110 111
5. INTERPRETATION OF SURFACE-ENHANCED RAMAN SCATTERING: TWO CASE STUDIES OF UNUSUAL
COMPLEXITY 119
5.1 Interpretation of the SERS o f Surface Complexes 120
5.2 Chemical Adsorption o f Salicylate on Silver 122
5.2.1 Introduction 122
5.2.2 Structures of Salicylic Acid and Silver-Salicylate
Complexes 124
5.2.3 Vibrational Spectra of Salicylic Acid 127
5.2.4 SERS, SEIRA, and RAIRS 131
5.2.5 Conclusion 142
5.3 SERS o f the Environmental Pollutant 1-Naphthylamine 143
5.3.1 Introduction 143
5.3.2 Raman Spectrum of 1-Naphthylamine 146
5.3.3 Effect of pH on SERS Enhancement 149
5.3.4 SERS of 1-Naphthylamine 151
5.3.5 Raman and SERS o f the Ag Complex o f 1-Naphthylamine 153
5.3.6 Conclusion 156
5.4 Summary 157
References 157
6. SINGLE-MOLECULE SERS/SERRS FROM
LANGMUIR-BLODGETT MONOLAYERS ON NANOSTRUCTURED METALLIC
FILMS 162
6.1 Single-Molecule SERS/SERRS from Langmuir-Blodgett
Monolayers 163
6.2 Overtones and Combinations in the Single-Molecule SERRS
o f Perylenes 165
6.2.1 Introduction 165
6.2.2 Characterization o f Nanostructured Ag Film Substrate 167
6.2.3 Electronic Absorption 169
6.2.4 Ensemble SERRS 170
6.2.5 Single-Molecule SERRS 173
6.2.6 Conclusion 178
6.3 Mapping Single-Molecule SERRS from Langmuir-Blodgett
Monolayers 178
6.3.1 Introduction 178
6.3.2 Absorption and Fluorescence 179
6.3.3 RRS and SERRS from Langmuir-Blodgett Monolayers 182 6.3.4 Mapping SERRS Down to the Single-Molecule Level 184
6.3.6 Conclusion 189
i x
6.4 SERRS from One-to-One Binary Mixtures in
Langmuir-Blodgett Monolayers 190
6.4.1 Introduction 190
6.4.2 Absorption Spectroscopy and Atomic Force Microscopy 192
6.4.3 Ensemble SERRS 193
6.4.4 SERRS Mapping o f One-to-One Binary Mixtures in
LB Monolayers 195
6.4.5 Single-Molecule Spectral Variation 199
6.4.6 Conclusion 200
6.5 Non-Resonant SERS from Single Molecules in
Langmuir-Blodgett Monolayers 201
6.5.1 Introduction 201
6.5.2 Absorption Spectroscopy 202
6.5.3 Ensemble SERS/SERRS from Ag and Mixed
Ag/Au Nanoparticle Films 204
6.5.4 Single-Molecule SERS/SERRS M apping with
Changing Excitation Energy 206
6.5.5 Conclusion 209
6.6 Summary 209
References 209
7. CONCLUSIONS 214
7.1 Conclusions 215
7.2 Future Directions 220
VITA AUCTORIS 221
PUBLICATIONS 222
LIST OF TABLES
Table 5.1 Selected geometrical parameters for salicylic acid, A g l,
and Ag2 complexes. 126
Table 5.2. Calculated and observed infrared and Raman frequencies with corresponding symmetries, infrared intensities
(in km/mole), Raman activities (in A4/amu), and assignments
for the fundamental vibrational modes o f salicylic acid. 130
Table 5.3. Calculated frequencies, symmetries, Raman activities
(in A4/amu), infrared intensities (in km/mole), and assignments for the fundamental vibrational modes o f the A g l complex. Also shown are the corresponding experimental Raman and
infrared frequencies for the Ag salt, SERS, and SEIRA samples. 133
Table 5.4. Calculated frequencies, symmetries, Raman activities
(in A4/amu), infrared intensities (in km/mole), and assignments
for the fundamental vibrational modes of the Ag2 complex. 137
Table 5.5. Some observed and calculated (B3LYP 6-311G(d,p))
fundamental Raman modes of 1-naphthylamine and its silver
complex. 149
R e p r o d u c e d with p e r m i s s i o n o f t h e co p y r ig h t o w n e r . F u r t h e r r e p r o d u c t i o n p ro h ib ite d w ith o u t p e r m i s s i o n .
LIST OF FIGURES
Figure 2.1 Rayleigh and Raman scattering processes. 11
Figure 2.2 Scattering spectrum o f a hypothetical molecule. 12
Figure 2.3 Resonance Rayleigh and Raman scattering. 16
Figure 2.4 Depiction o f Langmuir-Blodgett film transfer to solid substrate. 23
Figure 3.1 Vacuum evaporation system. 37
Figure 3.2 Lauda Langmuir film balance. 39
Figure 3.3 Cary 50 UV-visible spectrometer. 46
Figure 3.4 Digital Instruments NanoScope IV. 47
Figure 3.5 Bruker Equinox 55 Fourier transform infrared (FTIR)
spectrometer. 49
Figure 3.6 Renishaw 2000 micro-Raman system. 51
Figure 3.7 Renishaw InVia micro-Raman system. 51
Figure 3.8 Renishaw 90° macro-sampling attachment and sample holder. 52
Figure 4.1 Surface plasmon absorption o f 10 nm mixed Ag/Au film. 60
Figure 4.2 AFM image o f 10 nm mixed Ag/Au film. 61
Figure 4.3 BBIP PTCD resonance Raman Scattering. 62
Figure 4.4 Ensemble LB SERRS o f BBIP PTCD on mixed Ag/Au film. 64
Figure 4.5 Single-Molecule LB SERRS from Mixed Ag/Au Films. 66
Figure 4.6 Structure of chitosan. 68
Figure 4.7 Photograph o f various Au nanoparticle embedded chitosan films. 71
Figure 4.8 Surface plasmon absorption o f chitosan/Au nanoparticle mixtures. 72
Figure 4.9 TEM images and electron diffraction o f chitosan/Au
Figure 4.10 1R absorption o f pure and Au nanoparticle embedded
chitosan films. 74
Figure 4.11 SERS from Chitosan/Au Nanoparticle Films. 75
Figure 4.12 UV-visible absorption o f dendrimer/Ag nanosphere LbL films. 79
Figure 4.13 AFM images of dendrimer/Ag nanosphere LbL films. 82
Figure 4.14 SERS from G5 DAB-Am/Ag nanoparticle LbL films. 84
Figure 4.15 SERS from G1 DAB-Am/Ag nanoparticle LbL films. 86
Figure 4.16 SERS from LbL films with intervening layers. 88
Figure 4.17 Surface plasmon absorption o f dendrimer/Ag nanowire film. 92
Figure 4.18 AFM images of a G5 DAB-Am/Ag nanowire LbL film. 93
Figure 4.19 SERRS o f R6G on G5 DAB-Am/Ag nanowire LbL film. 95
Figure 4.20 Broad enhancement region o f G5 DAB-Am/Ag nanowire LbL film. 96
Figure 4.21 LB SERS/SERRS from Dendrimer/Ag Nanowire LbL Films. 97
Figure 4.22 Chemically selective adsorption on avidin/Ag nanoparticle
LbL films. 99
Figure 4.23 Surface plasmon absorption o f avidin/Ag nanoparticle LbL films. 101
Figure 4.24 AFM images o f avidin/Ag nanoparticle LbL films. 103
Figure 4.25 SERRS intensity increase with avidin/Ag nanoparticle film
growth. 104
Figure 4.26 Broad enhancement region o f avidin/Ag nanoparticle films. 106
Figure 4.27 Chemical Selective SERRS from avidin/Ag nanoparticle LbL
films. 108
Figure 5.1 Optimized structures o f salicylic acid, A g l, and Ag2. 125
Figure 5.2 Vibrational Spectra o f Salicylic Acid. 129
Figure 5.3 SERS spectrum compared with silver salt and computed spectra. 132
xiii
Figure 5.4 Downshifted O-H stretch in SERS spectrum. 135
Figure 5.5 IR, RAIRS, and SEIRA results. 141
Figure 5.6 Raman Spectrum o f 1-Naphthylamine. 148
Figure 5.7 Effect o f pH on SERS Enhancement. 150
Figure 5.8 SERS o f 1-naphthylamine. 153
Figure 5.9 Silver coordination complex [Ag(l-NA)2]N0 3. 155
Figure 5.10 Raman and SERS o f Ag Coordination Complex. 155
Figure 5.11 SERS o f (a) [A g(l-N A )2] N 0 3 and (b) 1-NA in colloidal Ag
solution. 156
Figure 6.1 Depiction o f Single-Molecule Langmuir-Blodgett SERRS. 165
Figure 6.2 Molecular structures o f BBIP PTCD, pentyl PTCD, and azo PTCD. 167
Figure 6.3 Surface plasmon absorption and AFM image o f 6 nm Ag film. 169
Figure 6.4 Solution absorption o f BBIP PTCD, pentyl PTCD, and azo PTCD. 170
Figure 6.5 Ensemble SERRS o f perylene LB monolayers on Ag films. 172
Figure 6.6 BBIP PTCD single-molecule LB SERRS on Ag. 174
Figure 6.7 Pentyl PTCD single-molecule LB SERRS on Ag. 175
Figure 6.8 Azo PTCD single-molecule LB SERRS on Ag. 176
Figure 6.9 Molecular structure o f salPTCD. 179
Figure 6.10 Solution absorption o f salPTCD. 180
Figure 6.11 Solution fluorescence o f salPTCD with decreasing concentration. 182
Figure 6.12 RRS and SERRS compared for salPTCD. 184
Figure 6.13 Mapping o f SERRS Down to the Single-Molecule Level. 185
Figure 6.14 SalPTCD SERRS at various concentrations. 188
Figure 6.16 Single-molecule bi-analyte Langmuir-Blodgett SERRS. 191 Figure 6.17 Absorption Spectroscopy and Atomic Force Microscopy. 193
Figure 6.18 Ensemble SERRS o f R18 and salPTCD. 194
Figure 6.19 SERRS Mapping of 1:1 Mixtures in LB Films. 197
Figure 6.20 Single-Molecule Spectral Variation. 200
Figure 6.21 Molecular structure of BNPTCD. 202
Figure 6.22 Absorption o f BNPTCD, and Ag and mixed Ag/Au films. 203
Figure 6.23 Ensemble SERS/SERRS on Ag fdms. 205
Figure 6.24 Ensemble SERS/SERRS on mixed Ag/Au films. 206
Figure 6.25 Single-molecule SERS/SERRS mapping. 208
R e p r o d u c e d with p e r m i s s i o n o f t h e co p y r ig h t o w n e r . F u r t h e r r e p r o d u c t i o n p ro h ib ite d w ith o u t p e r m i s s i o n .
LIST OF ABBREVIATIONS
1-NA: 1-Naphthylamine 2-N A T: 2-Naphthalenethiol
5 -A F: 5-(Aminomethyl)Fluorescein AA: Arachidic Acid
AFM: Atomic Force Microscopy ATR: Attenuated Total Reflection Azo PTCD: Bis(benzimidazo)-Perylene B 4F: Biotin-4-Fluorescein
BBIP PTCD: Bis-Benzylimido Perylene
BNPTCD: A,Ar -Bis(neopentyl)-3,4,9,10-Perylenebis(dicarboximide) DFT: Density Functional Theory
EF: Enhancement Factor
FTIR: Fourier Transform Infrared
G1 DAB-Am: DAB-Am-4-Polypropylenimine Tetraamine Dendrimer
G5 DAB-Am: DAB-Am 64-Polypropylenimine Tetrahexacontaamine Dendrimer IR: Infrared
LB: Langmuir-Blodgett LbL: Layer-by-Layer
PAH: Poly eye lie Aromatic Hydrocarbon
Pentyl PTCD: iV-Pentylimidobenzimidazo-Perylene PBS: Phosphate Buffered Saline
PTCD: Perylenetetracarboxylic Diimide PVP: Poly(vinylpyrrolidone)
R18: Octadecylrhodamine B R6G: Rhodamine 6G
RAIRS: Reflection Absorption Infrared Spectroscopy RRS: Resonance Raman Scattering
RS: Raman Scattering SAL: Salicylic Acid
SalPTCD: iV-pentyl-5-salicylimidoperylene SEF: Surface-Enhanced Fluorescence
SEIRA: Surface-Enhanced Infrared Absorption SEM: Scanning Electron Microscopy
SERRS: Surface-Enhanced Resonance Raman Scattering SERS: Surface-Enhanced Raman Scattering
TEM: Transmission Electron Microscopy XPS: X-ray Photoelectron Spectroscopy
R e p r o d u c e d with p e r m i s s i o n o f t h e co p y r ig h t o w n e r . F u r t h e r r e p r o d u c t i o n p ro h ib ite d w ith o u t p e r m i s s i o n .
Chapter 1
1.1 Introduction
The powerful microanalytical techniques o f surface-enhance Raman scattering (SERS) and surface-enhanced resonance Raman scattering (SERRS) involve large increases in Raman and resonance Raman scattering cross sections o f analyte molecules adsorbed at the surface o f nanometric-scale metallic particles that are capable o f sustaining radiating localized surface plasmon resonances.1-4 The study and application o f these techniques has seen tremendous growth recently, and there are now almost a thousand scientific publications that discuss them per year. They are being employed widely in the medical, biological, chemical, and physical sciences toward a broad range o f problems.5-7 In particular, their high spatial resolution, high information content, and ultrasensitivity make them especially attractive as analytical techniques. As well, high quality, inexpensive, portable, and user-friendly Raman instruments are now becoming available, making these techniques accessible to many more scientists than ever before.
At this point o f remarkable growth, however, there remain several important challenges facing SERS/SERRS. Three o f the most critical o f these challenges are represented by the primary objectives o f this thesis: (1) to develop high-quality, specialized substrates that provide high enhancement o f signals; (2) to provide strategies for the comprehensive vibrational study o f molecules adsorbed on metal nanoparticles, by doing fundamental work on the interpretation o f the SERS/SERRS spectra o f different molecular systems; and finally, (3) to develop and improve techniques for ultrasensitive and single-molecule analysis o f various molecules. These objectives are reflected in the structure o f this thesis, with each being the focus o f a major chapter.
In Chapter 2, though, a review is given o f the most fundamental concepts employed in the work o f this thesis. In particular, Raman scattering, resonance Raman scattering, SERS, SERRS,8 surface-enhanced fluorescence9 and the Langmuir-Blodgett film fabrication technique are introduced and discussed. In Chapter 3, the details o f the experimental and computational work o f this thesis are presented in sections on samples, characterization, and computation.
In Chapter 4, the development o f high-quality, specialized substrates that provide high enhancement o f signals, the first objective o f this thesis, is addressed. The results o f several studies on the fabrication, characterization, and application o f new SERS/SERRS substrates are presented.10"15 In particular, new SERS/SERRS substrates presented in this chapter include: mixed Ag/Au evaporated nanoparticle films; self-sustained, Au nanoparticle embedded chitosan films; dendrimer/Ag nanosphere LbL films; dendrimer/Ag nanowire LbL films; and avidin/Ag nanoparticle LbL films. These substrates were characterized using a variety o f techniques including: UV-visible surface plasmon absorption spectroscopy, X-ray photoelectron spectroscopy, atomic force microscopy, transmission electron microscopy, and infrared absorption. They were demonstrated to be excellent substrates for SERS/SERRS measurements, demonstrating significant enhancement capability and other valuable characteristics including: chemical selectivity, functionality, biocompatibility, broadened and tunable enhancement regions, improved physical properties, incorporation o f different metallic nanoparticles, low cost, easy fabrication, and water insolubility.
addressed. In this chapter, the results o f studies on the interpretation o f the SERS spectra o f the surface complexes o f salicylic acid and 1-naphthylamine are presented.16' 18 Due to the major structural changes that arise through the formation o f the surface complexes o f these analytes, the interpretation o f their spectra on Ag was o f unusual complexity and required the utilization o f a variety o f spectroscopic techniques, as well as DFT computation, for different related chemical species. Through the use o f these techniques, the nature o f the surface complexes o f these analytes was determined. As well, the origins o f many o f the effects that confound SERS spectral analysis, and strategies that can be employed to resolve them, are discussed in this chapter.
In Chapter 6, the development and improvement o f techniques for ultrasensitive and single-molecule analysis o f various molecules, the final objective o f this work, is addressed. In this chapter, the results o f several studies where the Langmuir-Blodgett
1Q 9 ^ approach to single molecule SERS/SERRS detection was employed are presented. ' In this work, 6 molecular systems were studied at the single-molecule level, using three nanostructured metal films, a variety o f laser excitation wavelengths, and single-point and 2D spatial mapping techniques. The sections o f this chapter discuss the study o f overtones and combinations in the single-molecule spectra o f perylene derivatives; the use o f 2D SERRS mapping techniques to explore the breakdown o f ensemble averaging; single-molecule SERRS from one-to-one binary mixtures; and non-resonant single molecule SERS on nanostructured metallic films.
Finally, in Chapter 7, the conclusions o f this thesis are summarized.
References
(1) Aroca, R. Surface-Enhanced Vibrational Spectroscopy, John Wiley & Sons, Ltd.: Chichester, UK, 2006.
(2) Moskovits, M. Rev. Mod. Phys. 1985, 57, 783-826.
(3) Otto, A.; Mrozek, I.; Grabhom, H.; Akemann, W. J. Phys.-Condens. M atter 1992,
4, 1143-1212.
(4) Vo-Dinh, T. TrAC, Trends Anal. Chem. 1998, 17, 557-582.
(5) Haynes, C. L.; McFarland, A. D.; Van Duyne, R. P. Anal. Chem. A-Pages 2005, 77, 338A-346A.
(6) Kneipp, K.; Kneipp, H.; Itzkan, I.; Dasari, R. R.; Feld, M. S. Curr. Sci. 1999, 77, 915-926.
(7) Surface-Enhanced Raman Scattering- Physics and Applications', Kneipp, K.; Moskovits, M.; Kneipp, H., Eds.; Springer-Verlag: Berlin Heidelberg, 2006; Vol. 103. (8) Pieczonka, N. P. W.; Goulet, P. J. G.; Aroca, R. F. Applications o f the Enhancement o f Resonance Raman Scattering and Fluorescence by Strongly Coupled Metallic Nanostructures. In Surface-Enhanced Raman Scattering- Physics and Applications', Kneipp, K., Moskovits, M., Kneipp, H., Eds.; Springer-Verlag: Berlin Heidelberg, 2006; Vol. 103; pp 197-216.
(10) Goulet, P. J. G.; Pieczonka, N. P. W.; Aroca, R. F. Can. J. Anal. Sci. Sped. 2003,
48, 146-152.
(11) dos Santos Jr., D. S.; Goulet, P. J. G.; Pieczonka, N. P. W.; Oliveira Jr., O. N.; Aroca, R. F. Langmuir 2004, 20, 10273-10277.
(12) Goulet, P. J. G.; Dos Santos, D. S., Jr.; Alvarez-Puebla, R. A.; Oliveira, O. N., Jr.; Aroca, R. F. Langmuir 2005, 21, 5576-5581.
(13) Aroca, R. F.; Goulet, P. J. G.; Dos Santos, D. S., Jr.; Alvarez-Puebla, R. A.; Oliveira, O. N., Jr. Anal. Chem. 2005, 77, 378-382.
(14) Goulet, P. J. G.; Pieczonka, N. P. W.; Aroca, R. F. In New Approaches in Biomedical Spectroscopy, Kneipp, K., Aroca, R. F., Kneipp, H., W entrup-Byme, E., Eds.; American Chemical Society: Washington, DC, in press.
(15) Pieczonka, N. P. W.; Goulet, P. J. G.; Aroca, R. F. J. Am. Chem. Soc. 2006, 128, 12626-12627.
(16) Goulet, P. J. G.; Aroca, R. F. Can. J. Chem. 2004, 82, 987-997.
(17) Goulet, P. J. G.; Alvarez-Puebla, R.; Aroca, R. F. Trace Detection o f an Environmental Pollutant by Surface-Enhanced Raman Scattering. In Applications o f Surface-Enhanced Raman Spectroscopy, Farquharson, S., Ed.; CRC Press, in press. (18) Alvarez-Puebla, R. A.; Arceo, E.; Goulet, P. J. G.; Garrido, J. J.; Aroca, R. F. J. Phys. Chem. B 2 0 0 5 ,109, 3787-3792.
(19) Goulet, P. J. G.; Pieczonka, N. P. W.; Aroca, R. F. Anal. Chem. 2003, 75, 1918- 1923.
(20) Goulet, P. J. G.; Pieczonka, N. P. W.; Aroca, R. F. J. Raman Spedrosc. 2005, 36, 574-580.
6
(21) Goulet, P. J. G.; Aroca, R. F. submitted for publication. (22) Goulet, P. J. G.; Aroca, R. F. manuscript in preparation.
Chapter 2
BACKGROUND
2.1 Introduction
In this chapter, a brief overview is given to the most fundamental concepts employed in the work o f this thesis. In particular, Raman and resonance Raman scattering are introduced, with particular focus on how they arise and how their intensities are determined. Next, the surface-enhanced versions o f these spectroscopies, SERS and SERRS, are discussed. A particular focus is given in this section to the nature o f the electromagnetic enhancement mechanism that defines these phenomena. Surface- enhanced fluorescence is then briefly described and distinguished from SERS/SERRS. Finally, the Langmuir-Blodgett thin film fabrication technique is introduced.
2.2 Raman and Resonance Raman Scattering
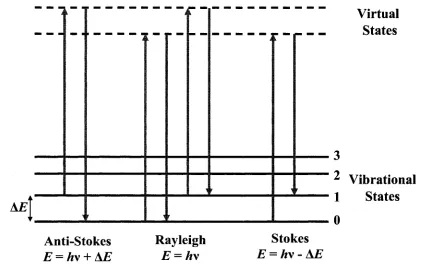
In the process o f Raman scattering,3'6 an oscillating electric field o f incident light (generally a laser) polarizes the electron cloud o f a molecule producing a short-lived virtual state lying between the electronic ground state and the first electronic excited state. This induced dipole can then radiate scattered light. If it does not induce nuclear motion through energy transfer, then the emitted radiation will be Rayleigh scattering and have the same frequency as the incident light. However, if it induces vibrational motion, energy will be transferred either to or from the molecule, and the emitted radiation will be Raman scattering that is shifted in frequency from the incident light. These shifts, known as Raman shifts, are independent o f the wavelength o f excitation, correspond to the quantized energy differences between the vibrational states o f the electronic ground state o f the molecular system, and provide information about its normal vibrational modes.
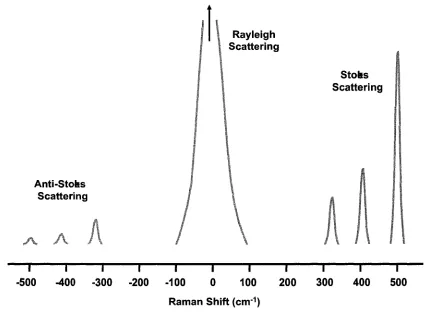
In Figure 2.1, Rayleigh and Raman scattering processes are depicted using a simple energy level diagram. Raman scattering is divided into Stokes and anti-Stokes emission, with the former being shifted to lower energy and the latter being shifted to higher energy. Under normal conditions Stokes-shifted Raman scattering is favored over anti-Stokes, because the population o f excited vibrational states is low. This is particularly true for high frequency vibrations. Because o f this, Stokes-shifted Raman scattering is more intense and is most often reported. However, with elevated temperatures, where excited vibrational states are more heavily populated, the anti- Stokes/Stokes ratio increases, and this can be useful for determining sample temperatures. Rayleigh scattering, on the other hand, is far more probable than either o f these Raman scattering processes, and it is usually necessary to filter it out experimentally. In Figure 2.2, the scattering spectrum o f a hypothetical molecule is given
1 0
showing the general trend in relative intensities for these processes. Stokes and anti- stokes bands mirror each other in terms o f Raman shift values, but not in terms o f intensity because the population o f higher excited vibrational states is o f low probability at normal ambient temperatures.
AE
Anti-Stokes
E = hx +
A
E
Rayleigh
E = hx
Stokes
E = hx -
A
E
Virtual
States
3
2
1 0
Vibrational
States
Rayleigh Scattering
Stoks Scattering
Anti-Stoks Scattering
“ I
1--- 1--- 1--- 1--- 1--- 1--- 1--- 1--- 1--- 1”
-500 -400 -300 -200 -100 0 100 200 300 400 500
Raman Shift (cm'1)
Figure 2.2 Scattering spectrum o f a hypothetical molecule.
The strength o f the induced dipole in a molecule, P, described above, is given by the expression
P = aE
where a is polarizability and E is the incident electric field. The polarizability is a tensor that describes the volume and shape o f the molecular electronic cloud, and gives information about its ability to be distorted (polarized) in an electric field:
« x , <**y
< *yx a yy
« z *
12
Each o f the components o f this tensor can be expressed as a series expansion:
a = a 0 +f d a }
\ d q j q + - q*+...
where ao is the value o f the polarizability at the equilibrium geometry, and q is the change from equilibrium. The second term in this expression determines whether or not vibrational modes will be observed, and provides us with the fundamental selection rule for linear Raman:
d a
This indicates that a change in the polarizability must be associated with a vibrational mode for it to be Raman active. This, o f course, will be determined by the symmetry o f the vibration.
The amplitude o f the electric field o f incident radiation can be described by: E = Eo cos(a>ot)
where coo is the frequency o f the incident laser. By substituting this, and our expression for polarizability, into our expression for induced dipole moment, ignoring higher order terms, we yield:
P = a 0E 0 cos(o)0t) + r d o }
d q ) q 0 cos(o)t)E0 cos(o)0t)...
P - a 0E 0 cos(a>0t) + — a 'q 0E 0 cos(&>0 - a>)t + —a 'q 0E 0 cos(o)0 + co)t.
The first term corresponds with Rayleigh scattering, while the latter two correspond to Stokes and anti-Stokes Raman scattering, respectively. It can be seen from this expression that both Rayleigh and first order Raman scattering processes are linear with laser intensity. However, in addition to laser intensity, Raman intensity will also be determined by the wavelength o f the source. In ranges where the molecule does not have electronic absorptions, the intensity o f Raman scattering increases with the fourth power o f the source frequency. In cases where the molecule is absorbing at the excitation wavelength, however, resonance Raman scattering occurs.
Resonance Raman scattering (RRS)79 spectra are recorded when laser excitation falls within the envelope o f an electronic transition o f a molecular system. Under these conditions, Raman intensities associated with the most symmetric vibrational modes o f a molecular chromophore can be enhanced by a factor o f up to 106, leading to great increases in the sensitivity o f this technique over non-resonant Raman scattering as well as simplified spectra with fewer observable modes. RRS is most commonly applied to dye molecules using visible lasers,10’11 but with UV lasers becoming more widely available, it is now more widely employed in the study o f many large biological systems that have high energy electronic transitions.1214
The process o f resonance Raman scattering is shown in a simple energy level diagram in Figure 2.3. As can be seen in this figure, excitation is no longer into a virtual state but is directly into one o f the excited states o f the molecule. As a result o f this, the intensities o f RRS lines are determined by the properties o f the excited state. In
14
Excited
Electronic
State
^
Ground
2 Electronic
I
State
0
Anti-Stokes
Rayleigh
Stokes
E = h \ + AE
E = h \
E = h x - \ E
Figure 2.3 Resonance Rayleigh and Raman scattering.
2.3 Surface-Enhanced Raman and Resonance Raman Scattering
The closely related phenomena o f surface-enhanced Raman scattering (SERS), and surface-enhanced resonance Raman scattering (SERRS)5’15"21 have now been established as enormously important micro-analytical techniques due primarily to their high spatial resolution, ultrasensitivity, and high structural information content. ’ ’ They are largely defined by the increased sensitivity they demonstrate over their relatively weak non-enhanced counterparts, Raman scattering (RS), and resonance
7 29 24 2
Raman scattering (RRS), that have cross section values o f only ca. 10' and 10' cm per molecule, respectively. This increased sensitivity results from surface-enhancement that occurs when molecules are excited with electromagnetic radiation while at or near
16
the surface o f appropriate enhancing metal nanoparticles and their aggregates, due to dramatically strengthened electromagnetic fields resulting from radiating localized
1 0 in
surface plasmon resonances o f the metal. ’ ' Average enhancement factors (EF) for ensemble SERS/SERRS measurements often range between ca. 103 and 106,31 34 while those at so called hot spots, areas o f very intense and highly localized EM fields,35'39 have been reported to far exceed this, with some reports o f values as high as 1014 and 1015.40'42 The exact magnitude o f hot spot enhancement, however, remains a topic o f much discussion. 43,44
The first observation o f strongly enhanced Raman signals was reported in 1974 by Fleischmann et al., and was attributed to an increase in the number o f scattering molecules due to the increase in the roughness o f the Ag electrode where they were measuring pyridine 45 In 1977, however, it was discovered that this large increase in Raman intensity could not be explained on the basis o f surface area increases alone. Jeanmaire and Van Duyne,46 and Albrecht and Creighton,47 demonstrated that the observed enhancement was in fact a result o f a surface-enhancement process, and the term surface-enhanced Raman scattering, SERS, was coined. This significant scientific discovery led to a flurry o f activity in the field o f surface spectroscopy, and soon other surface-enhanced photoprocesses were recognized.28,48
explain the enhancement o f Raman and resonance Raman signals and these are referred to as the electromagnetic (EM)26,49,50 and chemical enhancement19,51'54 models. The former represents the main, defining feature o f SERS/SERRS, while the latter is responsible for much o f the complex surface behaviour that is observed and makes these effects very difficult to control.
Chemical enhancement is generally viewed as being able to provide enhancements o f no more than ca. 102, and arises from several different first layer electronic effects that can alter the normal Raman scattering cross-section. For this mechanism to function there must be a direct interaction that allows electronic coupling o f the molecule to the metal surface. These interactions could involve the formation o f a new molecule-metal charge transfer electronic transition51 or a dynamic charge transfer between the metal and the molecule.19 The nature o f the interactions that an adsorbate has with a metal surface can critically change what is observed in SERS/SERRS spectra. However, it is the dominant EM mechanism that ultimately provides the enhancement that makes it possible to observe these changes by providing enhancement factors many orders o f magnitude larger.
Electromagnetic enhancement o f Raman and resonance Raman scattering is fundamentally driven by the excitation o f surface plasmon resonances (also commonly called dipole particle plasmon resonances to stress the importance o f the dipolar modes over higher order modes) in metal nanoparticles and nanoaggregates. These resonances involve the collective oscillation o f conduction electrons in the metal with the electric field o f incident light, and provide the most effective enhancement for particles with diameters much smaller than the wavelength of the visible light used to excite them,
18
generally between 10 and 150 nm .18 The resonant frequency o f nanoparticle surface plasmons is determined by the dielectric constant o f the metal, the dielectric constant o f the medium, as well as the size, and shape o f the particle, and can be tuned through variation o f these properties.55 Generally a simplified model is employed that assumes a spherical particle, and it is found that the resonance condition, and maximum field enhancement, is achieved when the real part o f the dielectric function o f the metal is equal to -2.18,56 In the visible region, this condition is best satisfied by three coinage metals: Ag, Au, and Cu, and these metals are, not surprisingly, also by far the most widely used substrates for surface-enhanced spectroscopies.
proportional to the fourth power o f the enhancement o f the local incident field. Experimentally this is taken advantage o f through dipolar coupling o f closely spaced nanoparticles, producing even greater fields and therefore larger enhancement o f Raman and resonance Raman scattering.
Many different SERS/SERRS substrates have been developed to date, employing a variety o f physical and chemical methods, and producing a wide assortment o f interesting architectures.31,57'63 Some o f these architectures include those produced by vacuum evaporation o f metal,64,65 electrochemical roughening o f metal electrodes,47,66 and lithographical techniques.67,68 Essentially all substrates that produce strong enhancement o f RS and RRS, involve electromagnetically coupled particles, either as dimers and larger aggregates, or as larger networks o f interacting nanoparticles, generally in films. Both o f these rely on short interparticle spacing for maximum enhancement. This is achieved at highly localized electromagnetic hot spots that provide the greatest enhancements of RS and RRS. In dimers and small aggregates, hot spots are thought to occur exclusively at the junctions o f particles where there is the greatest constructive interference o f electric fields.69,70 In large networks o f interacting particles, on the other hand, multi-particle dipole-dipole interactions lead to highly localized, excitation wavelength-dependent surface plasmon normal modes that are not strongly correlated
• ^ 8 3 Q A ' X
with local particle geometries. ’ ’ Hot spots o f both o f these types have now been employed by several groups to demonstrate detection and spectroscopic identification o f analytes down to the single molecule level.23,40‘43,53,69"96
20
2.4 Surface-Enhanced Fluorescence (SEF)
Surface-enhanced fluorescence arises from the electromagnetic interaction that occurs between fluorescent molecules and metal nanoparticles that have appropriate
a q qh i n n
enhancing optical properties, ’ ' and has been described as the “weak cousin o f the t o
SERS effect”, owing to its rather tiny enhancement factors o f generally less than ca. 100. The enhancement o f SEF is fundamentally held back by its rather long lifetime in a way that RS and RRS are not. SEF can be viewed as a product o f three different processes: enhanced emission, enhanced absorption, and radiationless transfer o f energy to metallic surfaces, with the former two processes resulting from enhanced EM fields at the surface o f plasmon sustaining metal nanoparticles.101
Electromagnetic enhancement is a much slower decaying function o f molecule-surface separation than that o f surface quenching, and as a result o f this, maximum fluorescence will occur at distances (d) that are intermediate between the maximum quenching (d=0) and “no effect” conditions.
2.5 Langmuir-Blodgett Monolayers
1 09 109
Langmuir-Blodgett (LB) films ’ are thin films composed o f one or more monomolecular layers deposited onto solid substrates, and take their name from Irving Langmuir and Katherine Blodgett who did much o f the pioneering work on them in the late 1930s.104 These films are assembled at gas-liquid interfaces (most commonly the air- water interface) and then transferred by moving solid substrates vertically through them at the monolayer/air interface, as depicted in Figure 2.4. Most commonly LB monolayers are composed o f amphiphilic organic molecules that orient themselves at a air-water interface in order to minimize free energy. However, an increasing diversity o f materials are now being employed with this powerful thin film fabrication technique.62,105,106 The LB technique has been widely, and successfully employed in the study o f SERS/SERRS due to the high degree o f control it offers for sample architectures.107"111 At the same time, SERS/SERRS are well suited for the characterization o f monolayers due to their very high sensitivity.112,113
22
Figure 2.4 Depiction of Langmuir-Blodgett film transfer to solid substrate.
transformations are similar in nature to the phase transitions between gases, liquids, and solids, and range from expanded to condensed phase as a function the molecule-molecule interactions on the surface. These transformations are monitored by measuring surface pressure, II, as a function o f the area per molecule in the fdm. Surface pressure is a measure o f the surface tension reduction that occurs when monolayers are deposited onto liquid subphases, and is given by II =yo-y, where yo is the surface tension o f the pure liquid, and y is the surface tension o f the liquid covered with the monolayer. W ater is the most commonly used subphase, and has a maximum IT value o f 72.8 mN m '1 at 20 °C.102 Plots o f surface pressure against molecular area are referred to as isotherms, as they are recorded at constant temperature. They provide a wealth o f information about the behaviour o f monolayer films, and are the basis for the determination o f transfer conditions.103
In expanded phase, molecules in films exert very little force upon one another, and so surface pressure remains relatively low. As the film is compressed, the area per molecule drops causing an increase in the interactions between the molecules, and consequently an increase in surface pressure. At this stage, the molecules begin to organize themselves on the subphase. Upon further compression, condensed phases are reached, where molecules are tightly packed and oriented with their hydrophobic ends directed away from the water surface. If the film is compressed further, film collapse will occur and a drop in surface pressure will be observed.
When monolayers are transferred to solid substrates, surface pressure and temperature are monitored and controlled throughout. There are three types o f LB film deposition, and the technique employed will depend on the type o f molecule and the type
24
o f substrate that is being used. The most commonly used vertical deposition is called Y- type deposition, and involves a monolayer being deposited on each traversal o f the monolayer/air interface. This vertical type o f deposition produces a head to head and tail to tail pattern on the substrate. When monolayers are transferred only on the downstroke, it is referred to as X-type deposition, while transfer on the upstroke only is referred to as Z-type deposition. The success o f film transfer is generally monitored by the measurement o f transfer ratios, r. The transfer ratio for a depostion is given by x=AJAs, where Al is the decrease in the area occupied by the monolayer on the water surface, and As is the coated area o f the solid substrate. Transfer ratios that vary significantly from unity indicate poor film homogeneity and transfer.
References
(1) Smekal, A. Naturwissenschaften 1 9 2 3 ,11, 873-875. (2) Raman, C. V.; Krishnan, K. S. Nature 1 9 2 8 ,121, 501-502.
(3) Long, D. A. The Raman Effect: A Unified Treatment o f the Theory o f Raman Scattering by Molecules', John Wiley & Sons, Ltd.: Chichester, UK, 2002.
(4) McCreery, R. L. Raman Spectroscopy fo r Chemical Analysis', John Wiley & Sons, Ltd.: New York, 2000; Vol. 157.
(5) Smith, E.; Dent, G. Modern Raman Spectroscopy: A Practical Approach', John Wiley & Sons, Ltd.: West Sussex, UK, 2005.
(6) Aroca, R. F. Surface-Enhanced Vibrational Spectroscopy, John Wiley & Sons, Ltd.: Chichester, UK, 2006.
(8) Albrecht, M. G. J. Chem. Phys. 1961, 34, 1476-1484. (9) Myers, A. B. J. Raman Spectrosc. 1997, 28, 389-401.
(10) Aroca, R. F.; Clavijo, R. E. Spectrochim. Acta, Part A 1991, 47A, 271-277. (11) Vosgroene, T.; Meixner, A. J. ChemPhysChem 2005, 6, 154-163.
(12) Lednev, I. K.; Kamoup, A. S.; Sparrow, M. C.; Asher, S. A. J. Am. Chem. Soc.
1 9 9 9 ,121, 4076-4077.
(13) Lednev, I. K.; Kamoup, A. S.; Sparrow, M. C.; Asher, S. A. J. Am. Chem. Soc.
2 0 0 1 ,123, 2388-2392.
(14) Zhao, X.; Wang, D.; Spiro, T. G. J. Am. Chem. Soc. 1 9 9 8 ,120, 8517-8518.
(15) Aroca, R. Surface-Enhanced Vibrational Spectroscopy, John Wiley & Sons Ltd: West Sussex, 2006.
(16) Surface-Enhanced Raman Scattering- Physics and Applications', Kneipp, K.; Moskovits, M.; Kneipp, H., Eds.; Springer-Verlag: Berlin Heidelberg, 2006; Vol. 103. (17) Surface Enhanced Raman Scattering', Chang, R. K.; Furtak, T. E., Eds.; Plenum Press: New York, 1982.
(18) Moskovits, M. Rev. Mod. Phys. 1985, 57, 783-826.
(19) Otto, A.; Mrozek, I.; Grabhom, H.; Akemann, W. J. Phys.-Condens. Matter 1992,
4, 1143-1212.
(20) Vo-Dinh, T. TrAC, Trends Anal. Chem. 1 9 9 8 ,17, 557-582. (21) Metiu, H. Prog. Surf. Sci. 1 9 8 4 ,17, 153-320.
(22) Deckert, V.; Zeisel, D.; Zenobi, R.; Vo-Dinh, T. Anal. Chem. 1998, 70, 2646- 2650.
(23) Kneipp, K.; Kneipp, H.; Itzkan, I.; Dasari, R. R.; Feld, M. S. Chem. Rev. 1999,
99, 2957-2976.
(24) Aroca, R.; Rodriguez-Llorente, S. J. Mol. Struct., Theochem 1997, 408-409, 17-
22.
(25) Goulet, P. J. G.; Aroca, R. F. Can. J. Chem. 2004, 82, 987-997.
(26) Schatz, G. C.; Van Duyne, R. P. Electromagnetic mechanism o f surface-enhanced spectroscopy. In Handbook o f Vibrational Spectroscopy, Chalmers, J. M., Griffiths, P. R., Eds.; John Wiley & Sons, Ltd.: Chichester, UK, 2002; Vol. 1; pp 759-774.
(27) Moskovits, M. J. Raman Spectrosc. 2005, 36, 485-496.
(28) Weitz, D. A.; Garoff, S.; Gersten, J. I.; Nitzan, A. J. Chem. Phys. 1983, 78, 5324- 5338.
(29) Sanchez-Gil, J. A.; Garcia-Ramos, J. V.; Mendez, E. R. Optics Express [online computer file ] 2 0 0 2 ,10, 879-886.
(30) Etchegoin, P.; Cohen, L. F.; Hartigan, H.; Brown, R. J. C.; Milton, M. J. T.; Gallop, J. C. Chem. Phys. Lett. 2004, 383, 577-583.
(31) Pieczonka, N. P. W.; Goulet, P. J. G.; Aroca, R. F. J. Am. Chem. Soc. 2006, 128, 12626-12627.
(32) Aroca, R. F.; Goulet, P. J. G.; Dos Santos, D. S., Jr.; Alvarez-Puebla, R. A.; Oliveira, O. N., Jr. Anal. Chem. 2005, 77, 378-382.
(33) Alvarez-Puebla, R. A.; Arceo, E.; Goulet, P. J. G.; Garrido, J. J.; Aroca, R. F. J. Phys. Chem. B2005, 109, 3787-3792.
(35) Shalaev, V. M. Phys. Rep. 1996, 272, 61-137.
(36) Poliakov, E. Y.; Shalaev, V. M.; Markel, V. A.; Botet, R. Opt. Lett. 1996, 21, 1628-1630.
(37) Zhang, P.; Haslett, T. L.; Douketis, C.; Moskovits, M. Phys. Rev. B 1998, 57, 15513-15518.
(38) Stockman, M. I. Phys. Rev. E 1997, 56, 6494-6507.
(39) Gresillon, S.; Aigouy, L.; Boccara, A. C.; Rivoal, J. C.; Quelin, X.; Desmarest, C.; Gadenne, P.; Shubin, V. A.; Sarychev, A. K.; Shalaev, V. M. Phys. Rev. Lett. 1999,
8 2 ,4520-4523.
(40) Kneipp, K.; Wang, Y.; Kneipp, H.; T. Perelman, L. T.; Itzkan, I. Phys. Rev. Lett.
1997, 78, 1667-1670.
(41) Nie, S.; Emory, S. R. Science 1997, 275, 1102-1106.
(42) Kneipp, K.; Kneipp, H.; Kartha, V. B.; Manoharan, R.; Deinum, G.; Itzkan, I.; Dasari, R. R.; Feld, M. S. Phys. Rev. E 1998, 57, R6281-R6284.
(43) Moskovits, M.; Tay, L.-L.; Yang, J.; Haslett, T. SERS and the single molecule. In Optical Properties o f Nanostructured Random Media', Shalaev, V. M., Ed.; Springer- Verlag: Berlin Heidelberg, 2002; Vol. 82; pp 215-226.
(44) Otto, A. J. Raman Spectrosc. 2006, 37, 937-947.
(45) Fleischmann, M.; Hendra, P. J.; McQuillan, A. J. Chem. Phys. Lett. 1974, 26, 163-166.
(46) Jeanmaire, D. L.; Van Duyne, R. P. Electroanal. Chem. 1977, 84, 1-20. (47) Albrecht, M. G.; Creighton, J. A. J. Am. Chem. Soc. 1977, 99, 5215-5217. (48) Nitzan, A.; Brus, L. E. Journal o f Chemical Physics 1981, 75, 2205-2214.
28
(49) Moskovits, M. J. Chem. Phys. 1978, 69, 4159-4161.
(50) Etchegoin, P.; Cohen, L. F.; Hartigan, H.; Brown, R. J. C.; Milton, M. J. T.; Gallop, J. C. J. Chem. Phys. 2 0 0 3 ,119, 5281-5289.
(51) Kambhampati, P.; Child, C. M.; Foster, M. C.; Campion, A. J. Chem. Phys. 1998,
108, 5013-5026.
(52) Otto, A. Indian J. Phys. B 2003, 77B, 63-73. (53) Otto, A. Phys. Stat. Sol. (a)2001, 188, 1455-1470. (54) Otto, A. J. Ram. Spectrosc. 2005, 36, 497-509.
(55) Kelly, K. L.; Coronado, E.; Zhao, L. L.; Schatz, G. C. J. Phys. Chem. B 2003,
107, 668-677.
(56) Kerker, M.; Wang, D. S.; Chew, H. App. Opt. 1 9 8 0 ,19, 4159-4173.
(57) Wu, Y.; Livneh, T.; Zhang, Y. X.; Cheng, G.; Wang, J.; Tang, J.; Moskovits, M.; Stucky, G. D. Nano Lett. 2004, 4, 2337-2342.
(58) Green, M.; Liu, F. M. J. Phys. Chem. B 2 0 0 3 ,107, 13015-13021.
(59) Chan, S.; Kwon, S.; Koo, T.-W.; Lee, L. P.; Berlin, A. A. Adv. Mat.2003, 15, 1595-1598.
(60) Bjemeld, E. J.; Svedberg, F.; Kaell, M. Nano Lett. 2003, 3, 593-596.
(61) Freeman, R. G.; Grabar, K. C.; Allison, K. J.; Bright, R. M.; Davis, J. A.; Guthrie, A. P.; Hommer, M. B.; Jackson, M. A.; Smith, P. C.; et al. Science 1995, 267, 1629-1631. (62) Tao, A.; Kim, F.; Hess, C.; Goldberger, J.; He, R.; Sun, Y.; Xia, Y.; Yang, P. Nano Lett. 2003, 3, 1229-1233.
(63) Brolo, A.; Arctander, E.; Gordon, R.; Leathern, B.; Kavanagh, K. L. Nano Lett.
(64) Semin, D. J.; Rowlen, K. L. Anal. Chem. 1994, 66, 4324-4331. (65) Schlegel, V. L.; Cotton, T. M. Anal. Chem. 1991, 63, 241-247.
(66) Ren, B.; Lin, X.-F.; Yang, Z.-L.; Liu, G.-K.; Aroca, R. F.; Mao, B. W.; Tian, Z. Q. J. Am. Chem. Soc. 2 0 0 3 ,125, 9598-9599.
(67) Liao, P. F.; Bergman, J. G.; Chemla, D. S.; Wokaun, A.; Melngailis, J.; Hawryluk, A. M.; Economou, N. P. Chem. Phys. Lett. 1981, 82, 355-359.
(68) Haynes, C. L.; McFarland, A. D.; Smith, M. T.; Hulteen, J. C.; Van Duyne, R. P. J. Phys. Chem. B. 2 0 0 2 ,106, 1898-1902.
(69) Michaels, A. M.; Jiang, J.; Bras, L. J. Phys. Chem. B 2 0 0 0 ,104, 11965-11971. (70) Le Ru, E. C.; Meyer, M.; Etchegoin, P. J. Phys. Chem. B 2 0 0 6 ,110, 1944-1948. (71) Michaels, A. M.; Nirmal, M.; Bras, L. E. J. Am. Chem. Soc. 1999, 121, 9932- 9939.
(72) Otto, A. J. Raman Spectrosc. 2002, 33, 593-598.
(73) Meixner, A. J.; Vosgrone, T.; Sackrow, M. J. Lumin. 2001, 94&95, 147-152. (74) Marayama, Y.; Ishikawa, M.; Futamata, M. Chem. Lett. 2001, 834-835.
(75) Krug, J. T., II; Wang, G. D.; Emory, S. R.; Nie, S. J. Am. Chem. Soc. 1999, 121, 9208-9214.
(76) Mandal, M.; Kundu, S.; Ghosh, S. K.; Jana, N. R.; Panigrahi, M.; Pal, T. Curr. Sci. 2004, 86, 556-559.
(77) Bizzarri, A. R.; Cannistraro, S. Appl. Spectrosc. 2002, 56, 1531-1537. (78) Bizzarri, A. R.; Cannistraro, S. Chem. Phys. 2003, 290, 297-306.
(79) Bjemeld, E. J.; Foeldes-Papp, Z.; Kaell, M.; Rigler, R. J. Phys. Chem. B 2002,
106, 1213-1218.
30
(80) Bosnick, K. A.; Jiang, J.; Brus, L. E. J. Phys. Chem. B 2 0 0 2 ,106, 8096-8099. (81) Constantino, C. J. L.; Lemma, T.; Antunes, P. A.; Aroca, R. Anal. Chem. 2001,
7 3 ,3674-3678.
(82) Constantino, C. J. L.; Lemma, T.; Antunes, P. A.; Aroca, R. Spectrochim. Acta, Part A 2002, 58A, 403-409.
(83) Constantino, C., J. L.; Lemma, T.; Antunes Patricia, A.; Goulet, P.; Aroca, R. Appl. Spectrosc. 2003, 57, 649-654.
(84) Eggeling, C.; Schaffer, J.; Seidel, C. A. M ; Korte, J.; Brehm, G.; Schneider, S.; Schrof, W. J. Phys. Chem. A 2 0 0 1 ,105, 3673-3679.
(85) Etchegoin, P.; Liem, H.; Maher, R. C.; Cohen, L. F.; Brown, R. J. C.; Hartigan, H.; Milton, M. J. T.; Gallop, J. C. Chem. Phys. Lett. 2002, 366, 115-121.
(86) Futamata, M.; Maruyama, Y.; Ishikawa, M. J. Phys. Chem.
B
2004, 108, 13119- 13127.(87) Futamata, M.; Maruyama, Y.; Ishikawa, M. Vib. Spectrosc. 2004, 35, 121-129. (88) Goulet, P. J. G.; Pieczonka, N. P. W.; Aroca, R. F. Anal. Chem. 2003, 75, 1918-1923.
(89) Goulet, P. J. G.; Pieczonka, N. P. W.; Aroca, R. F. Can. J. Anal. Sci. Sped. 2003,
48, 146-152.
(90) Goulet, P. J. G.; Pieczonka, N. P. W.; Aroca, R. F. J. Raman Spectrosc. 2005, 36, 574-580.
(93) Kneipp, K. Single Molecules2001, 2, 291-292.
(94) Kneipp, K.; Kneipp, H.; Dasari, R. R.; Feld, M. S. Indian J. Phys. B 2003, 77B, 39-47.
(95) Kneipp, K.; Kneipp, H.; Deinum, G.; Itzkan, I.; Dasari, R. R.; Feld, M. S. Appl. Spectrosc. 1998, 52, 175-178.
(96) Lemma, T.; Aroca, R. F. J. Raman Spectrosc. 2002, 33, 197-201. (97) Chance, R. R.; Prock, A.; Silbey, R. Adv. Chem. Phys. 1978, 37, 1-65.
(98) Radiative Decay Engineering', Lakowicz, J. R.; Geddes, C. D., Eds.; Springer: New York, 2005; Vol. 8.
(99) Lakowicz, J. R.; Geddes, C. D.; Gryczynski, I.; Malicka, J.; Gryczynski, Z.; Aslan, K.; Lukomska, J.; Matveeva, E.; Zhang, J.; Badugu, R.; Huang, J. Journal o f Fluorescence2 0 0 4 ,14, 425-441.
(100) Wokaun, A.; Lutz, H.-P.; King, A. P.; Wild, U. P.; Ernst, R. R. J. Chem. Phys.
1983, 79, 509-513.
(101) Goulet, P. J. G.; Aroca, R. F. Surface-enhancement o f fluorescence near noble metal nanostructures. In Topics in Fluorescence Spectroscopy: Radiative Decay Engineering', Lakowics, J. R., Geddes, C. D., Eds.; Springer Science + Business Media, Inc.: New York, 2005; Vol. 8; pp 223-247.
(102) Petty, M. C. Langmuir-Blodgett Films. An Introduction', Cambridge University Press: Cambridge, 1996.
(103) Langmuir-Blodgett Films', Roberts, G., Ed.; Plenum Press: New York, 1990. (104) Blodgett, K. B. J. Am. Chem. Soc. 1935, 57, 1007-1022.
(105) Kumaki, J.; Hashimoto, T. J. Am. Chem. Soc. 1 9 9 8 ,120, 423-424.
32
(106) Kim, F.; Kwan, S.; Akana, J.; Yang, P. J. Am. Chem. Soc. 2 0 0 1 ,123, 4360-4361. (107) Aroca, R.; Battisti, D. Lcmgmuir 1990, 6, 250-254.
(108) Aroca, R.; Guhathakurta-Ghosh, U. J. Am. Chem. Soc. 1989, 111, 7681-7683. (109) Uphaus, R. A.; Cotton, T. M.; Mobius, D. Thin Solid Films 1 9 8 5 ,132, 173-184. (110) Chen, Y. J.; Carter, G. M.; Tripathy, S. K. Solid State Comm. 1985, 54, 19-22. (111) Aroca, R.; Jennings, C.; Kovacs, G. J.; Loutfy, R. O.; Vincett, P. S. J. Phys. Chem. 1985, 898, 4051-4054.
Chapter 3
EXPERIMENTAL AND COMPUTATIONAL DETAILS
In this chapter, divided into three main sections on samples, characterization, and computation, the details o f the experimental and computational work o f this thesis are introduced.
3.1 Samples
3.1.1 Reagents
Unless otherwise noted, all reagents were obtained from Sigma-Aldrich and used without further purification. These include: hydrochlorauric acid, rhodamine 6G (R6G), trisodium citrate, silver nitrate, DAB-Am-4 polypropylenimine tetraamine dendrimer (G1 Dab-Am), DAB-Am-64 polypropylenimine tetrahexacontaamine dendrimer (G5 Dab- Am), polystyrene sulfonate (PSS), 2-naphthalenethiol (2-NAT), poly(vinylpyrrolidone) (PVP) (monomer-based calculation MW= 55 000) , arachidic acid (AA), ultrapure Ag shot, ultrapure Au shot, avidin (from egg white), 3-amino-propyltriethoxysilane, fluorescein, biotin 3-sulfo-A-hydroxysuccinimide ester, salicylic acid (SAL), sodium salicylate, potassium bromide, and 1-naphthylamine (1-NA).
A,TV1-bis(neopentyl)-3,4,9,10-perylenebis(dicarboximide) (BNPTCD) were synthesized and purified at the Xerox Research Centre o f Canada, and used as provided.
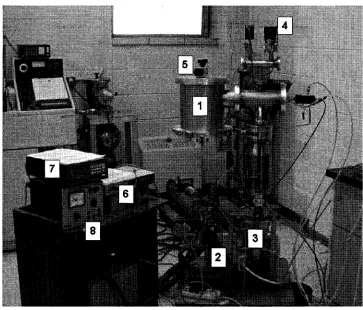
3.1.2 Evaporated Metal Films
In this work, nanostructured Ag and mixed Ag/Au films, as well as Ag mirror films, were produced on clean, pre-heated glass substrates by vacuum evaporation. These metal films were prepared at pressures o f 10"6 to 10"7 Torr (1 Torr = 133.322 Pa) using a Balzers BSV 080 glow discharge evaporation unit, where mass thickness was monitored with an XTC Inficon quartz crystal oscillator. All depositions were carried out at evaporation rates o f ca. 0.5 A/s. Nanostructured metal films, with appropriate nanoparticle size distributions for surface-enhanced spectroscopy, were prepared with mass thickness values o f 10 nm or less, while Ag mirror films for reflection absorption infrared spectroscopy (RAIRS) were prepared with a mass thickness o f 100 nm. All Ag films o f 6, 9, and 10 nm mass thickness were deposited onto substrates at 200 °C, except the 10 nm Ag films utilized for single-molecule bi-analyte studies o f salPTCD and R18 (Chapter 6), which were deposited onto substrates at 150 °C. M ixed 10 nm Ag/Au nanostuctured films, were prepared by two separate evaporation procedures. First, Ag films o f 5 nm mass thickness were deposited onto glass microscope slides at a temperature o f 200 °C. After the slides cooled slowly (1-2 h) to room temperature, the
vacuum was broken and the evaporation source was changed. The chamber was then returned to high vacuum and 5 nm films o f Au were deposited on top o f the Ag at 200 °C. In all cases, substrates were maintained at elevated temperature for 1 h following film deposition. The vacuum evaporation system utilized in this work is shown in Figure 3.1.
36