An Approach for Clustering Protein Structure
Luibaiba Muhammad Kunhi 1, Raju K 2
PG Student, Department of CSE, NMAM Institute of Technology, Nitte, Udupi District, Karnataka, India1
Associate Professor, Department of CSE, NMAM Institute of Technology, Nitte, Udupi District, Karnataka, India 2
ABSTRACT:An intermediate stage in the prediction of the tertiary structure of proteins is the clustering stage wherein, all the different conformations of a protein obtained by a conformational search algorithm are clustered so as to select the best models. Since the number of such conformations can be very large, a faster parallel method for clustering is required. This paper proposes a CUDA based parallel approach for clustering protein structure decoys using a combination of filtering and hierarchical Ward’s Clustering.
KEYWORDS: Hierarchical clustering, decoy, protein structure
I. INTRODUCTION
A huge number of protein sequences have been produced by the genome projects. We can obtain the tertiary structure of protein from these sequences. The tertiary structure needs to be known for the determining the functions of a protein. The traditional methods for predicting protein structure includes X-Ray Crystallography and NMR (Nuclear Magnetic Resonance) methods which are extremely slow.
Ab initio protein structure prediction methods generate a large number of protein structure decoys. The best model has to be selected from among them. Clustering based techniques are used for selecting the best models based on the theory that the clusters that have the maximum population are closer to the native structure.
Clustering is the technique of partitioning elements into groups based on a similarity measure. With reference to proteins, it is the grouping of decoys that are similar in terms of RMSD. In hierarchical clustering, clusters are merged together until a single cluster remains or until required numbers of clusters have been obtained. Single link connection uses the distance between 2 nearest decoys while assigning a decoy to a cluster. Complete link uses the distance between 2 farthest decoys. For clustering proteins, we have used hierarchical Ward’s clustering based on minimum RMSD distance.
II. RMSD
In order to find the similarity between protein structures, we need a distance measure. There are several measures such as TM-score [1], GDT_TS [2] and Maxub [3], but RMSD (Root Mean Square Deviation) is the most commonly used measure. We can measure the RMSD of 2 protein structures struc1 and struc2 using equation given below:
(1)
RMSD does not measure the distance very well. If an atom of a protein structure undergoes a small rotation, it will not affect the coordinate vectors very much but can distort RMSD. So in order to minimize RMSD we need to superimpose the 2 structures by rotating the first structure with respect to the second. An algorithm for superimposing vectors has been specified by Kabsch [4] .We can calculate the RMSD after superimposition as shown below:
(2)
III. CUDA AND PARALLEL COMPUTING
NVIDIA provides the CUDA C/C++ that is an extension of C/C++ allowing programmers to write code targeted for the GPU. The instructions for the CPU and the GPU are specified in the single source file. It is then compiled by nvcc to generate separate files that are to be executed by the host and the device. Massive parallelism can be obtained through the use of Grids, blocks and threads. The keyword __global__ is used to indicate that a function is a kernel. The keyword __device__ is used to indicate a device function that can be called by the kernel. There can be only one kernel in a source program. The kernel is called by the host function. The device function cannot be called by the host, it can be called only by the kernel. While invoking a kernel we can specify the number of blocks and threads specified within “<<<” and “>>>”.
Protein structure clustering involves dealing with a large number of data. However the operation to be performed on this large data is same making it an ideal candidate for CUDA based parallelization.
IV. LITERATURE SURVEY
Traditional methods for predicting the protein structure involved laboratory techniques like X-ray Crystallography. Computational approaches are used for getting faster results. In exact clustering approaches, an initial cut off for RMSD is set and for each of the decoy, its neighbours within the cut off distance are calculated using the pairwise RMSD matrix. The decoy with the maximum number of neighbours is identified as the best decoy. The best decoy and its neighbours are removed from the set and then the process is repeated. A mechanism that adjusts the threshold based on the number of neighbours is also described. One major drawback is the need to store the pairwise RMSD matrix. For a large number of decoys, the need to have a pairwise RMSD matrix may be limited by the available memory.
I-TASSER [5] is protein structure prediction system that uses SPICKER [6]. SPICKER approach tries to solve this problem by portioning decoys into subsets and selecting only the lowest energy decoy from each of the subset.
Another approach reduce the initially large number of decoys is to eliminated decoys initially using an energy based scoring function such as OPUS-Ca [7]. This technique is adopted by Wang et al [8].
Calibur [9] is an approximation based method wherein the actual RMSD is approximated. This is achieved through the use of techniques like decoy grouping, use of bounds and filtering. Decoys within a group are considered collectively thereby reducing the number of RMSD computations and overcoming the memory issues in SPICKER.
Zhang et al [10] have proposed a new measure for measuring similarity between proteins. This new measure is called as C-score. C-score computation is faster than RMSD computation.
HS-Forest [11] is an approach that is a combination of clustering and energy function. HS stand for height and size. HS-Forest involves the construction of large number of HS Trees based on a random hashing function. Initially all the decoys are present in the root node. A random hashing function is used split the node into 2 and so on until the height and the size of the tree is balanced. Many such trees and constructed and the only the decoy with minimum RMSD to all low energy structures within the node of the trees are considered for evaluating the best model.
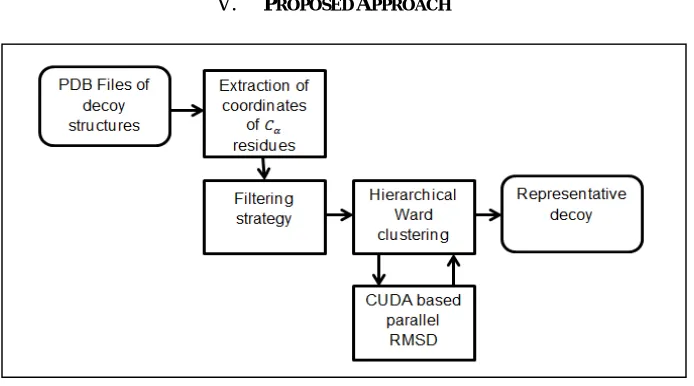
V. PROPOSED APPROACH
Figure 1: Overview of Design
Fig shows an overview of the design of the proposed method. We have decided to use the hierarchical ward’s clustering algorithm described in [12]. Use of efficient filtering techniques can improve the speed up without introducing a significant impact on the quality of the predicted structures. In order to be able to handle large number of decoy structures, we have decided to incorporate a filtering technique applied in Calibur. Hierarchical ward clustering algorithm can be applied as it eliminates the need for the selection of a threshold value and has high accuracy. In hierarchical ward’s clustering, clusters are merged iteratively until the required number of clusters is obtained or until a single cluster remains.
A. Filtering strategy
In order to reduce the overhead of having to perform a large number of computations, filtering techniques can be applied to remove the bad structures. The approximation based filtering strategy used by Calibur can be adopted for this.
In order to perform filtering we need to decide on a threshold distance d. This can be computed by taking a random sample of 100 decoys and identifying the value of d such that only a D% of decoys are below the cut off. The above process can be iterated many times (around 10) to improve accuracy. This D% can be set to min ( , 10). Once the threshold is determined, we subject the decoy structures to filtering. Filtering is based on the assumption that the best models are within the cut off distance from 10% of decoys. With this assumption, we can just take a random sample of 100 decoys and then and remove all the decoys that are not within twice the cut off distance.
B. Hierarchical Ward’s Clustering
Instead of computing pairwise distance between each decoy, we can compute the RMSD between the decoy and centroid of the cluster. This will reduce the number of computations. Initially, each decoy can be assigned to a cluster of its own. Clusters that have the minimum ward distance between them can be merged in the next iteration. Initially, the coordinates of the decoy structures can be considered as its centroid. While merging clusters, we can construct their centroids by computing the average across all its members. We have decided to stop the algorithm when a cluster contains 20% of the total decoys. Algorithm 1 describes the hierarchical Ward’s clustering.
Let and be the centroids of the 2 clusters and and be the number of members in each cluster. The
centroid of a cluster that is a union of and can be computed as:
Algorithm 1: Hierarchical Ward’s clustering
Input: m Clusters with each decoy in one cluster, Function to compute ward distance Output: Hierarchical clustering
Procedure:
1. Initialize a stack data structure with 0 i.e. first cluster
2. While
3. Find which is the cluster at top of stack
4. Find cluster with minimum ward distance to
5. If is in stack
6. Set as the 2nd element from top of stack
7. Set as union of and
8. Pop and from stack
9. Push to stack
10. Update clusters
11. Cluster with lower index should contain
12. Cluster at higher index replaced by one at 13. Decrement
14. Else
15. Push to stack
16. End if
17. End while
C. CUDA based RMSD computation
With hierarchical, clustering pairwise RMSD matrix is not required. The RMSD is computed as and when required. The computation has been parallelized by generating m threads to operate on m different clusters which operate parallel providing a huge computational speedup. To generate m threads (where m is the number of decoys), we set n which is
the number of threads per block and generate blocks. Algorithm 2 describes this method.
Algorithm 2: Parallel Computation of RMSD
Input: CLS - Array containing the coordinates of centroids of all clusters AV- Array containing the coordinates of centroids of active cluster
- Number of atoms
Output: RMSD distance between the active cluster and all other clusters
Procedure:
1. 2. 3. 4. 5. 6. 7.
VI. RESULTS AND ANALYSIS
For testing the algorithm the dataset has been taken from [13]. The algorithm has been tested in an ubuntu 12.0 LTS system and the GPU used is the NVIDIA GeForce GTX 470.
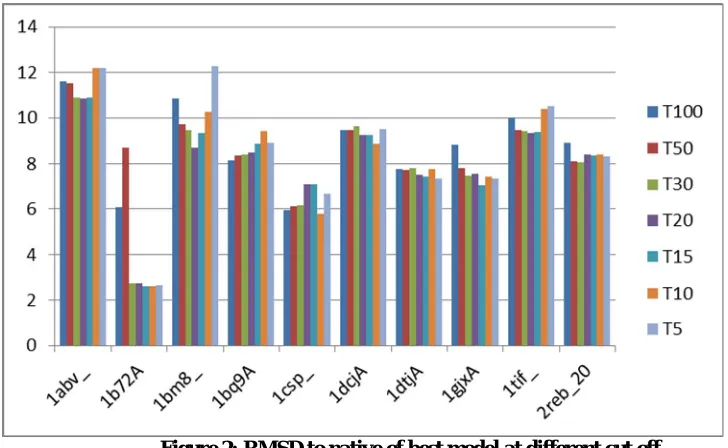
Figure 2: RMSD to native of best model at different cut off
Complete clustering does not give the best results in terms of RMSD so we need to stop the clustering at a certain cut off. Figure 2 shows the RMSD to native of the best model selected by the clustering technique when a threshold on maximum number of members is set as to 100% (complete), 50%, 30%, 20%, 10% and 5%. It can be observed that the threshold of 20% gives minimal RMSD values on an average.
Figure 3: Execution time: serial vs. Parallel
between the serial and the parallel version. We can further improve the model selection by applying filtering to eliminate outliers.
VII. CONCLUSION
Faster computational approach for clustering of protein decoys is essential in many structure prediction systems. This paper describes an approach for the same. Hierarchical ward’s clustering based on parallel RMSD computation has been implemented. The parallel version is more than 10 times faster than the serial version of the same. Future work remaining is the implementation of the filtering technique.
REFERENCES
[1] Y. Zhang and J. Skolnick, “Scoring function for automated assessment of protein structure template quality”, Proteins, vol. 57, pp. 702-710,
2004.
[2] A. Zeml, “LGA: A method for finding 3D similarities in protein structures”, Nucleic Acids Res, vol. 31, pp. 3370-4, 2003.
[3] N. Siew., A. Elofsson, L. Rechlewski and D Fischer, “MaxSub: An automated measure for the assessment of protein structure prediction
quality”, Bioinformatics, vol. 16, pp. 776-85, 2000.
[4] https://en.wikipedia.org/wiki/Kabsch_algorithm
[5] Wu S, Skolnick J and Zhang Y, “Ab initio modeling of small proteins by iterative TASSER simulations”, BMC Biology, vol. 5, article 17, 2007.
[6] Zhang Y and Skolnick J, “SPICKER: Approach to clustering protein structures for near-native model selection”, J Comput Chem, vol. 25, pp
865-871, 2004.
[7] Y. Wu, M. Lu, M. Chen, J. Li and J. Ma., “OPUS-Ca: A knowledge-based potential function requiring only Ca positions”, Protein Science, vol.
16, pp. 1449-1463, 2007.
[8] Qingguo Wang, Yi Shang and Dong Xu, “A New Clustering-Based Method for Protein Structure Selection”, Proc International Joint
Conference on Neural Networks, pp. 2891-2898, 2008.
[9] Li and Ng. “Calibur: a tool for clustering large numbers of protein decoys”, BMC Bioinformatics, vol. 11, article 25, 2010.
[10] Jingfen Zhang and Dong Xu., “Fast algorithm for clustering a large number of protein structural decoys”, Proc IEEE International Conference
on Bioinformatics and Biomedicine, pp. 30-36, 2011.
[11] Zhou and Wishart, “An improved method to detect correct protein folds using partial clustering”, BMC Bioinformatics, vol. 14, article 11, 2013.
[12] Hoang-Vu Dang, Bertil Schmidt, Andreas Hildebrand, Anna Katharina Hildebrandt, “Parallelized Clustering of Protein Structures on
CUDA-enabled GPUs”, Proc 22nd Euromicro International Conference on Parallel, Distributed, and Network-Based Processing, pp. 1-8 , 2014.