| INVESTIGATION
Joint Prediction of the Effective Population Size and
the Rate of Fixation of Deleterious Mutations
Enrique Santiago*,1and Armando Caballero†
*Departamento de Biología Funcional, Facultad de Biología, Universidad de Oviedo, 33071 Oviedo, Spain, and†Departamento de Bioquímica, Genética e Inmunología, Facultad de Biología, Universidad de Vigo, 36310 Vigo, Spain
ABSTRACTMutation, genetic drift, and selection are considered the main factors shaping genetic variation in nature. There is a lack, however, of general predictions accounting for the mutual interrelation between these factors. In the context of the background selection model, we provide a set of equations for the joint prediction of the effective population size and the rate offixation of deleterious mutations, which are applicable both to sexual and asexual species. For a population ofNhaploid individuals and a model of deleterious mutations with effect s appearing with rate U in a genomeL Morgans long, the asymptotic effective population size (Ne) and the average number of generations (T) between consecutive fixations can be approximated by
NeN exp ½22U=ð2s 1LÞ ð121=UTÞ3andT ½expð2sNeÞ 21=½2UsNe. The solution is applicable to Muller’s ratchet,
provid-ing satisfactory approximations to the rate of accumulation of mutations for a wide range of parameters. We also obtain predictions of the effective size accounting for the expected nucleotide diversity. Predictions for sexual populations allow for outlining the general conditions where mutational meltdown occurs. The equations can be extended to any distribution of mutational effects and the consideration of hotspots of recombination, showing thatNeis rather insensitive and not proportional to changes inNfor many combinations of parameters. This could contribute to explain the observed small differences in levels of polymorphism between species with very different census sizes.
KEYWORDSeffective population size; background selection; genetic variation; mutational meltdown; Muller’s ratchet
P
OPULATIONS accumulate mutations at a rate that is de-pendent on the interaction with selection and drift (Lande 1995; Charlesworth 2012). When the effective population size is small, genetic drift reduces the efficiency of purifying selection and deleterious mutations can befixed. If the re-duction is maintained over time, the accumulation of muta-tions causes a progressive decline infitness that eventually leads the population to extinction. This process is referred to as the mutational meltdown (Lynch and Gabriel 1990; Lynchet al.1995; Whitlock and Bürger 2005).
In the context of asexual populations, the accumulation of deleterious mutations is called Muller’s ratchet (Muller 1932; Felsenstein 1974). The argument is that, with time, the last few individuals from the fittest class, that is the class with
the minimum number of mutations, will get an additional deleterious mutation at any locus and the least-loaded class will disappear to be replaced by a newfittest class with one more mutation. Without recombination, each loss of the least-loaded class is as irreversible as the click of a ratchet. The mechanism has been widely studied (Haigh 1978; Bell 1988; Stephan et al.1993; Lande 1998; Gordo and Charlesworth 2000a,b; Etheridge et al.2007; Soderberg and Berg 2007; Jain 2008; Rouzineet al.2008; Neher and Shraiman 2012;
Good et al. 2014) and there are several approaches for
predicting the average number of generations (T) between two consecutive clicks. For scenarios where the ratchet oper-ates slowly, there are precise methods available to predict
T using diffusion approximation theory (e.g., Gordo and Charlesworth 2000a,b; Jain 2008; Neher and Shraiman 2012). For more general scenarios, methods based on traveling-wave theory are also available (Rouzine et al.
2008; Goodet al.2014).
We argue that the prediction of the rate of the ratchet is basically the same problem as the prediction of the rate of fixation of deleterious mutations in the background selection
Copyright © 2016 by the Genetics Society of America doi: 10.1534/genetics.116.188250
Manuscript received February 17, 2016; accepted for publication September 20, 2016; published Early Online September 26, 2016.
Supplemental material is available online atwww.genetics.org/lookup/suppl/doi:10. 1534/genetics.116.188250/-/DC1.
model (Charlesworth 2013) and, consequently, a solution based on the classical concept of the effective population size
Ne (Wright 1931; recently reviewed by Wang et al. 2016) should apply if appropriate equations forNeconsidering the fixation of deleterious mutations can be found. When the ratchet is at mutation-selection-drift equilibrium, each click of the ratchet corresponds, on average, to a fixation of a deleterious allele (Charlesworth and Charlesworth 1997). Felsenstein (1974) established that Muller’s ratchet is an as-pect of the Hill–Robertson interference (Hill and Robertson 1966) affecting the genetic variance in both sexual and asex-ualfinite populations under selection. Although the interfer-ence was postulated to be a consequinterfer-ence of selection, genetic drift is also needed to develop disequilibrium if gene effects are independent. Thus, the rate of fixation of deleterious mutations depends on the effective population size, but in reverse, the effective population size is a function of the genetic variance forfitness, which is related to the rate of fixation of deleterious mutations. Although the effective population size and the rate of accumulation of deleterious mutations are dependent on each other, there is not a gen-eral theory that considers this interrelation to make a joint prediction.
Most of the theoretical developments on the prediction of Muller’s ratchet assume constant mutation effects with some inferences for variable effects. Charlesworth et al. (1993) showed that the appropriated value to predict the size of the least-loaded class with variation in selection coefficients (s) is the harmonic mean of the effects. This leads to the conclusion that a reduction inNefor the background selec-tion model would mainly be determined by mutaselec-tions with relatively small effects, up to the extent that they are not effectively neutral. The boundary arounds= 1/Neis a tran-sition region from mutations under effective selection to ef-fectively neutral mutations. Soderberg and Berg (2007) dealt with the problem of a continuous distribution of effects without recombination by considering only the part of the distribution with effects larger than a subjective cut-off value (s.4/Neb, whereNebis the effective population size applicable to small effects). Goodet al.(2014) adapted their theory for genetic diversity to a distribution of weak effects by substitutingsby the squared root of the second moment of the distribution of effects.
Here we extend the theory of the effective population size to consider the reduction in variance caused by thefixation of deleterious mutations in models offixed and variable gene effects. We argue that this theory, in combination with the equation for the probability offixation of Malecót (1952) and Kimura (1957), allows for a general prediction ofNeand the rate offixation of deleterious mutations with or without re-combination and, consequently, also gives a general approx-imation for the particular problem of predicting the rate of progression of Muller’s ratchet in asexual populations. The analysis shows that, under background selection, the norm is that Ne is not proportional to the census sizeN of the populations, particularly when variable distributions of gene
effects are considered. This fact may have important conse-quences on the levels of genetic variation predicted in natural populations:Necan be quite insensitive to changes in popula-tion size, which could contribute to explain the relatively small differences in levels of polymorphism observed between species with very different census sizes (Lewontin 1974; Lynch and Conery 2003; Leffleret al.2012; Corbett-Detiget al.2015).
Methods
Let us consider afinite population with random mating and a constant numberNof haploid reproducers. Each individual is made up of a genomeLMorgans long. Every generation,N
new individuals are generated to found the next generation. Each new individual is produced by fusion and meiosis of two random reproducers sampled with replacement and receives a number of new deleterious mutations taken from a Poisson distribution with meanU. The locations of the new mutations are randomly scattered along the genome and their effects are independent. Thus, an individual carrying k mutations with deleterious effectss1,s2, ..., sk has an absolutefitness (1 2 s1)(1 2s2). . .(1 2 sk). If the deleterious effects are considered to be invariant (s), then thefitness of an individ-ual carryingkdetrimental mutations is (12s)k. Assuming a constant population size is the same as considering a com-petitive model in which the relativefitness of the individual is (1 2 s)k/W, where W is the mean of the absolute fitness values. Therefore, the input of new genetic variation for rel-ativefitness per generation isVM=Us2. The census sizeNof the population can be very large but the effective population size,Ne, is reduced by selection by such an amount that drift could lead some deleterious mutations to escape from selec-tion and befixed.
Prediction of the asymptotic Neaccounting for the
reduction in variance due tofixation of deleterious mutations withfixed effects
In what follows we defineNeas the asymptotic effective pop-ulation size, i.e., that measuring the asymptotic rate of change in inbreeding or genetic drift in a closed population with constant size over generations, which is maintained under invariable breeding and evolutionary conditions. The prediction of Ne for a background selection model is
squared. In a model of deleterious mutations offixed effects
appearing at a rateUper haploid genome per generation on a genome of lengthLM,Necan be predicted by
NeNe
22U
2sþL; (1)
as approximated by Hudson and Kaplan (1995) and Nordborget al.(1996), focusing on the effect of selection on nucleotide diversity; by Santiago and Caballero (1998), using a genetic drift approach; and by Nicolaisen and Desai (2013) using a coalescent approach.
Equation 1 assumes that the variance for relativefitness is that expected for an infinitely large population (V=Us) in which mutations are neverfixed. When there is a chance for fixation of deleterious mutations infinite populations, how-ever,Vis reduced as meanfitness declines over generations. If mutations have effectsand there is afixation everyT gener-ations, the rate of decline in fitness per generation is2s/T. This rate must be equal to the reduction in fitness due to mutation (2Us) plus the expected response to selection, where the latter equals the amount of variance offitness (V) according to Fisher’s fundamental theorem of natural selection (Fisher 1930). Thus,2s/T=2Us+Vand, therefore,
V¼Us2s=T: (2)
The above expression is a particular case of the more general Equation 15A from García-Dorado (2007).
The relative cumulative valueQrover generations (i) con-tributed by a new association of the focal neutral gene with a particular selected locus having a recombination frequencyr
between them, is
Qr¼
XN
i¼0
ð12rÞi
12VM
V
i
1
rþ ðVM=VÞ
(Santiago and Caballero 1998). The ratioVM/Vis the rate of reduction of genetic variation due to selection and drift, which for now we consider to be constant for all the selected loci at equilibrium.
Selection on distant genes does not have influence on the drift process of the focal neutral gene and, for close linkage, recombination rates and genetic distances are nearly pro-portional. Assuming this proportionality across the genome, the cumulative effect of selection over generations (VQ2) for a neutral gene located in the middle of a chromosomeLM long can be given by
VQ2¼ 1
L=2 Z L=2
0
VQ2rdr 1
L=2V Z L=2
0
1
rþVM=V
2
dr
¼ V
VM
V
VM
V þ
L
2 !
Figure 1 Simulated effective popu-lation size (Ne) in consecutive
gen-erations in a model of deleterious effects with haploid mutation rate U= 1, genome lengthL= 0 (green), L= 0.1 (blue),L= 1 (red), and either (A) constant mutation effects s = 0.01 or (B) exponential distribution of effects fðsÞ ¼exp½2s=s=s with mean s = 0.01. The effective size is calculated in the series from the change in variance of gene frequen-cies among replicates of neutral genes over consecutive generations.
dat the end of the series indicates theNevalues obtained by substituting the observed rate offixation (1/T) in Equation 5. The horizontal dashed lines are theNeHvalues inferred from the observed heterozygosityHat a linked neutral locus in a central position in the genome by solving the equationH= 2NeHm, wheremis the rate of neutral mutation.
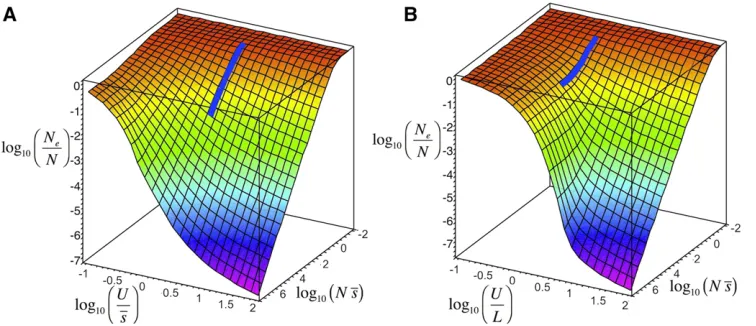
Figure 2 Ratio ofNetoNas a function ofNandswhenL= 0.1 and
U= 0.1. The surface was drawn using Equations 3–5. Fixation of dele-terious mutations does not occur at a significant rate to the right-hand side of the black thick line corresponding tos1/Ne, that is, 1/T=
0 and Equation 3 forNereduces to Equation 1. Fixations of deleterious
mutations occur to the left of the line, where Equation 1 does not hold. The plateau at the left-hand top corner corresponds to combinations of parameters with the highest rate of fixation, that is the rate of
(a more detailed deduction of this expression in given in Supplemental Material,File S1A). By using this integral to represent the cumulative effect over the genome, we also assume that the selected sites are uniformly and densely dis-tributed. SubstitutingVM=Us2andV=Us2s/Tfrom above, the effective size accounting for an arbitrary rate offixation of deleterious mutations can be approximated as (seeFile S1B)
Ne¼Ne2VQ
2 Ne
22U
2sþL
121
UT
3
: (3)
If the rate of fixation is negligible (T/N) then Equation
3 reduces to (1), as expected.
It is important to note that the derivation of these equa-tions corresponds to the concept of the asymptotic effective population size under selection, as defined above. For a cohort of new alleles, this Ne represents the magnitude of drift or inbreeding rate that is reached after a fairly large number of generations counted since theyfirst appeared by mutation (Santiago and Caballero 1998). Until that mo-ment, drift at the focal loci is expected to increase with time. We argue that the asymptotic effective size is the pertinent measure of drift to predict the rate offixation of deleterious mutations, whose transitions from one copy tofixation are dominated by long-term associations with selective variants at closely linked loci.
The intensity of genetic drift is expected to be larger for old mutations than for recent ones. In terms of effective popula-tion size, the asymptoticNecorresponds to old mutations but the particular Ne values associated to recent mutations are expected to be larger. The partialNe(t)value which represents the intensity of drift aftertgenerations is given by
NeðtÞ¼Ne2VQ
2 ðtÞ¼Ne
2 1
L=2 Z L=2
0
VQ2rðtÞdr
;
where QrðtÞ¼ Xt
i¼0 ð12rÞi
12VM
V
i
is the corresponding
cu-mulative value up to generationt.
Heterozygosity effective size (NeH)
With regards to neutral variation, the heterozygosity of a population is the result of the accumulation of contributions by mutations that appeared at different generations backward in time, which are under different drift intensities. Strictly speaking, there is not a single effective size value that de-scribes the spectrum of neutral variation in selected popula-tions. The heterozygosity effective size,NeH, obtained from the standing heterozygosityHat neutral loci by solving the simple equationH= 2mNeH, wheremis the rate of neutral mutation, is a sort of average effective size of convenience that is larger than the asymptoticNe:
H¼2mNeH¼
XN
t¼0
2mY
t
i¼0
12 1
NeðiÞ
; (4)
where each element of the infinite sum is the contribution to current heterozygosity by neutral mutations, which occurred
tgenerations backward in time. The difference between as-ymptotic Ne and heterozygosity NeHis not expected to be large with recombination, because most of the change in partialNe(t)values during the lifespan of the cohort of neutral mutations occurs in thefirst generations (see below). How-ever, the difference between the asymptoticNeandNeHcan be substantial under tight linkage and small effects (Nes,1) as will be shown below.
Joint prediction of the asymptotic Neand the rate of
fixation of deleterious mutations
The expected number of generations between consecutive fixations (T) (or its inverse 1/T, the rate offixation of dele-terious mutations) can be predicted by the product of the number of newly arising mutations per generation (NU) and their probability of fixation (Pf), which was developed by Malecót (1952) and Kimura (1957) as Pf (2sNe/N)/ (exp[2sNe]2 1). We argue that an approximation for the average number of generations between consecutive fi xa-tions can be given byT1/(NUPf),i.e.
Te
2sNe21 2UsNe :
(5)
Thus, we have an approximation ofNeaccounting for the rate offixation of deleterious mutations (Equation 3) and another ofTfrom the probability offixation of mutations given as a function ofNe(Equation 5). These equations then provide a system of two independent equations with two unknowns,
T and Ne, given values of N, U, and s. Equation 3 can be Figure 3 Predictions and simulations of the asymptotic effective size (Ne)
relative to the population size (N) and the expected nucleotide diversity (p) relative to that with no selection (p0) as a function of the selection
coefficient (s). Simulation results correspond to a population size N= 10,000 and mutation rate U = 0.01.
n
indicates simulated values ofp/p0from Good et al. (2014). dindicates simulated values of Ne/N.
Red line, prediction of p/p0using theory by Good et al. (2014) (File
S1F). Blue line, prediction ofp/p0by substituting thefitness varianceV
rearranged in a more convenient form by solving forT(see File S1C). The prediction of the standing variance forfitness
V is straightforward by substitutingTinto Equation 2. This variance Vis the corresponding one to be used in Equation 4 to predict heterozygosity.
Extension of the prediction of Neto an arbitrary
distribution of mutation effects
The prediction ofNecan be easily extended to account for any continuous distribution of mutational effects,f(s) (see File S1D),
Ne¼Ne2
R1 0Q
2
sVsds (6)
where the corresponding terms for any particular effect s
are the same as for fixed effects derived above, i.e.,
Q2 s ¼1
,
VMs
Vs
VMs
Vs þ
L
2 !
; Vs¼sðUs21=TsÞ; VMs¼UsS2;
andTs ½expð2sNeÞ21=½2UssNe:The mutation rateUsfor an effectsis obtained from the distribution,f(s), of effects:
Us¼UfðsÞ:
Equation 6 needs to be solved numerically forNe, which is present at both sides of the equality sign.
Heterogeneity of sites and hotspots of recombination
The effect of selection on the asymptoticNefor a focal neutral site under linkage has generally been considered to be the addition of the effects of selected loci. For a number n of selected loci, this can be indicated in a discrete form by the cumulative variance,
VQ2¼X
n
i¼1
ViQ2i ¼
Xn
i¼1
Vi
½riþ ðVMi=ViÞ
2;
to be included in the prediction ofNe¼Nexp½2VQ2;whereri is the recombination frequency between the neutral locus and theith selected gene, andVMiandViare the mutational variance and the standing genetic variance contributed by locusiat equilibrium (the ratioVMi/Viis the rate of reduction of genetic variance due to selection and drift at that locus).
This approach has been widely used to predict the land-scape of neutral variation in a genome region with variable mutation and recombination rates over the sites by consider-ing that the terms of the sum are independent. However, the reduction of variance due tofixation of deleterious mutations makes the variation forfitness at a particular site dependent on
the effects of the other selected sites (Hill and Robertson 1966). The particularNeivalue for each selected siteimust be included in the terms of the sum becauseVi=siUi2si/Ti, as previously shown, and the rate of fixation 1/Tiat site i depends onNei, which, in turn, depends on the particularVi values at the other sites. Therefore, all the terms of the sum depend on each other and allNeivalues have to be estimated at the same time.
The problem becomes complex if sites are not equivalent, that is, if they differ for recombination and mutation rates and effects. With regards to recombination, an approximate solution forNe, valid for any site, can be obtained if we assume that mutation rates and distributions of effects are equal for all loci and the pattern of recombination is regularly repeated over the ge-nome.File S1E gives a solution for the particular case ofm
segmentsflanked by hotspots of recombination evenly spaced over the genome and an arbitrary distribution of effects. The prediction ofNecan be approximated by
whereKis the proportion of recombination events located at hotspots, occurring in the remainder fraction (12K) within the segments between hotspots. The termsVMs* andVs* are the mutational variance and the genetic variance for fitness contributed by the segment. As effects and rates are uniformly distributed, thenVMs*¼VMs=mandVs*¼Vs=m:
Evaluation of expressions by simulation
Computer simulations were carried out to evaluate the pre-dictions ofNeandT. Haploid populations of sizeNranging from 10 to 1.5 3107individuals were run with selection-reproduction-mutation cycles for a large number of genera-tions to reach the selection–drift balance. An infinitely large number of biallelic loci with potential effect on fitness was assumed over a genome of lengthL= 0, 0.1, or 1 M. Effects onfitness were considered either constant (s= 0.001,s= 0.01, ors= 0.05) or taken from an exponential distribution with means:Selection was implemented by sampling with replacement individuals with probabilities proportional to theirfitness values. Having selected a mating pair, a zygote was formed by allowing recombination events to occur be-tween the genomes, in a number that was sampled from a Poisson distribution with mean L. Then, new mutations were assigned to the zygote in a number that was sampled from a Poisson distribution with meanU(0.001, 0.01, 0.2, or 1).
Thefixation of deleterious mutations is a long-term sto-chastic process, and we argue that it must be dependent on
Ne¼Ne
2R01Vs*
,
VMs *
Vs *
VMs *
Vs *þ Lð12KÞ
2m
ds 2 R1
0Vs
.
VMs Vs
VMs Vsþ
L
2
ds þ R1
0Vs*
.
VMs *
Vs *
VMs *
Vs *þ L
2m
ds
the asymptotic effective population size Ne. The computa-tion ofNefrom simulations was carried out by two different methods that give estimations of the asymptotic value. For the first one, biallelic neutral loci were inserted, equally spaced across the genome. After the population had reached mutation-selection equilibrium, neutral alleles were set up at frequency 0.5 and the rate of increase in neutral gene frequency variance over replicates (Vq) was scored for con-secutive generations (t) over a period of 300–500 genera-tions until an asymptotic stage was approximately reached. Thus, the effective population size at generationtwas cal-culated asNe(t) = [0.252Vq,t21]/[Vq,t212Vq,t ]. The effective sizeNe(t)was also calculated from the rate of de-cline in heterozygosity in consecutive generations (Ht) of the neutral alleles asNe(t) = 1/[12(Ht/Ht21)], and the same results were obtained as for the gene frequency vari-ance calculation, as expected. The asymptoticNevalue was approximated byNe(t)for a sufficiently larget.
For the second method of estimating the effective size from simulations, this was obtained from the simulated rate of fixation 1/T of deleterious mutations by solving Equation 5 forNe. We will call this measure the“fixation effective size.” We checked that, as expected, this measure of the effective size was very close to the simulated asymptotic effective size as described above. Because this latter method demands much less computational time than the preceding one, we generally used this one except for those scenarios where the rate offixation is so slow that the method is not useful, and the previous one was applied. Results were averages of a variable number of replicates or generations (thousands to
millions) depending on the population sizes and mutational parameters.
To estimate the heterozygosity effective population size,
NeH, a neutral locus was allocated in a central position of the genome. For each generation, the value of each individual’s neutral locus was changed by adding a mutational effect randomly sampled from the standard normal distribution. Under this distribution of mutational effects, the equilibrium variance is the expected heterozygosity effective population sizeNeHat the neutral locus (Hill 1982).
Data availability
The authors state that all data necessary for confirming the conclusions presented in the article are represented fully within the article.
Results
Computation of the effective size under the background selection model
In the background selection model, with a constant flux of deleterious mutations, the effective population size can be computed in different ways (Figure 1). Equation 3 refers to the asymptotic effective size under selection and linkage which, as mentioned above, may take a large number of gen-erations to be reached depending on the genome length, the population size, and the mutational parameters. An illustra-tion of this approach is shown in Figure 1A with simulaillustra-tion results for constant deleterious effects. The simulated asymp-toticNecomputed from the increase in gene frequency vari-ance at neutral loci is close to those calculated from the simulated rate offixation of deleterious mutations by solving Equation 5 forNe(fixation effective size; right-hand circles). This agreement supports the hypothesis that the asymptotic Table 1 Simulation results and predictions of the rate offixation
of deleterious mutations [(1/T) 3 100] for different values of population size (N), mutation rate (U) and effect of mutations (s)
N U s
(1/T)3100 Predictions
Simulations G&C Rouzine N&S Good
Equations 3–5
10 0.002 0.001 0.19 0.48 0.20 0.00 0.20 0.20
103 0.002 0.001 0.08 0.12 0.10 0.01 0.09 0.09
105 0.002 0.001 0.00 0.00 0.00 0.00 0.00 0.00
107 0.002 0.001 0.00 0.00 0.00 0.00 0.00 0.00
10 0.01 0.001 0.95 0.12 1.00 0.00 0.99 0.99
103 0.01 0.001 0.59 0.12 0.53 0.00 0.57 0.59
105 0.01 0.001 0.15 0.11 0.18 0.00 0 0.24
107 0.01 0.001 0.02 0.05 0.06 0.00 0 0.06
10 0.1 0.01 9.30 1.20 8.90 0.00 9.03 9.04
103 0.1 0.01 2.97 1.20 3.03 0.00 1.51 3.74
105 0.1 0.01 0.78 0.92 1.05 0.02 0 1.36
107 0.1 0.01 0.03 0.04 0.31 0.04 0 0.01
10 1 0.01 92.94 1.02 84.03 0.00 91.78 90.99
103 1 0.01 58.82 1.02 56.18 0.00 55.87 67.89
105 1 0.01 44.19 1.02 42.19 0.00 34.29 57.67
107 1 0.01 33.61 1.02 33.67 0.00 0 50.76
Values of 0.00 imply 1/T,0.0001 and 0 implies 1/T= 0. Scenario assuming no recombination (L= 0). Predictions are obtained by the methods of Gordo and Charlesworth (2000a,b), Rouzineet al.(2008), Neher and Shraiman (2012), Good
et al.(2014) (seeFile S1F for methods), and Equation 3–5. G&C, Gordo and Charlesworth; N&S, Neher and Shraiman.
Table 2 Simulation results and predictions of the rate offixation of deleterious mutations [(1/T)3100] and the asymptotic effective population size (Ne) for different values of mutation rate (U), effect of mutations (s), population size (N), and genome length (L)
U s N L
(1/T)3100 Ne
Sim. Eqn (3–5) Sim. Eqn (3–5)
0.01 0.001 103 0.1 0.38 0.34 850 944
1 0.35 0.32 914 993
104 0.1 0.00 0.00 8611a 8219
1 0.00 0.00 10192a 9802
0.1 0.01 103 0.1 0.25 0.44 269 226
1 0.00 0.00 829a 822
104 0.1 0.00 0.00 1944a 1889
1 0.00 0.00 8264a 8219
1 0.01 103 0.1 37.41 45.77 86 70
1 5.13 6.88 224 205
104 0.1 20.37 34.50 131 93
1 0.00 0.00 1257a 1407
Values of 0.00 imply 1/T,0.0001. Predictions are obtained by Equations 3–5. Sim., simulation; eqn, equation.
Nevalue is the relevant parameter to represent the drift pro-cess responsible for thefixation of deleterious mutations in the long term. In contrast, differences between the asymp-toticNeand heterozygosityNeHare larger. These differences are a consequence of the process of accumulation of variation contributed by neutral mutations that occurred in previous generations, as explained before.
The same pattern is observed when deleterious effects are variable. Figure 1B shows the three effective size estimates (asymptotic, fixation, and heterozygosity) for a continuous distribution of effectsf(s). Here, thefixation effective sizeNe is computed by solving the corresponding equation for the observed rate of change infitness due tofixations of delete-rious mutations:
DW¼ 2
Z 1
0
s
Tsds¼ 2
Z 1
0
2Us2Ne
e2sNe21fðsÞds; (8)
whereds/Tsis the rate offixation of mutations with effects within the range fromstos+ds.
In summary, in a background selection model the asymp-totic effective size and the fixation effective size are very similar, as hypothesized, and the heterozygosityNeHcan dif-fer to some extent under certain scenarios. In order to com-pare predictions with simulations of rates offixation we will generally consider, for simplicity, simulatedfixation effective size values obtained by solving Equation 5 for constant effects and Equation 8 for variable effects, unless stated otherwise.
Predictions of the asymptotic effective size accounting forfixation of deleterious mutations
Figure 2 represents the ratioNe/Nover a wide range ofNand
svalues. For scenarios wheres1/Neand below (left-hand region of the thick line determinings= 1/Ne), Equation 1 for
Nedoes not hold, as there isfixation of deleterious mutations (Neis predicted by Equation 3). In this region, it can be no-ticed that Ne is not proportional to changes in N, i.e., Ne becomes almost insensitive to increases inN(the ratio Ne/N decreases for increasing N), except when effects are so small that mutations are effectively neutral (plateau at the left-hand top corner), where thefixation rate is 1/TUandNeequals
N. When the effects are large (s..1/Ne) (right-hand region of the thick lines= 1/Ne)fixation is negligible (1/T/0) and there is proportionality in changes ofNeandN(the ratio re-mains constant for increasingN).
Predictions of the heterozygosity effective size, NeH
Figure 3 shows a comparison between predictions of the ratio
Ne/N(green line) and the predictions ofNeH/N(blue line). The latter is equivalent to the reduction of the neutral diver-sity of a population under selection relative to the diverdiver-sity of the same population without selection (p/p0). Both predic-tions overlap for intermediate and large values of selection coefficientss, but they are quite different for smallsvalues. Predictions from Goodet al.(2014) forp/p0(red line) show a small deviation from simulations, which is persistent in the region of weakly selected mutations.
Rate offixation of deleterious mutations with no recombination
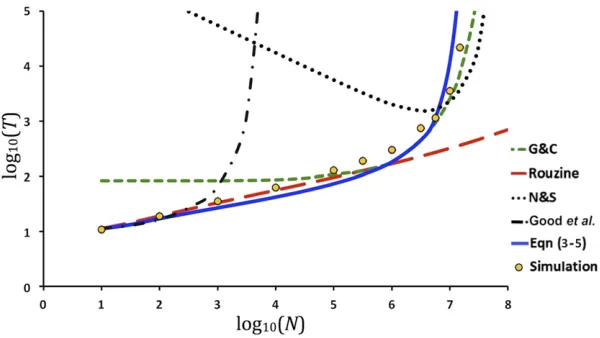
The rate offixation of deleterious mutations from our predic-tions provides a solution for the rate of advance of Muller’s ratchet in asexual populations. Table 1 and Figure 4 show simulation results and predictions for 1/T and T, respec-tively, using Equations 3–5 as well as equations by Gordo and Charlesworth (2000a,b), Rouzineet al.(2008), Neher and Shraiman (2012), and Goodet al.(2014) for the rate of progress of Muller’s ratchet (the different methods used are given inFile S1F). Predictions by Gordo and Charlesworth and Neher and Shraiman’s equations are appropriate when the rate offixation is low but produce underestimations of 1/T (Table 1) or overestimations ofT(Figure 4), particu-larly those of Neher and Shraiman, for scenarios with high fixation rate. This deviation is probably a consequence of the assumption that the proportion of individuals in the least-loaded class is exp[2U/s], which is the expectation for an in-finitely large population, but it deviates from the real value when the rate of fixation is high. The theory by Goodet al.
the range of scenarios considered, although provide biased estimates in the slow-ratchet regime.
Rate offixation of deleterious mutations with recombination
Predictions of asymptotic effective size and the rate offixation of deleterious mutations with Equations 3–5 for different genome lengths (L) are shown in Table 2 compared with simulations. In general, a satisfactory agreement is found be-tween predictions and simulations. The nonlinear relation-ship betweenNeandNcan also be observed from the table. For example, forU= 1,s= 0.01, andL#0.1,Neis around or below 100 both forN= 103and 104.
We can use the predictive Equations 3–5 to illustrate the general conditions for the mutational meltdown. Figure 5A shows the rate offixation relative to that for neutral genes (1/TU) for different population sizes and mutation effects. From thisfigure it becomes evident that there is a quick shift from significant rates offixation to nearly nullfixation rates as either Norsincrease. Therefore, the transition between the conditions under which fixation occurs, or not, can be effectively represented by a line, as shown in Figure 5, B and C. These show the lines of transition between conditions of significant accumulation of detrimental mutations and low rates of accumulation as a function ofL,U,s, andN. In asex-ual organisms (L= 0), the progress of the ratchet is strongly dependent on the mutation rate. For sexual species (L.0) the dependence on mutation rates is less conspicuous. Note, however, that these results refer to a model where there are only deleterious mutations, so they cannot be taken as general.
Prediction of the asymptotic Nefor a variable
distribution of mutation effects and heterogeneity of recombination rates
Predictions ofNefor a variable distribution of mutation ef-fects using Equation 6 are in good agreement with simula-tions in situasimula-tions either with or without recombination (Figure 6; continuous blue lines). On the opposite side, pre-dictions using the classical Equation 1 (red dashed lines), with the averagesinstead of the constant effects, are larger than observed Nevalues and the deviation increases for in-creasingN. This result was expected as the size of the least-loaded class is mainly dependent on the harmonic mean of the distribution of effects (Charlesworthet al.1993). Equa-tion 6 is in fact the harmonic mean of effects weighted by their contributions to the response to selection relative to the contributions in an equivalent but infinitely large population, that is, withoutfixations.
Now consider situations where recombination takes place atfixed hotspots (simulations shown as triangles and squares in Figure 6B), where predictions by Equation 7 are rather accurate. In this case, the average effective population size for the whole genome can be drastically reduced relative to that for evenly distributed recombination points. Moreover,
Ne becomes more independent on changes in N as the
proportion of events of recombination occurring at hot-spots increases.
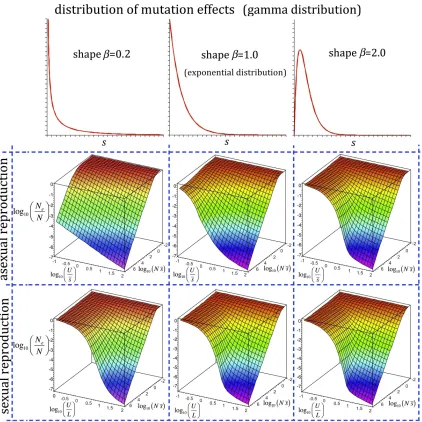
Finally, Figure 7 shows the ratioNe/Nfor a wide range of mutational effects, rates of mutation, and levels of linkage. The analysis indicates that Ne becomes very insensitive to increases in population size for an ample set of parameters, and this is more extensive with no recombination when the shape of the distribution becomes very leptokurtic (b= 0.2; Figure S1). In contrast, with a uniform recombination map, the shape of the distribution of effects has virtually no effect on the predictions ofNeand the general conclusion is thatNe and Nare approximately proportional when U/L , 1, but the proportionality tends to disappear as this ratio increases (Figure S1).
Discussion
When the effects of deleterious mutations are so small that there is a chance offixation, the preexistent equation forNe under background selection (Equation 1) does not hold. The reason is that the genetic variance, which is a variable in the equation, is reduced below the expectation for infinitely large populations. The prediction of the standing variance is com-plicated because it is dependent onNeitself: the genetic var-iance is dependent on the rate of fixation that, in turn, is dependent on Ne. We argued that the effective population size and the rate offixation of deleterious mutations can be jointly predicted by solving a system of two equations: a new equation for the asymptotic Ne that takes into account the fixation of deleterious mutations (Equation 3), and the well-known equation for the rate offixation of selected genes by Malecót (1952) and Kimura (1957) (Equation 5).
The solution found is rather general, covering sexual and asexual populations and is given in the same terms as the main developments on Ne, which facilitates the application to populations with particular genetic, temporal, or spatial structures. For sexual species, the equations allow for a prediction of the rate of fixation of deleterious mutations under different linkage levels, permitting a detailed assess-ment of the theoretical scenarios where mutation accumula-tion may lead to mutaaccumula-tional meltdown (Lynch and Gabriel 1990; Lynch et al. 1995; Whitlock and Bürger 2005). For asexual species, the equations are also an approximate solu-tion for the rate of advance of Muller’s ratchet. That is, the method proposed unifies the concepts of Muller’s ratchet and mutational meltdown (Lynchet al.1995)
(Lynch and Gabriel 1990; Charlesworth and Charlesworth 1997). Given that the distribution and density of the genetic variation remains constant at mutation-selection-drift equi-librium, this increment means that afixation of a detrimental gene occurs on average during the same time span. Following this rationale, our systems of Equations 3–5 provide reason-ably good approximations of the average time betweenfi xa-tionsTcovering a wide range of scenarios with the largest deviations in the slow-ratchet regime, wherefixations occur every many thousands or millions of generations. Probably, fluctuations offitness variance around the valueV, which is assumed to be constant in the model, lead to a loss of pre-cision that is critical in the region of very rarefixations.
We have extended the theory to a variable distribution of mutation effects (Equation 6), which provides predictions of the rate of decay in fitness. These predictions, as well as computations by Equation 7, assume that there is a single
Ne value that represents the drift process affecting all the spectrum of selective effects. This assumption can be approx-imately held as far as the population is at mutation-selection-drift equilibrium, which is the implicit condition in the derivation of the original equation for the probability offi x-ation by Kimura (1957). However, when selective sweeps of beneficial mutations are also included in the model,
muta-tions with different deleterious effects arefixed with proba-bilities that do not correspond to the same Ne value in Equation 5 (Messer and Petrov 2013). The reason for this is that selective sweeps induce large fluctuations in Ne over time, which obviously affect different deleterious mutations in different ways as given by Kimura’s equation:fixation rates of mutations with different deleterious effects are differen-tially affected asNefluctuates. Simulation results given inFile S1G andFigure S2illustrate these remarks.
Prediction ofNefor a variable distribution of effects is a fundamental problem, which has not been completely solved so far. Charlesworth et al.(1993) suggested the use of the harmonic mean of selection coefficients, but this solution cannot be readily applied to a continuous distribution of ef-fects that includes weakly selected mutations. Thus, Soderberg and Berg (2007) split the distribution into three parts (large, medium, and small effects) and assumed that only the Ne value corresponding to the large-effects part would deter-mine the probability of fixation of weakly selected muta-tions. As small effects are ignored, predicted Ne severely overestimates the real values. The solution given by Good
et al.(2014) is an adaptation for their theory for genetic
di-versity to a distribution of weak effects by substituting sby the squared root of the second moment of the distribution of Figure 5(A) Rate offixation relative to that if mutations were neutral (1/TU) whenL= 0.1 and U= 0.1 for different population sizes (N) and mutation effects (s). The thick line traces the level at 1/TU= 1023. (B and
C) Graphs showing the transition between conditions for a significant accumulation of detrimental mutations (area of predicted 1/TUvalues larger than 1023at the left side
of each line) and very low rates of accumu-lation (area of values smaller than 1023at
effects, but it is only applicable to weak effects. Here we showed that the harmonic mean provides a reasonably accu-rate solution when the reduction infitness variance due to fixation of deleterious mutations is considered.
We have argued that the ultimate probability offixation of deleterious mutations is dependent on the asymptotic effec-tive sizeNe. However, conceptually, thisNeis not the one to be included in the well-known equation for neutral diversity p= 2mNe. The prediction ofprequires a heterozygosity effec-tive size,NeH, which takes into account the differential in-tensity of the drift process acting on mutations that appeared at different generations backward in time. The value ofNeH can, however, be straightforwardly estimated with the ap-proach proposed (Equation 4).
The nonlinear relationship betweenNeandN, explicit in the predictive equation forNeaccounting for thefixation of deleterious mutations (Equation 3), may have an important consequence in our understanding of the genetic diversity in nature. A limitation attributed to the background selection model is the impossibility of explaining the relative homoge-neity of variation between species given the huge differences in census sizes across them. Genetic diversities at neutral sites of most eukaryotes and also most prokaryotes fall within a range of an order of magnitude (Lynch and Conery 2003;
Leffleret al.2012), while the average census sizes for entire
species surely differ in more than three orders of magnitude; showing that levels of polymorphism are quite insensitive to variation of population size (Lewontin 1974).
Several alternative or complementary explanations have been given for this paradox. One would be the greater impact of nonequilibrium demographic perturbations, such as a high variation in reproductive success, in species with large pop-ulation sizes, as shown by Romiguieret al.(2014). In a genome-wide diversity analysis of 76 nonmodel animal species, they showed that long-lived or low-fecundity species were genetically less diverse than short-lived or high-fecundity species, pointing toward this explanation of the Lewontin’s paradox.
An alternative explanation is the possible constrain in genomic variation imposed by natural selection, particularly in low recombination genome regions, viafixation of benefi -cial mutations and elimination of deleterious ones. A number of theoretical studies have found a nonlinearity between the heterozygosity effective size NeH and the census size N (Santiago and Caballero 1998, Gordo et al.2002, O’Fallon
et al.2010, Neher and Hallatschek 2013, Neheret al.2013,
Goodet al.2014, this article). From empirical data,
Corbett-Detig et al. (2015), analyzing genome diversity across 40 species, have shown that natural selection removes more variation at linked neutral sites in species with large popula-tion sizes (indirectly inferred from proxies such as body size and species range) than in those with lower population sizes, giving support to this explanation. The interpretation made by Corbett-Detiget al.(2015), however, has been argued by Coop (2016), who gives an alternative one pointing toward the idea that demographicfluctuations are the main determi-nants of the levels of diversity across species.
Preexistent equations forNeunder background selection are linear functions ofN(Hudson and Kaplan 1995; Nordborg
et al. 1996; Santiago and Caballero 1998; Nicolaisen and
Desai 2013), which has led to the consideration that genetic drift implies that neutral variation depends linearly on pop-ulation size (Gillespie 2000). However, the inclusion of the rate of fixation in Equation 3 introduces a nonlinear rela-tionship between Neand N: whenNes is 1 or lower, the ratioNe/Ndecreases for increasingN. To a similar extent, this also occurs for the heterozygosity effective size,NeH. For a model with a continuous distribution of deleterious effects in the range from 0 to 1, there will always be somesvalues for whichNes,1 for anyNeand, therefore, the ratioNe/N will no longer be strictly constant (Figure 6, Figure 7, and
Figure S1). In other words, strong reductions ofNvalues
lead weakly selected genes to be nearly neutral, reducing the impact of selection on the reduction ofNein a kind of buffering effect. Although weakly selected genes have a small contribution to the standing genetic variation, they are Figure 6 Predicted (lines) and ob-served (symbols) effective popula-tion sizes (Ne) for increasing
population size (N). The individual mutation rate isU= 0.2 and ef-fects follow an exponential dis-tribution with mean s = 0.05
½distribution of effects; fðsÞ ¼
expð2s=sÞ=s: The red dashed lines correspond to predictions using the classical Equation 1 that assumes a constantNe/Nratio. The
very relevant to the cumulative effect of selection onNe be-cause they can persist in the population for a long time. Thus, the simplification of considering a constant effect s results in the erroneous conclusion that the background selection model predicts a linear relationship between Ne and N, and this does not hold with the more realistic assumption that mutations effects are highly variable (Kousathanas and Keightley 2013).
The ratioNe/Ncan be affected by the shape of the distri-bution of mutation effects (parameterbof a gamma distri-bution inFigure S1). With asexual reproduction, the more leptokurtic the distribution of effects (the lowerb), the wider the spectrum of parameters where progressive increases inN
lead to lower increases of Ne, which is consistent with the observed loose dependence ofNeonNin nature. For sexual reproduction, the nonlinear relationship betweenNeandNis very evident whenU/L.10, irrespective of the shape of the distribution of mutational effects (Figure S1).
Note, however, that the direct application of the genome length in the predictive equations ofNe (3) and (6) assumes that recombination events occur with equal probability between adjacent deleterious sites evenly spaced over the genome. In contrast, most evidence suggests that recombination concen-trates in most species at particular hotspots (Myers et al.
2005; Berg et al. 2010; Greyet al.2011). Although there is variation in the location of the hotspots within and be-tween populations and over time (Anjali et al. 2011; Munchet al.2014), hotspots shape the structure of linkage disequilibrium in populations (Stump 2002; De La Vega
et al. 2005; Nishant et al. 2006; Lau et al. 2007) and,
therefore, they also probably determine how selected loci affectNeat neutral linked sites. In this article we have also derived an expression ofNein this scenario with some simpli-fying assumptions (Equation 7). The results indicate that the presence of recombination hotspots further reduces the ratio
Ne/N(Figure 5B).
Our equation of the effective size, therefore, states that there is a nonlinear relationship between NeandN, which may contribute to explain Lewontin’s paradox under the hypothesis that natural selection is a determinant of the level of variation across population sizes. However, this
effect is likely to be only part of the explanation, because rather restrictive scenarios (U/L .1) are needed for the nonlinearity betweenNeandNto have a drastic effect. Let us consider a numerical example using human data with a number of plausible parameters. First, it is generally as-sumed that recombination hotspots account for around 70% of recombination events (average numbers taken from Myerset al.2005 and the International HapMap Consortium 2007 based on a single population), but an in-depth analysis combining data from several populations predict that 95– 97% of all crossovers can be explained by hotspots (Khil and Camerini-Otero 2010). Thus, we shall assume that 97% of the30 M of the human genetic map are assigned to hot-spots and the remaining 3% is assigned at any other random sites. Second, from the analyses of sequence data, and by making assumptions about the fraction of the genome con-strained by selection, deleterious mutation rates for humans have been estimated to be of the order ofU= 1.1 per hap-loid genome (Keightley 2012). This is probably a lower bound as it disregards transposable elements subject to se-lection, insertions, and deletions, as well as adaptive muta-tions and weakly selected mutamuta-tions, which lead to an underestimation of the proportion of sites in the genome that are subject to negative selection (Lesecque et al.
2012). Although difficult to say, let us tentatively assume thatUis 103larger, as suggested by Reedet al.(2005). In a euchromatic genome with 3 Gb, a typical segment of 100 kbflanked by hotspots (this is the average segment size in a genome with 30,000 hotspots) could account for an average rate of mutation equal to 3.7 31024. Finally, the analysis from nonsynonymous mutations producing segre-gating amino acid polymorphisms in humans (Boykoet al.
2008) suggests a distribution of mutation effects close to a gamma distribution with shape parameterb= 0.2 and aver-age effects= 0.03. This estimated average effect is likely to be an overestimation, as it only accounts for amino acid-changing (nonsynonymous) mutations. Let us assume that a more re-alistic average is 103lower,s= 0.003. Under all these as-sumptions, i.e., by assigning parameters L = 30 M, m = 30,000,K= 0.97,U= 11,s= 0.003 andb= 0.2 to Equation 7, the ratiosNe/Nfor populations of sizeN= 102, 104, 106, and Figure 7 Representation of the ratio Ne/Ngiven as a function ofNsand
108areN
e/N= 0.930, 0.601, 0.136, and 0.018, respectively. This illustrates the nonlinear relationship betweenNeandN. The corresponding predictions of Ne/N using the previous Equation 1 are invariably 0.480.
However, if less extreme parameters are considered in the above example, then the nonlinear relationship betweenNe andNfades. For instance, ifUis assumed to be 1.1 ands= 0.03 keeping the other parameters invariant, the prediction of the ratiosNe/Nfor populations of sizeN= 102, 104, 106, and 108areN
e/N= 0.973, 0.937, 0.785, and 0.678, respec-tively. Thus, it seems to be that background selection could explain Lewontin’s paradox but only for some combina-tions of parameters that are in the limit of the range of present day estimations. It may well be, however, a different situation in other scenarios, such as selfing species, where the interrelation between inbred matings and selection drastically reduces the effective size (Santiago and Caballero 1995). This is, in fact, compatible with the results from Coop (2016), who found that the selective interpretation of Lewontin’s paradox could well apply to selfing species.
Summing up, the appropriate inclusion of the interac-tion between the effects of genetic drift and selecinterac-tion in the equations ofNeprovides a way to address some problems, particularly those related with the accumulation of dele-terious mutations, and modifies the predictions of genetic variation under the background selection model. In this context, the distribution of effects and the global pattern of recombination become determinants of the variation in natural populations. Estimating these parameters in real populations is important to assess if the background selec-tion model can effectively explain the observed homoge-neity of variation between species and maybe also within the genome (Gossmannet al.2011).
Acknowledgments
We thank Brian Charlesworth for useful discussions on the topic and Michael Desai and Benjamin Good for constructive comments on the manuscript and for providing valuable simulation data. This work was funded by Ministerio de Economía y Competitividad (CGL2012-39861-C02-01 and CGL2016-75904-C02), Xunta de Galicia (GPC2013-011), and Fondos Feder:“Unha maneira de facer Europa.”
Literature Cited
Anjali, G. H., A. Tandon, N. Patterson, Y. Song, N. Rohlandet al., 2011 The landscape of recombination in African Americans. Nature 476: 170–175.
Bell, G., 1988 Recombination and the inmortality of the germ line. J. Evol. Biol. 1: 67–82.
Berg, I. L., R. Neumann, K. W Lam, S. Sarbajna, L. Odenthal-Hesse
et al., 2010 PRDM9 variation strongly influences recombina-tion hot-spot activity and meiotic instability in humans. Nat. Genet. 42: 859–863.
Boyko, A. R., S. H. Williamson, A. R. Indap, J. D. Degenhardt, R. D. Hernandez et al., 2008 Assessing the evolutionary impact of
amino acid mutations in the human genome. PLoS Genet. 4: e1000083.
Charlesworth, B., 2012 The effects of deleterious mutations on evolution at linked sites. Genetics 190: 5–22.
Charlesworth, B., 2013 Background selection 20 years on: The Wilhelmine E. Key 2012 invitational lecture. J. Hered. 104: 161–171.
Charlesworth, B., and D. Charlesworth, 1997 Rapid fixation of deleterious mutations can be caused by Muller’s ratchet. Genet. Res. 70: 63–73.
Charlesworth, B., M. T. Morgan, and D. Charlesworth, 1993 The effect of deleterious mutations on neutral molecular variation. Genetics 134: 1289–1303.
Coop, G., 2016 Does linked selection explain the narrow range of genetic diversity across species? bioRxiv DOI:http://dx.doi.org/ 10.1101/042598.
Corbett-Detig, R. B., D. L. Hartl, and T. B. Sackton, 2015 Natural selection constrains neutral diversity across a wide range of species. PLoS Biol. 13: e1002112.
De La Vega, F. M., H. Isaac, A. Collins, C. R. Scafe, B. V. Halldórsson
et al., 2005 The linkage disequilibrium maps of three human chromosomes across four populations reflect their demographic history and a common underlying recombination pattern. Ge-nome Res. 15: 454–462.
Etheridge, A., P. Pfaffelhuber, and A. Wakolbinger, 2007 How often does the ratchet click? Facts, heuristics, asymptotics, pp. 365–390 inTrends in Stochastic Analysis, edited by P. M. Jochen Blath, and M. Scheutzow. Cambridge University Press, Cambridge, United Kingdom.
Felsenstein, J., 1974 The evolutionary advantage of recombina-tion. Genetics 78: 737–756.
Fisher, R. A., 1930 The Genetic Theory of Natural Selection. Oxford University Press, Oxford.
García-Dorado, A., 2007 Shortcut predictions forfitness proper-ties at the mutation–selection–drift balance and for its buildup after size reduction under different management strategies. Ge-netics 176: 983–997.
Gillespie, J. H., 2000 Genetic drift in an infinite population: the pseudohitchhiking model. Genetics 155: 909–919.
Good, B. H., A. M. Walczak, R. A. Neher, and M. M. Desai, 2014 Genetic diversity in the interference selection limit. PLoS Genet. 10: e1004222.
Gordo, I., and B. Charlesworth, 2000a The degeneration of asex-ual haploid populations and the speed of Muller’s Ratchet. Ge-netics 154: 1379–1387.
Gordo, I., and B. Charlesworth, 2000b On the speed of Muller’s Ratchet. Genetics 156: 2137–2140.
Gordo, I., A. Navarro, and B. Charlesworth, 2002 Muller’s Ratchet and the pattern of variation at a neutral locus. Genetics 161: 835–848.
Gossmann, T. I., M. Woolfit, and A. Eyre-Walker, 2011 Quantifying the variation in the effective population size within a genome. Genetics 189: 1389–1402.
Grey, C., P. Barthès, F. G. Chauveau-Le, F. Langa, F. Baudatet al., 2011 Mouse PRDM9 DNA-binding specificity determines sites of histone H3 Lysine 4 trimethylation for initiation of meiotic recombination. PLoS Biol. 9: e1001176.
Haigh, I., 1978 The accumulation of deleterious genes in a population—Muller’s ratchet. Theor. Popul. Biol. 14: 251–267. Hill, W. G., 1982 Rates of change in quantitative traits fromfi
x-ation of new mutx-ations. Proc. Natl. Acad. Sci. USA 79: 142–145. Hill, W. G., and A. Robertson, 1966 The effects of linkage on
limits to artificial selection. Genet. Res. 8: 269–294.
Hudson, R. R., and N. L. Kaplan, 1995 Deleterious background selection with recombination. Genetics 141: 1605–1617. International HapMap Consortium, 2007 A second generation human
Jain, K., 2008 Loss of least-loaded class in asexual populations due to drift and epistasis. Genetics 179: 2125–2134.
Keightley, P., 2012 Rates andfitness consequences of new muta-tions in humans. Genetics 190: 295–304.
Khil, P. P., and R. D. Camerini-Otero, 2010 Genetic crossovers are predicted accurately by the computed human recombination map. PLoS Genet. 6: e1000831.
Kimura, M., 1957 Some problems of stochastic processes in ge-netics. Ann. Math. Stat. 28: 882–901.
Kousathanas, A., and P. D. Keightley, 2013 Comparison of models to infer the distribution of fitness effects of new mutations. Genetics 193: 1197–1208.
Lande, R., 1995 Mutation and conservation. Conserv. Biol. 9: 782–791.
Lande, R., 1998 Risk of population extinction from fixation of deleterious and reverse mutations. Genetica 102/103: 21–27. Lau, W., T. Y. Kuo, W. Tapper, S. Cox, and A. Collins, 2007 Exploiting
large scale computing to construct high resolution linkage dis-equilibrium maps of the human genome. Bioinformatics 23: 517–519.
Leffler, E. M., K. Bullaughey, D. R. Matute, W. K. Meyer, L. Ségurel
et al., 2012 Revisiting an old riddle: What determines genetic diversity levels within species? PLoS Biol. 10: e1001388. Lesecque, Y., P. D. Keightley, and A. Eyre-Walker, 2012 A Resolution of
the Mutation Load Paradox in Humans. Genetics 191: 1321–1330. Lewontin, R. C., 1974 The Genetic Basis of Evolutionary Change.
Columbia University Press, New York.
Lynch, M., and W. Gabriel, 1990 Mutation load and survival of small populations. Evolution 44: 1725–1737.
Lynch, M., and J. Conery, 2003 The origins of genome complexity. Science 302: 1402–1404.
Lynch, M., J. Conery, and R. Bürger, 1995 Mutational meltdowns in sexual populations. Evolution 49: 1067–1080.
Malecót, G., 1952 Les processus stochastiques et la méthode des fonctions génératrices ou caracteréstiques. Publ. Inst. Stat. Univ. Paris 1: 1–16.
Messer, P. W., and D. A. Petrov, 2013 Frequent adaptation and the McDonald-Kreitman test. Proc. Natl. Acad. Sci. USA 110: 8615– 8620.
Myers, S., L. Bottolo, C. Freeman, G. McVean, and P. Donnelly, 2005 A fine-scale map of recombination rates and hotspots across the human genome. Science 310: 321–324.
Muller, H. J., 1932 Some genetic aspects of sex. Am. Nat. 66: 118–138.
Munch, K., T. Mailun, J. Y. Dutheil, and M. H. Schierup, 2014 A
fine-scale recombination map of the human–chimpanzee ancestor reveals faster change in humans than in chimpanzees and a strong impact of GC-biased gene conversion. Genome Res. 24: 467–474. Neher, R. A., and B. I. Shraiman, 2012 Fluctuations of fitness distributions and the rate of Muller’s ratchet. Genetics 191: 1283–1293.
Neher, R. A., and O. Hallatschek, 2013 Genealogies of rapidly adapting populations. Proc. Natl. Acad. Sci. USA 110: 437–442.
Neher, R. A., T. A. Kessinger, and B. I. Shraiman, 2013 Coalescence and genetic diversity in sexual populations under selection. Proc. Natl. Acad. Sci. USA 110: 15836–15841.
Nicolaisen, L. E., and M. M. Desai, 2013 Distortions in genealo-gies due to purifying selection and recombination. Genetics 195: 221–230.
Nishant, K. T., C. Kumar, and M. R. Rao, 2006 HUMHOT: a da-tabase of human meiotic recombination hot spots. Nucleic Acids Res. 34: D25–D28.
Nordborg, M., B. Charlesworth, and D. Charlesworth, 1996 The effect of recombination on background selection. Genet. Res. 67: 159–174.
O’Fallon, B. D., J. Seger, and F. R. Adler, 2010 A continuous-state coalescent and the impact of weak selection on the structure of gene genealogies. Mol. Biol. Evol. 27: 1162– 1172.
Reed, F. A., J. M. Akey, and C. F. Aquadro, 2005 Fitting back-ground-selection predictions to levels of nucleotide variation mutation load in humans and divergence along the human au-tosomes. Genome Res. 15: 1211–1221.
Robertson, A., 1961 Inbreeding in artificial selection programmes. Genet. Res. 2: 189–194.
Romiguier, J., P. Gayral, M. Ballenghien, A. Bernard, V. Cahais
et al., 2014 Comparative population genomics in animals un-covers the determinants of genetic diversity. Nature 515: 261– 263.
Rouzine, I. M., E. Brunet, and C. O. Wilke, 2008 The traveling-wave approach to asexual evolution: Muller’s ratchet and speed of adaptation. Theor. Popul. Biol. 73: 24–46.
Santiago, E., and A. Caballero, 1995 Effective size of populations under selection. Genetics 139: 1013–1030.
Santiago, E., and A. Caballero, 1998 Effective size and polymor-phism of linked neutral loci in populations under selection. Ge-netics 149: 2105–2117.
Soderberg, R. J., and O. G. Berg, 2007 Mutational interference and the progression of Muller’s ratchet when mutations have a broad range of deleterious effects. Genetics 177: 971–986. Stephan, W., L. Chao, and J. G. Smale, 1993 The advance of
Muller’s ratchet in a haploid asexual population: approximate solutions based on diffusion theory. Genet. Res. 61: 225–231. Stump, M. P., 2002 Haplotype diversity and the block structure of
linkage disequilibrium. Trends Genet. 18: 226–228.
Wang, J., E. Santiago, and A. Caballero, 2016 Prediction and estimation of effective population size. Heredity (Edinb).117: 193–206.
Whitlock, M. C., and R. Bürger, 2005 Fixation of new mutations in small populations, pp. 155–170 inEvolutionary Conservation Biology, edited by R. Ferrière, U. Dieckmann, and D. Couvet. Cambridge University Press, New York.
Wright, S., 1931 Evolution in Mendelian populations. Genetics 16: 97–159.
Figure S1.
Ratio
N
e/
N
given as a function of
and either
with asexual
reproduction or
U
/
L
with sexual reproduction for three different distributions of effects.
The surface plot was calculated using eqn (6). The distributions of effects correspond to
a gamma distribution with parameter shape
β
= 0.2, 1 and 2.
Figure S2.
Effective population sizes inferred from the observed frequencies of fixation
of deleterious mutations using eqn (5). The rates of mutation of four effects (
s
= 0.0001,
0.0002, 0.0005 and 0.0010) occurred at the same rate (
U
= 0.00025 mutations per
haploid individual for each effect) for population sizes
N
= 2000 (black triangles), 5000
(red squares) and 10000 (blue circles). Error bars are 95% confidence intervals
calculated over twelve replicates. (A) Beneficial mutations are not considered. No
tendency is found in this case for
N
eto decrease over increasing values of
s
. (B)
1
Supporting Information
Joint prediction of the effective population size and the rate of fixation of
deleterious mutations
2
SUPPLEMENTAL MATERIAL
SUPPLEMENTAL FILE 1
(A) Basics on the theory of
N
eand the variance of the long-term contributions.
The well-known equation by Wright (1938) for the effective size of a diploid population
in terms of the variance of family size
S
k2(with 2 descendants per family on average)
and the census size of reproducers
N´
(the prime stands for diploids)
is
2
4
2
e
k
N
N
S
ʹ
ʹ
=
+
.
The inclusion of the term
S
k2allows for some insights on the interaction between
selection and drift. Without selection and random reproduction of parents, the
distribution of family size is expected to follow a Poisson distribution (
S
k2= 2) and the
equation reduces to
N
e´
=
N´
. But under selection, the variance of family size increases
over this value causing a reduction in
N
e’
below the census size. However, this equation
does not hold when selection acts on an inherited trait because changes in gene
frequencies are correlated in consecutive generations.
The seminal work by Alan Robertson (1961) first considered the effect of
artificial selection on the rates of inbreeding in diploid populations in a model of
unlinked genes (see Hill [2007] for a historical review). When selection acts on an
inherited quantitative trait, selective advantages of families are transmitted to
descendants across generations. With additive gene action and random mating, the
initial advantage of any family is expected to halve in each consecutive generation since
recombination rate between any pair of loci is
r
= 1/2. Because of the linear relationship
between selective advantages (fitness) and the expected changes in frequency of a focal
neutral gene in association with some families, the expected total change in frequency
relatively to the change in the initial generation will then accumulate as
Q
(1)= 1 (the
change in the initial generation),
Q
(2)= 1 + 1/2 (the expected total change in the two first
generations),
Q
(3)= 1 + 1/2 + 1/4 (the change in three generations), … to a long-term
cumulative value of
Q
=
Q
(∞)= 2. As the effective population size is a function of the
3
inherited fitness (with average fitness = 1), the total variance of change will increase by
a factor
Q
2= 4, and the equation for
N
e’
is
2 2 2
4
2
4
e
k
N
N
S
Q C
ʹ
ʹ
=
+
+
,
where
S
k2refers to the variance of non-inherited contributions of families and the “4”
multiplying
Q
2C
2is a scaling factor from variance of inherited relative fitness (mean 1)
to variance in offspring number due to inherited differences between families (2
descendants for diploids on average). In what follows, we will assume that descendants
are randomly sampled from families with probabilities proportional to their fitness
values and that these fitness values are genetically determined, that is
S
k2= 2. Thus, the
equation reduces to
2 2
1
e


![Table 1 Simulation results and predictions of the rate of fipopulation size (of deleterious mutations [(1/xationT) 3 100] for different values ofN), mutation rate (U) and effect of mutations (s)](https://thumb-us.123doks.com/thumbv2/123dok_us/1526495.1187142/6.603.49.294.79.283/simulation-predictions-population-deleterious-mutations-different-mutation-mutations.webp)