Department of Mechanical Engineering, Magna College of Engineering, Chennai-600055, India.
Measuring Manufacturing Operation Using
Balanced Scorecard - A Case Study
I S Stephan Thangaiah
1, Vinay Sharma
2, V N Sundharam
3Principal & Professor, Dept of Mechanical Engineering, Magna College of Engineering, Chennai, Tamil Nadu, India1 HOD and Professor, Dept of Industrial Engineering, Birla Institute Technology, Ranchi, Jharkand, India2
Management Consultant, Futurenet Technology India Private Limited, Chennai, India 3
ABSTRACT: Manufacturing industries have difficulty in keeping pace with corporate reality because the business horizon is changing and becoming more complex with many boundaries. Traditionally industries performance is measured based on cost accounting systems to control, monitor, and improve the operations. However it does not address overall performance measurements and future growth strategy. Hence it is essential to focus on complete systems optimization and addressing the dynamics of changing systems instead of only supporting activities improvements. It needs to look again how the company‟s performance is measured and reported. Reengineering of business process is conceived as an approach in management, and redesigning the processes and activities of organizations with the purpose of achieving higher results. This paper is analyzing the key performance indicator of Beverage manufacturing industry operation‟s value chain usingBalanced scorecard and identifying critical factor which affects to achieve.
KEYWORDS: Business Process Reengineering; Value Chain Analysis; Performance Measurement; and Balanced
Scorecard.
I. INTRODUCTION
The way Industries have managed its day-to-day activities have changed. Executives have no time for mundane activities. Most of that goes in keeping a tab on cash flows and operational activities. Matrices and reports that were usually checked once in a week now get seen daily (Amit, R.R 2009). Industries will have to vigorously pursue the three internal sources for cash – earnings from operations, working capital (inventory and receivables) and saleable assets. Even the biggest industries plan to meet their cash requirement from operations. “We have taken steps to reduce our overheads ideas from internal sources to converse cash” says Karl Slym, president and managing director of General Motors. Operational efficiency can be shored up by reducing the breakeven point. At a time when demand is an unpredictable, fixed costs need to be brought down. And this has caused the paradigm shift. Industries have brought down rents, trimmed wage and travel bills, consolidated operations, sold off non-core businesses, brought in supply chain efficiencies and reined in interest payouts- all to prevent unnecessary cash burn (Bhupesh et al., 2009). As per the study conducted by business standard research bureau the operating profit rose by 20 per cent because Industries curtailed total expenditure by about 7 per cent. “A large number of companies have cut their inventory-right from raw materials and work in progress to finished goods and achieved anywhere from 10 to 15 per cent inventory cut is what manufacturing” , Deloitte India Director K Kumar.
Department of Mechanical Engineering, Magna College of Engineering, Chennai-600055, India.
operational reengineering entails a departure from familiar norms and requires major changes in how departments conduct their work and related to one another. It is truly deep change, affecting the very essence of a company: how its work is done. The effects of operational reengineering ripple outward to all aspects of the enterprise, from measurement and reward systems and job designs to organizational structure and managerial roles (Hammer, M. 2004). It is essential to focus on monitoring and controlling to promote overall systems optimization and addressing the dynamics of changing systems instead of supporting process improvements. Manufacturing industries have to adopt themselves to the changing conditions and evaluate their Key Performance Indicator; KPI with Balanced Scorecard; BSC. To succeed, industries have to ensure the smooth operation at the time of sustainable growth of the business.
II. LITERATURE REVIEW
2.1BUSINESS PROCESS REENGINEERING (BPR)
About two decade ago all leading corporate have been engaged in a relentless effort to improve the performance of their business. Pressured by suddenly powerful international competition and ever more demanding customers, companies embarked on crusades to lower costs, improve productivity, increase flexibility, shrinking cycle times, and enhance quality and service. Companies rigorously analyzed their operations, dutifully installed the newest technological advances, applied the latest management motivational techniques, and sent their people through all fashionable training programs- but to little avail. Business reengineering in many ways is a natural evolution and practical strategic application of a number of management approaches that recently have made an impact on the mangers look at end change organizations. Such approaches include TQM, Time-Based competition, customer focus and more recently BPR. BPR is a holistic approach that can provide a process, to link the competitive strategy of an organization to its people and processes, a linkage enhanced by using the information and communication technology available today. The difference that BPR has from other approaches is that it radically changes the way an organization works, it achieves large improvements, and it is very difficult to do well (Hammer, M. 2003).
All
organizations need to change to remain competitive, to embrace the technology of the day, and to get the best out of the improved abilities of their people. They also need to achieve a state of continual change. Organizations that successfully manage to reengineer themselves find that not only do they achieve dramatic short-term results. They also turn themselves into flexible organization that continues to change. A high reliance is placed on an open, informal culture, with excellent communication, backed by a high degree of information and communication technology. The teams are networked using IT, and the organization links the strategy, technology, and people into a triangle model that ensures flexibility and responsiveness to change (Nick O,1994).
Hammer, M (2003) defines “BPRis not the elimination of jobs; it is the elimination of non-value-added work. As this work disappears, jobs often go along with it, transforming the organization into leaner and more efficient enterprise. But what happens next? Only hopelessly unimaginative companies will remain in their newly reduced circumstance. The rule for business enterprises, as for all forms of life, is to grow or die. And as new efficiencies make them more competitive, they will grow and add jobs. A long record of growth in sales, earnings, and dividends indicates that a company will continue to be successful. The foundation of this theory is that consistent financial performance reflects enduring operational strengths that financial results do not come about by themselves but as byproducts of operational excellence. Operations are still the essence and finance the manifestation, but the past no longer predicts the future. The way of doing business that accounted for past financial success will not necessarily lead to similar results in the future. Indeed in a world of constant, rapid change, what accounts for yesterday‟s success may be the very thing that produces tomorrow‟s failure.”
2.2VALUE CHAIN
Department of Mechanical Engineering, Magna College of Engineering, Chennai-600055, India.
as an integrated organization (Barry Mills, 2001). The value chain is a graphical representation of a firm‟s activities, arranged in such a way as to show the sequence of these activities. The value chain provides a powerful framework for identifying and appraising the resources and capabilities of a firm, in part because it emphasizes the linkages between the different activities, and also because it facilitates comparisons between firms, regarding both individual activities and structuring of activities (Philip Sadler, 2004). In a complex manufacturing environment with challenging product life cycles, collaboration across the industry, value chain is a key element for creating successful business propositions. Optimizing the value chain can result in increased revenue, decreased inventory levels and improved operational effectiveness (CEM , 2003).
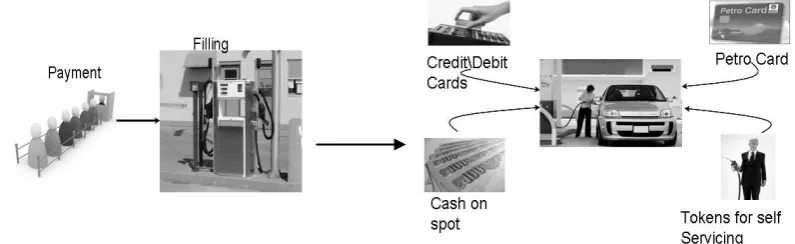
Development of information and communication technology removed all barriers such as time and distance. Information is now able to link cross-company functions as well as provide value-chain linkage from raw materials to final customer usage (Upton and McAfee, 1996). IT has opened a whole new opportunity for manufactures to offer customized products faster, cheaper, and more cost effectively using “build-to-order” techniques facilitated by internet (Prahalad, C.K. and VenkatRamaswamy, 2006).Every process is liable to change because of the development of information technology and communication. People once were standing in a long queue for booking their ticket either cinema, bus, train, and air travel can book anywhere in the universe. Figure 1 shows the process value chain of petrol filling operation. It was pay and fill process changed to fill and pay. It is changed to process as you like while the business remain same. Payment value chain is extended from cash to cheque, credit/debit/petro card, and coupon. Each change in process added value to customer and process owner. It has increased the speed, time, and quality. Customer has variety of choice to choose product like petrol, premium, hi-speed, extra premium etc. To survive in the market and increase customer base companies are striving hard to innovative the process while the task remains same.
Fig 1 : Petrol filling business process value chain
2.3BALANCED SCORECARD
Tools like Activity-based Costing and Management; ABC, Economic Value Added; EVA, Quality Management; QM, Customer Value Analysis/Customer Relationship Management; CVA/CRM, Performance prism, and Balanced Scorecard; BSC are used to measure industry performance. While firms will likely benefits from ABC, the system is mainly an accounting and cost-based method of viewing and analyzing an organization and its activities. ABC also lacks the strategic and nonfinancial elements that are captured in the BSC. EVA is a financial performance metric that is most directly linked to the creation of shareholder value over time. EVA is being a very complex framework that relies on complicated calculations. The “cost of capital” is particularly difficult to calculate and prone to errors that lead grossly misleading results. Although Quality Programs focus a firm on continuous improvement, they are not well suited to measuring relative performance among differing enterprises in different industries. CVA/CRM techniques are enabling businesses to improve performance, to measure that improvement, and to focus a firm on value of its customer with better data integration and, hence, better measurement regarding customers. However they fail to account for important noncustomer aspects of a business. BSC measures performance across a number of different perspectives – a financial, customer, internal business process and an innovation and learning (Christian, C. Johnson. 2007) .
Department of Mechanical Engineering, Magna College of Engineering, Chennai-600055, India.
your business to succeed, you need a way to consider the factors that influence the overall performance (Frank Buytendijk, 2008). BSC represents a first step in holistic thinking by recognizing the existence and importance of the full breath of operational aspects of business and the idea of measuring future potential (Eric, W. 1998). BSC offers a mean to maintain balance between financial and nonfinancial measures and connect strategic and operational standards. It is based on the critical success factors, objectives, performance measures, targets, improvement actions discussed (Rampersad, H.K. 2003). Most companies operational and management control systems are built around financial measures and targets, which bear little relation to the company‟s progress in achieving long-term strategic objectives. Thus the emphasis most companies place on short-term financial measures leaves a gap between the development of a strategy and its implementation (Kaplan, R S. and Norton D P. 1996a). The concept of BSC provides a balanced picture of current operating performance as well as the driver of future performance (Kaplan, R S. and Norton D P. 1996b). BSC facilitates activities with value-adding potential, such as making strategy operational by translating strategy into action; focusing the entire organization on what must be done to create breakthrough performance; acting as an integrating device, an umbrella, for a variety of diverse, often disconnected corporate programmes such as quality, reengineering, process redesign, and customer service; translating corporate level measures into at lower levels in the organization so that local managers, operators, and employees can see what they must do well in order to improve organization effectiveness; and provide a comprehensive view that overturns the traditional idea of the organization as a collection of isolated, independent functions, and departments (Shanahan, Y.P. 2006).
III.CASE STUDY
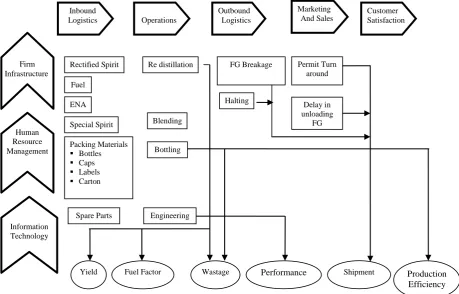
A study was conducted on a leading beverage manufacturing industry in Chennai, Tamil Nadu. The major operations are re-distillation, bottling, packing and shipment. The cost production consists of spirits -35%, packing materials-30%, power -10%, fuel-15% , over heads 10%. Figure 2 shows the industry value chain.
Fig 2 :Beverage Industry Operation Value Chain
Marketing And Sales
Firm Infrastructure
Human Resource Management
Information Technology
Rectified Spirit
ENA
Special Spirit
Packing Materials
Bottles
Caps
Labels
Carton Fuel
Spare Parts
Blending
Bottling
FG Breakage
Halting
Permit Turn around
Fuel Factor Wastage
Yield Performance Shipment Production
Efficiency
Engineering Re distillation Operations
Outbound Logistics
Customer Satisfaction Inbound
Logistics
Delay in unloading
Department of Mechanical Engineering, Magna College of Engineering, Chennai-600055, India.
The key performance indicators(KPI) are identified. As per the value chain industry should focus on controlling inventory, improving the yield, improving the fuel efficiency, reduce the permit turnaround time and transit breakage.
IV. RESULT AND DISCUSSION
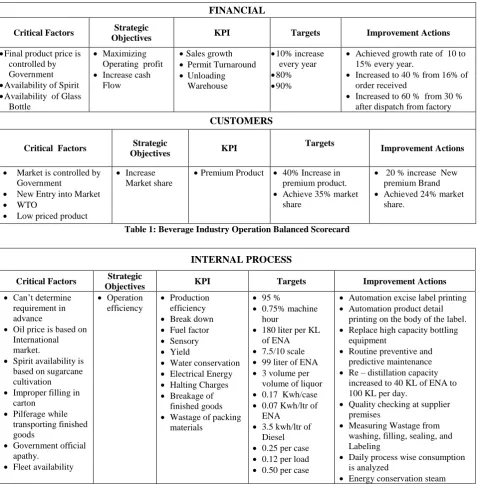
The industry has carried out several reengineering process changes from time to time to achieve its strategy. The critical factors are analysed and balanced scorecard is used to measure the KPI and targets. Table 1 and 2 explains the industry KPI achievement.
FINANCIAL
Critical Factors Strategic
Objectives KPI Targets Improvement Actions
Final product price is controlled by Government Availability of Spirit Availability of Glass
Bottle
Maximizing Operating profit Increase cash
Flow
Sales growth Permit Turnaround Unloading
Warehouse
10% increase every year 80% 90%
Achieved growth rate of 10 to 15% every year.
Increased to 40 % from 16% of order received
Increased to 60 % from 30 % after dispatch from factory
CUSTOMERS
Critical Factors Strategic
Objectives KPI
Targets
Improvement Actions
Market is controlled by Government
New Entry into Market
WTO
Low priced product
Increase Market share
Premium Product 40% Increase in premium product. Achieve 35% market
share
20 % increase New premium Brand Achieved 24% market
share.
Table 1: Beverage Industry Operation Balanced Scorecard
INTERNAL PROCESS
Critical Factors Strategic
Objectives KPI Targets Improvement Actions
Can‟t determine requirement in advance
Oil price is based on International market.
Spirit availability is based on sugarcane cultivation Improper filling in
carton Pilferage while
transporting finished goods
Government official apathy.
Fleet availability
Operation efficiency
Production efficiency Break down Fuel factor Sensory Yield
Water conservation Electrical Energy Halting Charges Breakage of
finished goods Wastage of packing
materials
95 %
0.75% machine hour
180 liter per KL of ENA 7.5/10 scale 99 liter of ENA 3 volume per
volume of liquor 0.17 Kwh/case 0.07 Kwh/ltr of
ENA 3.5 kwh/ltr of
Diesel 0.25 per case 0.12 per load 0.50 per case
Automation excise label printing Automation product detail
printing on the body of the label. Replace high capacity bottling
equipment
Routine preventive and predictive maintenance Re – distillation capacity
increased to 40 KL of ENA to 100 KL per day.
Quality checking at supplier premises
Measuring Wastage from washing, filling, sealing, and Labeling
Daily process wise consumption is analyzed
Department of Mechanical Engineering, Magna College of Engineering, Chennai-600055, India.
Turbine is installed
KNOWLEDGE AND LEARNING
Critical Factors Strategic Objectives KPI Targets Improvement Actions
Senior Management personnel are retiring within a year time. Job opportunity is
more due to economy
Employee Satisfaction Decision making power Environmental free
atmosphere
Accidental free Periodical training in
Safety, Quality, and Environment 10 % Attrition
5 % Attrition SAP Implemented Workmen Involved
in Safety and Water conservation committee.
Table 2: Liquor Industry Operation Balanced Scorecard
V. CONCLUSION
Reengineering requires a cross-functional effort usually involving innovative application technology. Reengineering is an attempt to change the way work is performed by simultaneously addressing all the aspect of work that impact performance. This includes the process activities, people‟s jobs and reward systems, and the roles of process performers and managers, the management systems and the underlying corporate culture that holds the beliefs and values that influence everyone‟s behavior and expectation. Reengineering makes a significant break with previous performance improvement approaches by requiring a high level of state-of-the-art IT awareness among the entire reengineering team prior to, rather than after, the definition of process changes or improvements. Value chain analysis links each process of the operation changes, measure, and evaluate. It improves productivity, cost reduction and profitability. The expected improvements are very much drastic in equipment efficiency, quality, down time, inventory cost, and shipment.
Company needs to understand and measure the value which it derives from its entire key performance indicator. BSC mechanize the process of decision-making and minimize human judgment are equally critical to ensure that the growth strategy remains on track. Simple holistic performance evaluation helps a company to understand its major critical factors of its future growth. The BSC frame work is defined for this liquor industry and it will vary based on industry nature.
REFERENCES
1. AmitRanjanRai. (May,2009) „The Ceo‟s New Tasks‟, Indian Management Journal, pp 12 -22.
2. Barry Mills (2001), “Sustaining European Economies through Competitive Manufacturing – a Key Issues Perspective from the Aerospace Industry” Manufacturing Visions Conference
3. BhupeshBhandari, and AnandPandey, and Syantanikar. (July,2009) „India INC Saves‟, Indian Management Journal, Vol. 48, No. 7, pp 12 -22 4. Christian C Johnson (2007) Balanced Scorecard for State Owned Enterprises, Asian Development Bank, Philippine
5. Ernst & Young. (July, 2009) „On the Right Track‟, Indian Management Journal, pp 80-89.
6. European Contract Electronic Manufacturing (CEM) Industry value chain Analysis http://www.Researchandmarkets.com/reports/480636 7. Frank Buytendijk, (2008), „Zen and the Art of the Balanced Scorecard‟ Enterprise Performance Management, Oracle Corporation pp 1-3
8. Eric Wolstenholme , (1998) „Balanced Strategies for Balanced Scorecards: The Role of System Dynamics in supporting Balanced Score Cards and Value Based Management, International System Dynamics Conference.
9. Kaplan, R S. and Norton, D P. (Jan-Feb 1996a) „Using the balanced scorecard as a strategic Management System”, Harvard Business Review, pp 75-85 10. Kaplan, R S. and Norton, D P. FALL (1996b),‟ Linking the Balanced Scorecard to Strategy‟, alifornia Management Review Vol. 39, No. 1, pp 53-79 11. Michael Hammer (2003),”Beyond Reengineering”, Profile books ltd, London, ISBN 1-86197-518-X
12. Hammer, M. (2004) „Deep Change: How Operational Innovation Can Transform Your Company‟, Harvard Business Scholl Publication, pp 1 -12. 13. Michael E Porter (2004), “The Competitive Advantage” First Free Press Export Edition , NewYork.
14. Nick Obolensky , (1994), Practical Business Re-Engineering Techniques for Effective Change, Gulf publishing company , Texas. 15. Philip Sadler (2004) Strategic Management, Kogan Page India Pvt Limited, New Delhi.