ISSN(Online): 2320-9801
ISSN (Print): 2320-9798
I
nternational
J
ournal of
I
nnovative
R
esearch in
C
omputer
and
C
ommunication
E
ngineering
(An ISO 3297: 2007 Certified Organization)
Vol. 3, Issue 7, July 2015
Segmentation Method for Automatic Leaf
Disease Detection
Darshana A.1, Dr. Jharna Majumdar2, Shilpa Ankalaki3
Post Graduate Student, Dept. of CSE, NMIT, Bangalore, Karnataka, India1 Dean R&D, HOD CSE (PG), Dept. of CSE, NMIT, Bangalore, Karnataka, India2
Assistant Professor, Dept. of CSE, NMIT, Bangalore, Karnataka, India3
ABSTRACT: Present paper is an attempt to automatically detect leaf diseases. Automatic Detection of Leaf Disease is
an essential research topic in agricultural research as it may prove benefits in monitoring fields, and early detection of leaf diseases by the symptoms that appear on the leaves. This paper provides various methods for leaf disease detection using Image Processing. The developed system consists of Image Acquisition, Image Pre-Processing, Image Segmentation and Feature Extraction. Image Pre-Processing involves HSI transformation, RGB splitting. Image Segmentation involves selecting best segmentation method among Region based segmentation and Mean-Shift Segmentation based on Quality Metric Parameters, Histogram analysis and Computational Time analysis. Feature extraction involves extracting morphological and color features for each disease spot.
KEYWORDS: Region Based Segmentation Methods; Mean-Shift Segmentation Method; Quality Metric Parameters;
Hue Value Feature Extraction;
I. INTRODUCTION
India is an agriculture country. Major portion of India’s population depend on agriculture as food source and also as an economical income. Agriculture crops suffer losses due to diseases that affect plant leaves, crops, stem and so on. [1] The conventional way of leaf disease identification and detection is naked eye observation by experts to detect the leaf disease by the symptoms that appear on the leaf. The naked eye observation requires continuous monitoring and is not feasible for monitoring large farms. Hence, automatic detection of leaf disease is required. Automatic detection of leaf disease is an essential research topic in agricultural research as it may prove benefits in monitoring fields and early detection of leaf diseases.
Image segmentation refers to the process of partitioning a digital image into multiple regions (sets of pixels). The result of image segmentation is a set of regions that collectively cover the entire image, or a set of contours extracted from the image.Each pixel within a region is uniquely similar with respect to some characteristic or computedproperty, such as colour, intensity, or texture, depth, or motion. Pixels from adjacent regions are significantly different with respect to the same characteristic(s). This makes the object differentiation, isolation and detection task easier. Image segmentation is one of the primary steps in image analysis for object detection, recognition and identification.
Image Segmentation algorithms are based on two principles: discontinuity and similarity. The principle of discontinuity is to extract regions that differ in properties such as intensity, color, texture etc. In the principle of similarity pixels are grouped together to form regions based on some pre-defined criteria. Thresholding based segmentation, clustering based segmentation, Region based segmentation are some of the Similarity based segmentation methods.
The Segmentation algorithms can be classified based on pixel similarity relationship with neighbouring pixels as: region-based algorithms and pixel-based algorithms.
ISSN(Online): 2320-9801
ISSN (Print): 2320-9798
I
nternational
J
ournal of
I
nnovative
R
esearch in
C
omputer
and
C
ommunication
E
ngineering
(An ISO 3297: 2007 Certified Organization)
Vol. 3, Issue 7, July 2015
iii. From the extracted disease regions, the features (morphological, color) are extracted. iv. Using the extracted features the disease is identified using classification methods.
II. VARIOUS SEGMENTATION METHODS
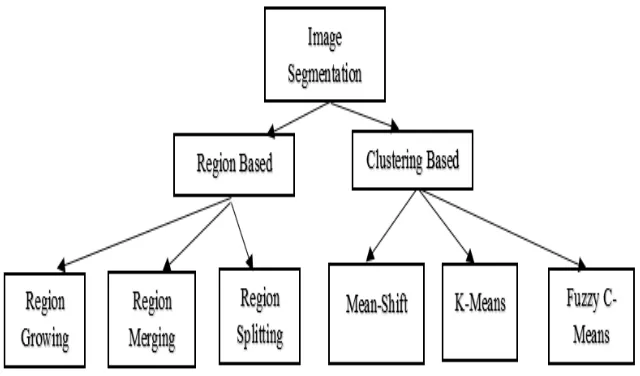
The fig 1 shows the types of segmentation methods used:
Fig 1: Image Segmentation Methods
A. A.Region Based Segmentation Methods
A region denoted by ‘r’ of an image is defined as a connected homogenoussetofthe image with respect to some criterion such as grey level or texture. Regions in an image are a group of connected pixels with similar properties. In the region approach, each pixelis assigned to a particular object orregion. In this segmentation, pixels corresponding to an object are groupedtogether andmarked.
The Main Methods of Region Segmentation [3] are Region Growing, Region Splittingand RegionMerging.
1) Region Growing Segmentation
Regiongrowingisatechniqueforextractingaregionoftheimagethatisconnected
basedonintensityinformation.InRegiongrowingneighbouringpixelsareexaminedand added to a region class of number of edges aredetected.Intensity image of input image is used for region growing segmentation.
Algorithm – Region Growing
Input: Color Image
Output: Greyscale Segmented image STEPS:
1. Consider the input RGB image. Convert the RGB image into HSI image and consider I buffer. 2. Assign a seed pixel for the input image. Histogram peak value is chosen as the pixel.
3. Fix a homogeneity criterion as the similarity variation tolerance (threshold) which is computed using standard deviation formula.
4. Consider the seed pixel and compare its 8-neighbors with the threshold value. Suppose, the value is less than the threshold, the pixels are added to the existing regions. Otherwise, it forms another region.
Repeat the procedure until every pixel in the frame belongs to any one of the region.
2) Region Merging Segmentation
ISSN(Online): 2320-9801
ISSN (Print): 2320-9798
I
nternational
J
ournal of
I
nnovative
R
esearch in
C
omputer
and
C
ommunication
E
ngineering
(An ISO 3297: 2007 Certified Organization)
Vol. 3, Issue 7, July 2015
subdivide the strips further. In the worst case the seed will be a single pixel. Once a seed has been found, its neighbours are merged until no more neighbouring regions conform to the uniformitycriterion. At this point the region is extracted from the image, and a further seed is used to merge another region.
Algorithm – Region Merging
Input: Color Image
Output: Greyscale Segmented image STEPS:
1. Consider an input RGB image and convert the RGB image into HSI image and consider I buffer and find its image matrix.
2. Begins the segmentation process with regions of 2x2, 4x4 or 8x8 blocks of pixels.
3. Compare the statistical grey level properties of each block with the adjacent block; if they match, they are merged into a larger region. Otherwise regions are marked as non-matching.
4. Merging of adjacent regions continues between all neighbors, including newly formed ones. If a region cannot be merged with any of its neighbors, it is marked as ‘final’ and the merging process stops when all image regions are so marked.
3) Region Splitting Segmentation
These algorithms begin from the whole image, and divide it up until each sub region is uniform. The usual criterion for stopping the splitting process is when the properties of a newly split pair do not differ from those of the original region by more than a threshold.
Algorithm – Region Splitting Input: Color Image
Output: Greyscale Segmented image STEPS:
1. Consider an input RGB image and convert the RGB image into HSI image and consider I buffer. Find the image matrix of the ‘I’ buffer.
2. Assume the whole image as a single region.
3. Calculate the maximum and minimum intensity values.
4. If the difference between minimum and maximum value is greater than the predetermined threshold then split the existing region into new regions.
5. Check if all the pixels contained in each of the regions satisfy the similarity constraint. If TRUE, then the area of interest corresponds to existing region. If FALSE split the area of interest (usually into four equal subareas) and consider each of the sub-areas as the area of interest in turn.
6. This process continues until no further splitting occurs. In the worst case this happens when the areas are just one pixel in size.
B. B. Mean-Shift Image Segmentation
Mean Shift method is a data clustering method. For each data point, mean-shift defines a window around it and computes the mean of data point, then it shifts the center of the window to the mean and repeats the algorithm till it converges. The Mean-Shift algorithm works based on the histogram of the image.
Algorithm – Mean-Shift Image Segmentation
Input: Color Image
Output: Greyscale Segmented image STEPS:
The idea of Mean-Shift is to start with windows centered on a random bin and shift the center of the bin according to the data within it until the window converges at the mode of the histogram.
The shifting of the window is as follows:
ISSN(Online): 2320-9801
ISSN (Print): 2320-9798
I
nternational
J
ournal of
I
nnovative
R
esearch in
C
omputer
and
C
ommunication
E
ngineering
(An ISO 3297: 2007 Certified Organization)
Vol. 3, Issue 7, July 2015
Where f (bi) is the count in bin bi
3. Translate the search window W to the weighted mean wm 4. Repeat step 2 until convergence.
III.QUALITY METRICS FOR SEGMENTATION
The quality metrics are used as the measures, used to define the consistency of the algorithms. Using these measures, the better algorithm for region based segmentation is analysed and the formulae for the different measures are as follows [13]:
A. Grey Level Energy
The grey level energy indicates how grey levels are distributed [16]. It is formulated as:
WhereE(x)representsthegreylevelenergywith256binsandp(i)referstothe probability distribution functions, which contains the histogramcounts. The larger energy value corresponds to the lower number of grey levels, whichmeans simple. The smaller energy corresponds to the higher number of grey levels, whichmeans complex.
B. Discrete Entropy
The discrete entropy is the measure of image information content, whichis interpreted as the average uncertainty of information source. Discrete entropy isformulatedas:
Where p (i) is the probability distribution, considering all histogramcounts.
Resultshaveshownthattheentropyoftheproperlysegmentedimageismuchsmaller than that of the sourceimage.
C. Normalized Mutual Information
The mutual information [13] can be applied as another objective metric. The mutual information acts as a symmetric function, which is formulated as:
WhereI(X;Y)representsthemutualinformation;H(X)andH(X|Y)areentropy and conditional entropy values. It is interpreted as the information that Y can tell about Xis equal to the reduction in uncertainty of X due to the existence of Y. In Imagesegmentation, thelesservalueofthemutualinformationindicatesthebettermatchbetweenthesourceand processedimages.
Normalized Mutual Information [17] is a well-defined measure covering contentsfrom both discrete entropies and mutual information. It is formulatedas:
Where I(X, Y) is the mutual information; H(X) and H(Y) are the discreteentropies. Onceagain,similartothatofthemutualinformation,
thebettermatchbetweenthesourceandprocessedimages,thesmallerthenormalized mutualinformation.
D. Information Redundancy
ISSN(Online): 2320-9801
ISSN (Print): 2320-9798
I
nternational
J
ournal of
I
nnovative
R
esearch in
C
omputer
and
C
ommunication
E
ngineering
(An ISO 3297: 2007 Certified Organization)
Vol. 3, Issue 7, July 2015
Where H(X) and H(Y) are entropies of two images and I(X; Y) is the Mutual Information.
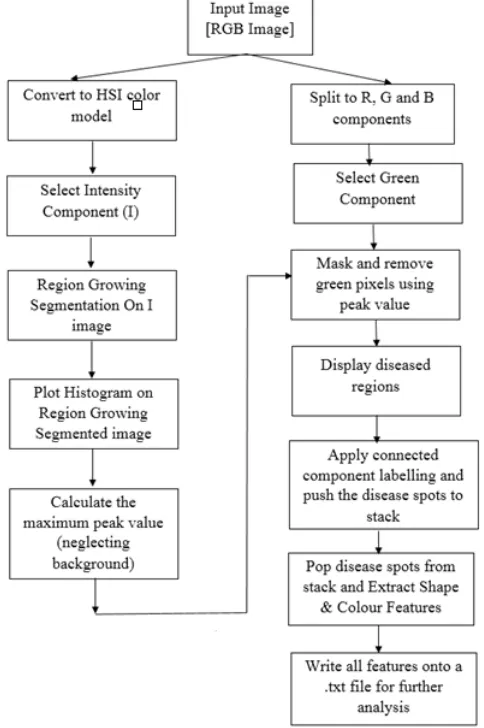
IV.PROPOSED METHOD
Based on the analysis done in section V. Region Growing Segmentation method is chosen for separating healthy and diseased regions of the leaf.Fig 2 shows the proposed method using region growing segmentation.
Fig 2: Flow chart of the proposed method
A. Steps Followed
1. Input image is split to R, G and B components. The Green buffer is considered forfurther processing.
2. Again the input image is converted to HSI color model [6], Intensity componentis considered forsegmentation. 3. Region growing segmentation is applied on Intensity component of HSI colormodel.
4. Now,Histogramisplotted [5]onregiongrowingsegmentedimageandthehighestpeakis calculated [neglecting the backgroundpeak].
5. The peak gives us the intensity of green pixels. This peak is used to segment thediseased spots.
6. Thegreenbufferfromstep1isconsidered.Thepeakobtainedfromstep4isusedand pixels are compared with the peak
value. The pixels that doesn’t match the range
ofpeakvalueareconsideredtobediseasedpixels.Inotherwordsmaskingandremovinggreen pixels. 7. The diseased pixels obtained from step 6 are displayed. This forms the diseasedregions.
ISSN(Online): 2320-9801
ISSN (Print): 2320-9798
I
nternational
J
ournal of
I
nnovative
R
esearch in
C
omputer
and
C
ommunication
E
ngineering
(An ISO 3297: 2007 Certified Organization)
Vol. 3, Issue 7, July 2015
9. Each diseased spot is popped from stack in order to extract Shape features[area,perimeter, centroid, roundness and compactness] and color features [Mean,Standard deviation, Entropy, Skewness and SpatialFrequency].
10. All these features are written into a “.txt” file for further analysis.
V. EXPERIMENTAL RESULTS AND ANALYSIS
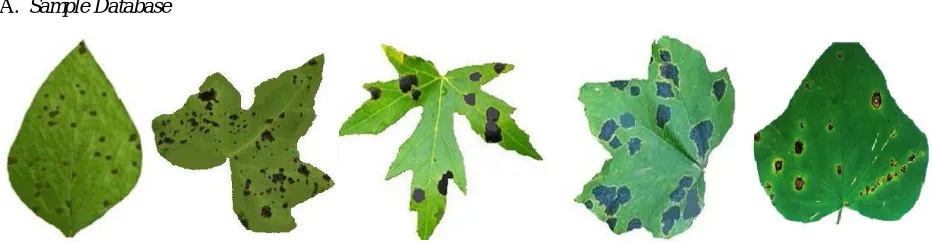
A. Sample Database
Leaf 1: Soybean Leaf Leaf 2: Ivy LeafLeaf 3: Maple Leaf Leaf 4: Maple LeafLeaf 5: Ivy Leaf
Disease: Brown Spots Disease: Leaf Spots Disease: Tar Spots Disease: Tar Spots Disease: Bacterial Leaf Spots
B. Analysis to Find the Best Region Based Segmentation
1) Quality Metric Analysis
TABLE I. shows the various quality metric parameters used to find the best region based segmentation method. The Quality Metric values in TABLE 1 are for Leaf 4 that is Maple leaf with tar spots disease. RG in TABLE I. stands for Region Growing Segmentation, RM stands form Region Merging Segmentation and RS stands for Region Splitting Segmentation.
TABLE I. Analysis to Find the Best Region Based Segmentation Based On Quality Metric Parameters
2) Computation Time Analysis
The Computation Time values in TABLE II. are for Leaf 4 that is Maple leaf with tar spots disease. RG in TABLE II. stands for Region Growing Segmentation, RM stands form Region Merging Segmentation and RS stands for Region Splitting Segmentation.
Quality Metric Parameters RG RM RS
Discrete entropy 1.136 4.128 3.659
Grey level energy 0.536 0.252 0.354
Mutual Information 0.282 3.752 3.659
Normalized Mutual
Information 0.127 0.886 0.719
ISSN(Online): 2320-9801
ISSN (Print): 2320-9798
I
nternational
J
ournal of
I
nnovative
R
esearch in
C
omputer
and
C
ommunication
E
ngineering
(An ISO 3297: 2007 Certified Organization)
Vol. 3, Issue 7, July 2015
TABLE II. Analysis To Find The Best Region Based Segmentation Based On Computation Time
3) Observation
Region based segmentation is applied on different images and the timing analysisis
doneonthesemethodsasshownabove. Basedontiming andQuality
Metrics,itisclearthatRegiongrowinghasthemaximumpeaksrepresentingdistinct regions with least discrete entropy and highest grey level energy when compared withother regionbasedsegmentationmethods.
C. Analysis To Find The Best Segmentation Method Among Region Growing And Mean-Shift Segmentation
1) Quality Metric Analysis
a) Grey Level Energy
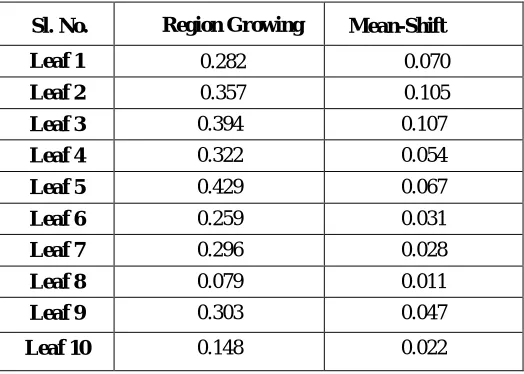
The larger energy value corresponds to the lower number of grey levels, which means simple. The smaller energy corresponds to the higher number of grey levels, which means complex.
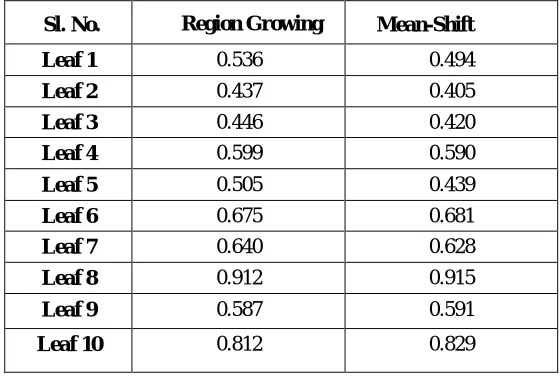
TABLE III. gives the grey level energy for region growing and mean-shift segmentation for 10 diseased leaves few of which are listed in section V (A).
TABLE III. Quality Metric Analysis Based On Grey Level Energy
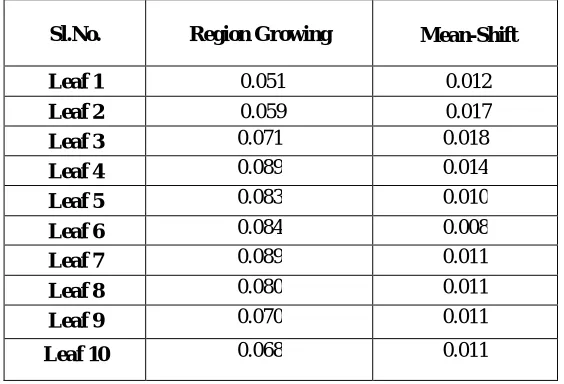
b) Discrete Entropy
The entropy of the properly segmented image is much smaller than that of the source image, which are much simpler, when the image pixels are distributed among more grey levels, the entropy value will increase.
TABLE IV. gives the discrete entropy for region growing and mean-shift segmentation for 10 diseased leaves few of which are listed in section V (A).
Computation
Time (seconds) RG RM RS
0.015 0.046 3.234
Sl. No. Region Growing Mean-Shift
Leaf 1 0.536 0.494
Leaf 2 0.437 0.405
Leaf 3 0.446 0.420
Leaf 4 0.599 0.590
Leaf 5 0.505 0.439
Leaf 6 0.675 0.681
Leaf 7 0.640 0.628
Leaf 8 0.912 0.915
Leaf 9 0.587 0.591
Leaf 10 0.812 0.829
Leaf 4: Maple Leaf Disease: Tar
ISSN(Online): 2320-9801
ISSN (Print): 2320-9798
I
nternational
J
ournal of
I
nnovative
R
esearch in
C
omputer
and
C
ommunication
E
ngineering
(An ISO 3297: 2007 Certified Organization)
Vol. 3, Issue 7, July 2015
TABLE IV. Quality Metric Analysis Based On Discrete Entropy
c) Mutual Information
In Image segmentation, the lesser value of the mutual information indicates the better match between the source and processed images.
TABLE V. gives the mutual information for region growing and mean-shift segmentation for 10 diseased leaves few of which are listed in section V (A).
TABLE V. Quality Metric Analysis Based On Mutual Information
d) Normalized Mutual Information
Similar to the mutual information, smaller normalized mutual information results the better match between the source and processed images.
TABLE VI. gives the discrete entropy for region growing and mean-shift segmentation for 10 diseased leaves few of which are listed in section V (A).
Sl. No. Region Growing Mean-Shift
Leaf 1 1.136 1.582
Leaf 2 1.377 1.743
Leaf 3 1.359 1.697
Leaf 4 1.025 1.171
Leaf 5 0.993 1.442
Leaf 6 0.971 0.957
Leaf 7 0.876 1.071
Leaf 8 0.327 0.325
Leaf 9 1.178 1.274
Leaf 10 0.658 0.610
Sl. No. Region Growing Mean-Shift
Leaf 1 0.282 0.070
Leaf 2 0.357 0.105
Leaf 3 0.394 0.107
Leaf 4 0.322 0.054
Leaf 5 0.429 0.067
Leaf 6 0.259 0.031
Leaf 7 0.296 0.028
Leaf 8 0.079 0.011
Leaf 9 0.303 0.047
ISSN(Online): 2320-9801
ISSN (Print): 2320-9798
I
nternational
J
ournal of
I
nnovative
R
esearch in
C
omputer
and
C
ommunication
E
ngineering
(An ISO 3297: 2007 Certified Organization)
Vol. 3, Issue 7, July 2015
TABLE VI. Quality Metric Analysis Based On Normalized Mutual Information
2) Computation Time Analysis
TABLE VII. Computation Time Analysis
3) Observation
Region growing segmentation and mean-shift segmentation is applied on different images and the timing analysis is done on these methods as shown above. Based on timing analysis and Quality Metrics, it is clear that Region growing has the maximum peaks representing distinct regions with least discrete entropy and highest grey level energy when compared with mean-shift segmentation methods. Hence Region Growing Segmentation is used as the segmentation method for further processing.
D. Results of the Proposed Method
Fig 3 shows the results of proposed method using Region Growing Segmentation. The input image Fig 3(a) is converted to HSI image and I component is considered for segmentation. The segmented image is as in Fig 3(b). Input Image Region Growing Segmentation Histogram of Segmented Image Green Buffer
on Intensity Image
Sl.No. Region Growing Mean-Shift
Leaf 1 0.051 0.012
Leaf 2 0.059 0.017
Leaf 3 0.071 0.018
Leaf 4 0.089 0.014
Leaf 5 0.083 0.010
Leaf 6 0.084 0.008
Leaf 7 0.089 0.011
Leaf 8 0.080 0.011
Leaf 9 0.070 0.011
Leaf 10 0.068 0.011
Sl. No.
Execution Time in Seconds
Region Growing Mean-Shift
Leaf 1 0.344 1.235
Leaf 2 2.406 0.875
Leaf 3 1.910 4.547
Leaf 4 0.344 1.438
Leaf 5 1.968 3.438
Leaf 6 1.125 2.172
Leaf 7 0.750 1.656
Leaf 8 0.235 0.735
Leaf 9 1.531 2.750
ISSN(Online): 2320-9801
ISSN (Print): 2320-9798
I
nternational
J
ournal of
I
nnovative
R
esearch in
C
omputer
and
C
ommunication
E
ngineering
(An ISO 3297: 2007 Certified Organization)
Vol. 3, Issue 7, July 2015
Fig 3(a) Fig 3(b) Fig 3(c) Fig 3(d)
Segmented Lesions Healthy Region
Fig 3(e) Fig 3(f) Fig 3(g)
Fig 3: (a) Maple leaf with tar spots as input image, (b) Region Growing Segmentation on Intensity Image, (c) Histogram of segmented image, (d) Green buffer of input image, (e) Segmented Lesions (diseases spots), (f) Healthy
region, (g) Total area of healthy and diseased regions and percentage of infection.
E. Hue Value Feature Extraction
The segmented lesions from step 3 is converted to HSI image and the hue image is considered for processing. The hue value of each disease spot is extracted. This is done because the hue value gives the actual color information of the image. Once the hue value is extracted, the area of each diseases spot is calculated and using this area the percentage of area infection is calculated as shown in TABLE VIII.
The hue values are clustered using K-Means clustering[18]. K value is chosen to be 3 that is hue values are clustered into 3 clusters. Cluster 1 indicates moderately infected regions, cluster 2 indicates less infected regions and cluster 3 indicates highly infected regions. In order to visually express the clusters, the clusters are assigned false colors. Cluster 1 is assigned red color, cluster 2 is assigned blue color and cluster 3 is assigned yellow color.
1) Experimental Results of Hue Value Feature Extraction
Fig 4 shows the Hue value feature extraction. The input image Fig 4(a) is segmented using Region Growing segmentation. The segmented lesions is mapped back to Fig 4(a) to get the RGB lesions. These lesions are converted to HSI image and the Hue image is considered for processing, this gives Fig 4(c). The segmented lesions are clustered using K-Means clustering to indicate different infected regions and for visually expressing this clustering false coloring is used.
Input Image Segmented Lesions Hue Image of Segmented Lesions Clustered Lesions
ISSN(Online): 2320-9801
ISSN (Print): 2320-9798
I
nternational
J
ournal of
I
nnovative
R
esearch in
C
omputer
and
C
ommunication
E
ngineering
(An ISO 3297: 2007 Certified Organization)
Vol. 3, Issue 7, July 2015
Blue Color : Less Infected Regions Red Color : Moderately Infected Regions
Fig 4: (a) Maple leaf with tar spots as input image, (b) Segmented lesions from inputimage, (c) Hue image of segmented lesions, (d) K-Means clustered lesions with false coloring
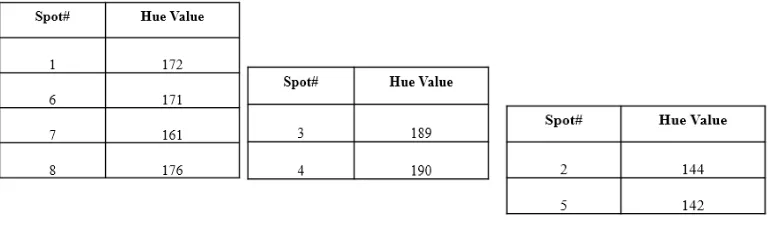
TABLE VIII. Hue Value and % of Area Infection
TABLE IX. (A), (B), (C) Shows The K-Means Clustered Lesions Initial Cluster Center are <189.0>, <190.0>, <171.0>
TABLE IX (A) TABLE IX (B) TABLEIX(C)
Cluster 1: Red Color Cluster 2: Blue Color Cluster 3: Yellow Color Final Cluster Centre: <170.0>Final Cluster Centre: <189.0> Final Cluster Centre: <143.0>
VI.CONCLUSION AND FUTURE WORK
The work proposed in this project is a very useful work for agriculture application. A number of different research work will be emerging from the basic work done in this project. Some of the future deductions will be as follows: 1. Segmentation is one of the most important image processing methodology which is used in this project to separate the disease regions of the leaf from healthy area. In this proposed work we have used Region Based segmentation methods to find out the disease regions. Out of the three basic Region based segmentation methods such as Region Growing, Region Merging and Region Splitting we have derived methodologies how to select the best one. The best Region based segmentation is Region Growing, details of which is explained in the work.
A large number of segmentation methods are coming up from researchers. The future deductions of research is to use different kinds of segmentation and different Quality Metric parameters to find which the best is.
2. In the present work the K-Means Clustering is been used. A large number of clustering methods under Data Mining Techniques like Agglomerative, CURE, OPTICS, Chameleon etc. are available in the literature. A future research work would be using various Data Mining Techniques.
3. One of the most useful application would be to link the damage area due to disease with its remedial procedure. 4. The entire system would be used as an Expert System to deliver the farmers some useful information.
Spot No. Spot Area Hue Value % of Area Infection
1 201 172 0.373148
2 65 144 0.12067
3 258 189 0.478966
4 231 190 0.428842
5 42 142 0.077971
6 204 171 0.378718
7 205 161 0.380574
ISSN(Online): 2320-9801
ISSN (Print): 2320-9798
I
nternational
J
ournal of
I
nnovative
R
esearch in
C
omputer
and
C
ommunication
E
ngineering
(An ISO 3297: 2007 Certified Organization)
Vol. 3, Issue 7, July 2015
REFERENCES
1. Prof.Sanjay B. Dhaygude, Mr. Nitin P. Kumbhar, “Agricultural plant LeafDisease Detection Using Image Processing”, International Journal of Advanced Researchin Electrical, Electronics and Instrumentation Engineering, Vol. 2, Issue 1, pp 599-602,2013
2. Dong Pixia, Wang Xiangdong, “Recognition of Greenhouse Cucumber Disease Based on Image Processing Technology”, Open Journal of Applied Sciences, pp 27-31, 2013
3. Sharma, Neeraj Aggarwal, Lalit. "Automated medical image segmentation techniques. (Review Article)(Clinical report)" , Journal of Medical Physics, Jan-March 2010 Issue
4. Mohammed El-Helly, Ahmed Rafea, Salwa El-Gammal, “An Integrated I m a g e Processing System for Leaf Disease Detection and Diagonosis”, IndianInternational Conference on Artificial Intelligence, IICAI2003
5. PiyushChaudhary,AnandK.Chaudhari,Dr.A.N.CheeranandShardaGodara,“Color Transform Based Approach for Disease Spot Detection on Plant Leaf”, InternationalJournal of Computer Science and Telecommunications, Volume 3, Issue 6,2012
6. Mr.J.Vijayakumar, Dr.S.Arumugam, “Recognition of Powdery Mildew Disease for Betelvine Plants Using Digital Image Processing”, International Journal of Distributedand Parallel Systems, Vol.3, PP 231-241,2012
7. Dheeb Al Bashish, Malik Barik and SuliemanBani-Ahmed, “ Detectionand
ClassificationofLeafDiseasesusingK-MeansbasedSegmentationandNeuralNetwork based classification”, Information Technology Journal, pp 267-275,2011
8. Yong Yang, Shuying Huang, “Image Segmentation By FuzzyC-MeansClustering Algorithm With A Novel Penalty Term”, Computing and Informatics, Vol. 26, 2007,17–31.
9. G. Padmavathi. "Implementation and Comparison of different segmentation algorithms used for underwater images based on nonlinear objective assessments", 3rd International Conference on Advanced Computer Theory and Engineering(ICACTE), 2010
10. D. Wijesingha and F.M.M.T. Marikar, “Automatic Detection System forthe Identification of Plants UsingHerbarium Specimen Images”, Tropical AgriculturalResearch Vol. 23 (1), PP 42 – 50,2011
11. Sabine D. Bauer • Filip Korcˇ • Wolfgang Fo¨rstner, “The potential ofautomatic methods of classificationto identify leaf diseases from multispectral images”, PrecisionAgric,PP 361–377, 2011
12. Yongmao Ye. "Information Measures for Biometric Identification via 2D Discrete Wavelet Transform" , IEEE International Conference on Automation Science and Engineering, 2007
13. Padmavathi, G.. "Non linear Image segmentation using fuzzy c means clustering method with thresholding for underwater images" , International Journal of Computer Science Issues (IJCSI)/16940784, 20100701
14. Zhengmao Ye. "Quantitative effects of discrete wavelet transforms and wavelet packets on aerial digital image denoising", 6th International Conference on Electrical Engineering Computing Science and Automatic Control (CCE), 2009
15. Abdala, Daniel Duarte(Jiang, Xiaoyi), "Ensemble and constrained clustering with applications", Münster University, Germany,Document Server, 2011
BIOGRAPHY
Ms. Darshana A., presently pursuing Master’s of Technology from NitteMeenakshi Institute of Technology,
Bangalore, Karnataka, India. Also have completed Bachelor’s of Engineering from Sri Venkateswara College of Engineering, Bangalore, Karnataka, India. Her area of interest is Digital Image Processing
Dr. Jharna Majumdar, presently the Dean of R&D and the HOD of CSE (PG). She served DRDO from 1990 to 2007
and retired as Scientist G and Head of Aerial Image Exploitation Division, Aeronautical Development Establishment (DRDO), Bangalore, India.Dr. Majumdar received B.Tech (Hons.) in Electronics and Electrical Engineering and Post Graduate in Computer Technology from Indian Institute of Technology Kharagpur in 1969 and 1970 respectively. She received her PhD (Electrical Engineering) in 1980.