INVESTIGATION
Inference of Site Frequency Spectra
From High-Throughput Sequence Data: Quanti
fi
cation
of Selection on Nonsynonymous and Synonymous
Sites in Humans
Peter D. Keightley1and Daniel L. Halligan
Institute of Evolutionary Biology, School of Biological Sciences, University of Edinburgh, Edinburgh EH9 3JT, United Kingdom
ABSTRACT Sequencing errors and random sampling of nucleotide types among sequencing reads at heterozygous sites present challenges for accurate, unbiased inference of single-nucleotide polymorphism genotypes from high-throughput sequence data. Here, we develop a maximum-likelihood approach to estimate the frequency distribution of the number of alleles in a sample of individuals (the site frequency spectrum), using high-throughput sequence data. Our method assumes binomial sampling of nucleotide types in heterozygotes and random sequencing error. By simulations, we show that close to unbiased estimates of the site frequency spectrum can be obtained if the error rate per base read does not exceed the population nucleotide diversity. We also show that these estimates are reasonably robust if errors are nonrandom. We then apply the method to infer site frequency spectra for zerofold degenerate, fourfold degenerate, and intronic sites of protein-coding genes using the low coverage human sequence data produced by the 1000 Genomes Project phase-one pilot. Byfitting a model to the inferred site frequency spectra that estimates parameters of the distribution offitness effects of new mutations, wefind evidence for significant natural selection operating on fourfold sites. We alsofind that a model with variable effects of mutations at synonymous sitesfits the data significantly better than a model with equal mutational effects. Under the variable effects model, we infer that 11% of synonymous mutations are subject to strong purifying selection.
W
HOLE-GENOME resequencing of multiple individuals promises to significantly enhance progress in popula-tion and quantitative genetics. In principle, it should be pos-sible to estimate single-nucleotide polymorphism (SNP) frequencies throughout the genome in large population sam-ples, leading to more detailed information concerning sev-eral important processes, including demographic history and the impact of natural selection on nucleotide variation. To this end, the distribution of allele frequencies in a sample of individuals (the site frequency spectrum, SFS) is of funda-mental interest. Within the SFS, alleles segregating at low frequencies may represent recent mutations, and these are particularly informative about the distribution offitness ef-fects of new mutations (Keightley and Eyre-Walker 2010).Therefore, for many purposes, it is preferable to estimate the frequencies of SNPs on a site-by-site basis rather than by incorporating information from linked sites (e.g., Le and Durbin 2011). Current high-throughput sequence data typ-ically consist of multiple short reads, of the order of 100 bases, sampled more or less randomly from the genome. Each site is typically sequenced several times—the number of times that a site is sequenced within an individual is known as its depth of coverage. Depth of coverage tends to be limited by a trade-off between the number of individ-uals sequenced and the sequencing effort per individual. Sequence reads are usually aligned to a reference genome by one of several software packages that have been written for this purpose.
In diploid species, two features of high-throughput se-quence data cause difficulties for unambiguous assignment of SNP genotypes and for inference of the SFS. First, if a site is heterozygous, the number of reads of each nucleotide type is subject to sampling variation. One of the two nucleotides at a site may therefore be at a low frequency or may even be absent. Second, population genetic inference is susceptible to Copyright © 2011 by the Genetics Society of America
doi: 10.1534/genetics.111.128355
Manuscript received March 3, 2011; accepted for publication May 12, 2011 Supporting information is available online athttp://www.genetics.org/cgi/content/ full/genetics.111.128355/DC1.
1Corresponding author: University of Edinburgh, W. Mains Rd., Edinburgh, EH9 3JT,
sequencing errors (Clark and Whittam 1992; Johnson and Slatkin 2008). Error rates in current high-throughput se-quencing technologies are nontrivial: for example, even after filtering of low-quality data, empirical estimates of error rates per base sequenced by the Illumina high-throughput sequenc-ing platform are1023(Keightleyet al.2009; Ossowskiet al.
2010). In a diploid, a true homozygote may therefore have reads containing a mixture of two or more nucleotides, which could be naively misclassified as a heterozygote. This problem is expected to be exacerbated if there is nonrandom error, such that nucleotide A is more likely to generate nucleotide B by error than nucleotide C or D. Errors can arise by se-quencing error, if the wrong nucleotide is assigned at a site, or by mapping error, if a read is aligned to an incorrect loca-tion in the reference genome.
In this article, we develop an approach to estimate the SFS by maximum likelihood (ML), using high-throughput sequence data. We assume binomial sampling of nucleotide types at heterozygous sites and that errors affect bases uniformly. We assume that genotype frequencies at each site within the sample of individuals are in Hardy–Weinberg proportions and that sites are unlinked. Our approach builds on work of Lynch (2008, 2009) and Hauboldet al.(2010), who have developed ML methods to estimate several funda-mental population genetics parameters, including levels of nucleotide diversity and the allele frequency at a site. Sim-ilarly, Hellmann et al. (2008) and Liu et al. (2010) have developed composite-likelihood approaches to estimate pop-ulation genetic parameters from shotgun sequence data of a population sample. We investigate the performance of our method in simulations and check its robustness to depar-tures from random error.
We have applied our ML approach to low-coverage sequence data from 57 Yoruba individuals that were sequenced as part of the 1000 Genomes Project phase-one pilot (1000 Genomes Project Consortium 2010). We inferred SFSs for zerofold degenerate, fourfold degenerate, and intronic sites, and from these we infer levels of nucleo-tide diversity in each class of sites and use the method of Keightley and Eyre-Walker (2007) to estimate the distri-bution offitness effects of new mutations. Consistent with previous studies (Eyre-Walker et al. 2006; Keightley and Eyre-Walker 2007; Boyko et al. 2008) we find evidence that most amino acid-changing mutations are subject to strong purifying selection and that a significant proportion of mutations are slightly deleterious. We also find signifi -cant evidence for selection operating on fourfold sites that varies in strength among sites.
Materials and Methods
ML method to infer the SFS
The data are assumed to consist of sequence reads ats nu-cleotide sites in a sample ofndiploid individuals. The depth of sequencing coverage at siteiin individualjis denoteddij. The first step of the analysis is to determine, for each site,
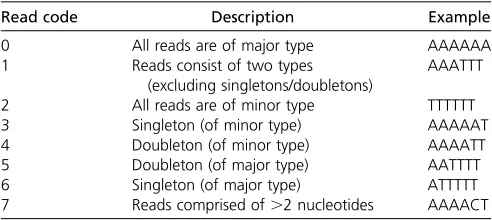
the derived base (if the SFS is unfolded) or the majority base (if the SFS is folded) among the complete set of the reads in thenindividuals. To simplify computations and for compu-tational efficiency, the observed reads for an individual are then coded. Reads at a site that have a mixture of nucleo-tides are distinguished according to whether there is a sin-gleton or a doubleton present or whether there are three kinds of base present. Table 1 shows the read codes and their definitions, along with an example of that read code for the case ofdij= 6, under the assumption that the most frequent (major) base is A. Note that under this coding system, read codes at a site depend on read depth; for ex-ample, code 1 is not possible ford= 5. In cases whered.6, mixtures of reads for which the least frequent (minor) base occurs three times or more are assigned code 1. Sites that have three kinds of nucleotide present are assigned read code 7. To simplify computations, sites that have four kinds of nucleotide (which must contain at least two errors according to our model assumptions) are also assigned read code 7.
Our inference procedure computes the likelihood of the data given the SFS, denoted f(x). The SFS is a vector of frequencies, which are parameters of the model estimated by ML. Elementxof the SFS is the probability ofxderived or major alleles at a site among 2nalleles sampled from a pop-ulation. Because P2j¼n0fðjÞ ¼1, there are 2n d.f., and 2n
frequencies need to be estimated for an unfolded SFS (nfrequencies for a folded SFS). We also estimate a sequenc-ing error rate parameter,e.
Assumptions
Sequencing reads are assumed to be generated from nucle-otide sites at which up to two alleles segregate. Genotype frequencies are assumed to be independent across sites, and within a site, frequencies are assumed to be in Hardy– Weinberg proportions across individuals. It is important to note that due to random sampling, the reads that we observe at a heterozygous site within an individual could consist of only one nucleotide type. Additionally, the reads observed at a homozygous site within an individual could contain two or more nucleotide types, if there are sequencing errors.
In our model we assume that sequencing errors occur with equal probabilities across sites and individuals. We assume that up to one and two errors can occur in the reads at a site generated from a single heterozygous and a homo-zygous individual, respectively. We allow more errors in homozygous individuals because the level of genetic varia-tion is expected to be relatively low, such that the vast majority of individuals are homozygous at a given site. In our model, if we observe three different nucleotides among the reads at a site, then there must be at least one error.
Computation of likelihood
We assume independence across sites, so the overall likeli-hood (L) of the data is computed from the product acrosss
Lð f; ejdataÞ ¼Y s
i¼1
Lðf ; ejreadsiÞ; (1)
wherereadsiis the vector of read codes observed for then
individuals at sitei. The likelihood ofreadsi is the sum of
the probabilities of observingreadsi, enumerated over 2n+
1 numbers of derived alleles (for the unfolded SFS), weighted by each SFS element:
Lðf;ejreadsiÞ ¼X
2n
j¼0
pðreadsijjÞfðjÞ: (2)
The probability of observing the vector of read codes
readsi given that there are j derived alleles at the site is
calculated as
pðreadsij jÞ ¼X
g
k¼1
pðreadsij genotypeskÞpðgenotypeskj jÞ;
(3)
wheregis the number of unique combinations of genotypes that can be constructed forndiploid individuals, given that there are jderived alleles, andgenotypesk is a vector
de-fining one such combination. For example, nine unique ge-notype combinations can be constructed if two individuals are sequenced at a biallelic locus, and genotypes are coded 1 (homozygous wild type), 2 (heterozygote), and 3 (homozy-gous derived): {11}, {12}, {13}, {21}, {22}, {23}, {31}, {32}, and {33}. The termp(genotypesk|j) is the
probabil-ity of one such genotype combination given that there arej
derived alleles. This is computed from the number of ways in which genotypeskcan be generated from jderived and
2n – j nonderived alleles divided by the total number of possible permutations of j derived and 2n – j nonderived alleles,
pðgenotypesk j jÞ ¼ 2
h
2n j
; (4)
where h is the number of heterozygous individuals in the genotype combination. Note that jderived and 2n–j
non-derived alleles can be arranged to form the same genotype 2hways because each heterozygous individual doubles the number of possibilities. The probability of observing the vec-tor of read codesreadsi, given the genotype vector
genoty-peskis calculated from
pðreadsij genotypeskÞ¼X z
l¼1
pðclj genotypeskÞdilðreadsi; clÞ;
(5)
where zis the number of read code combinations that can be generated fromgenotypesk, andclis a candidate vector
of read codes defining one such combination. The term
dil(readsi,cl) takes the value 1 if the candidate vector of read
codes clmatches the vector of observed read codesreadsor
takes the value 0 otherwise. The term p(cl|genotypesk) is
the probability of the candidate read codes cl vector given that the true genotype vector isgenotypesk. An example of
the read codes that can be generated for the case of one individual sequenced at read depth$8 and their associated probabilities is provided in Table 2 for a folded SFS (see below). The termex= Poisson(x,de) is the Poisson proba-bility ofxerrors, given an expected number of errorsde. The termby= bin(y,d, 0.5) is the binomial probability of observ-ingymajor type bases in a sample ofdreads at a site, given that the site is heterozygous. For example, the probability of code 0 (i.e., all wild-type alleles) given that the individual is a wild-type homozygote (i.e., two wild-type alleles) ise0+
e2/(3d), which is the probability of no error (e0) plus the
probability of two errors, the second of which reverts the first (e2/(3d)). To be a revertant, the second error can occur
at only one ofdreads and can be only one of three possible nucleotide changes. With more than one individual se-quenced, p(yl|genotypesk) is the probability of a
multi-individual genotype vector and is obtained by multiplying entries in Table 2 across individuals.
Folding the site frequency spectrum
By analyzing the folded SFS, only the frequency of the most frequent allele (or the major allele) at a site in the sample of individuals is estimated. The folded SFS therefore contains
n + 1 elements (rather than 2n+ 1 as in the case of the unfolded SFS), so nSFS parameters and the error rate pa-rameter need to be estimated. To infer the folded spectrum, both the data and the candidate genotype vectors are coded such that there are $nmajor alleles in the read combina-tion. The probability of a read combination needs to be doubled if equivalent read codes can be generated by a given read combination.
Maximization of likelihood
We maximized log likelihood using the simplex algorithm (Nelder and Mead 1965). To explore the possibility of mul-tiple maxima, we randomly sampled 10 independent sets of starting values for each data set analyzed. The maximum likelihood was assumed to be the highest likelihood found Table 1 Read codes and their definitions and an example of each
read code for a site sequenced at depth 6
Read code Description Example
0 All reads are of major type AAAAAA
1 Reads consist of two types
(excluding singletons/doubletons)
AAATTT
2 All reads are of minor type TTTTTT
3 Singleton (of minor type) AAAAAT
4 Doubleton (of minor type) AAAATT
5 Doubleton (of major type) AATTTT
6 Singleton (of major type) ATTTTT
among these trials. We found that increasing the number of trials to 20 did not affect the outcome (results not shown).
Simulating the site frequency spectrum
To evaluate the ML inference procedure, we generated simulated SFSs for s sites at which 2n alleles have been sampled. Elements of the SFS were a function of the genetic diversity (u) and a parameter,r, that specifies the shape of the SFS. More specifically, for values ofr,1, we assume that the density at each consecutive element of the SFS drops according to a geometric functionu(y) =ry21x, where
x=u(1) is the density associated with SFS element 1. To solve forx, we start with the nucleotide diversity for a given
sin a sequence of lengthL, which is defined by
u¼ s
anL;
(6)
wherean ¼
P2n21
i¼1 1=i. The proportion of segregating sites in
the sample is
s L¼
X2n
i¼1
ri21x ¼ x
12r2n
ð12rÞ ; (7)
and, therefore,
x¼uanð12rÞ
ð12r2nÞ: (8)
Generation of simulated data
For each site simulated, we sampled a number (z) of mutant alleles from the SFS with probability proportional to the density of each SFS element. A wild-type base (e.g., A) and a different mutant base (e.g., T, G, or C) were each sampled with uniform probability. Thezmutant and 2n2z
wild-type alleles were randomly allocated among then dip-loid individuals to be simulated. This procedure generated the genotypes for the individuals sampled at each site. If the true genotype for an individual was homozygous mutant or homozygous wild type, d mutant or wild-type base reads
were allocated to the site. If it was heterozygous, the num-ber of mutant base reads was sampled from a binomial dis-tribution fordtrials withP= 0.5. The“true”reads at the site were then subjected to either uniform or nonuniform errors. In either case, we sampled a number of errors from a Poisson distribution parameterde. To simulate uniform errors, base reads were randomly changed to a different base. To simu-late nonuniform errors, we sampled base changes from an empirically determined matrix of error probabilities ( sup-porting information,Table S1).
Human polymorphism data
We applied our ML inference procedure to sequence data from the 1000 Genomes Project phase-one pilot (1000 Genomes Project Consortium 2010). Specifically, we attemp-ted to infer the SFS for three different classes of sites: zero-fold and fourzero-fold degenerate sites and intronic sites from protein-coding genes. To compile these data, we initially obtained a set of coordinates for all zerofold and fourfold sites and a random sample of 2.5% of all intronic sites from the whole genome (excluding the X and Y chromosomes and the mitochondrial genome). We included zerofold and four-fold sites from coding regions of genes where every over-lapping exon was in the same reading frame and orientation. We defined intronic sites as any sites overlap-ping any annotated protein-coding transcript (using the genome annotation available from ftp.1000genomes.ebi.ac. uk), and, to exclude any site likely to be involved in splicing, we excluded sites within 30 bp of any annotated protein-coding exon. Because CpG dinucleotides are hypermutable and differ in frequency between these classes of sites, we restricted our analysis to sites defined as non-CpG prone (sites that are not preceded by a C or followed by a G, following Keightley et al. 2005). We obtained a total of 12,352,702, 1,811,238, and 18,648,553 zerofold, fourfold, and intronic non-CpG–prone sites, respectively.
We obtained “pileup”formatfiles for each class of sites from the 57 Yoruba (YRI) individuals sequenced at low cov-erage as part of the 1000 Genomes Project phase-one pilot (1000 Genomes Project Consortium 2010). To analyze data Table 2 Read codes and associated probabilities for depth ofd$8 for one individual and the number of wild-type alleles specified for a folded SFS
No. of wild-type alleles
in genotype Read code Probability
2 or 0 0 e0+e2/(3d)
1 0
3 or 6 e1+ 2e2/(3d)
4 or 5 (d21)e2/(3d)
7 2(d21)e2/(3d)
1 0 2b0e0+ 2b1e1/(3d)
1 2b2(d22)e1/(3d) + 2b3e0+ 2b3(d23)e1/(3d) + (1–2(b0+b1+b2+b3))(e0+e1/3)
3 or 6 2b0e1+ 2b1e0+ 4b1e1/(3d) + 4b2e1/(3d)
4 or 5 2b1(d21)e1/(3d) + 2b2e0+ 2b3e1/d
7 4b1(d21)e1/(3d) + 4b2e1/d+ 4b3e1/3 + (1–2(b0+b1+b2+b3))(2e1/3)
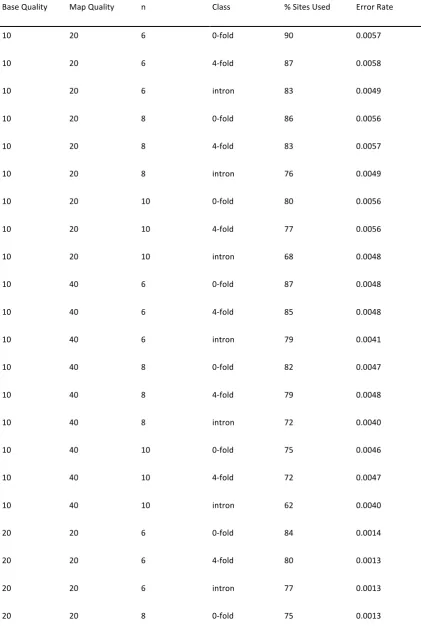
that have a consistent error spectrum, we restricted our analysis to reads sequenced by the Illumina platform. Mean depth of coverage for these data ranges from1.5 to 11 per individual (1000 Genomes Project Consortium 2010,figure S2). We trimmed any reads that had a base quality of ,20 or a map quality of,20. We investigated the effect of using less stringent base and map quality cutoffs, and although the inferred error rate was higher, the results were qualitatively unaffected (data not shown). For each site, we then attemp-ted to select 6, 8, or 10 individuals at random from those individuals that hadfive or more valid reads at that site after filtering reads on the basis of base and map quality scores. Sites were excluded in cases where there was an insufficient number of individuals withfive valid reads. Although mean coverage was fairly low in most individuals, by using this method we were able to obtain data for a high proportion of sites of each site type (see Table S2). For all usable sites within each of the three different classes of sites, we ran-domly selectedfive reads from 6, 8, or 10 randomly selected individuals from those that had at leastfive reads and cre-ated a datafile suitable for inputting into our SFS inference program.
Having inferred SFSs for each site class, we calculated two standard estimates of the level of diversity: nucleotide diversity (up, Tajima 1983) and Watterson’su(uW, Watterson 1975). We also estimated parameters of the distribution of homozygousfitness effects (DFE) of new mutations at zero-fold and fourzero-fold sites using the maximum-likelihood method of Keightley and Eyre-Walker (2007). This method infers the DFE assuming a model of equal fitness effects of new mutations or a gamma distribution of effects of new mutations, using the SFS of a set of sites assumed to be subject to selection together with the SFS of a set of sites at which mutations are assumed to be neutral. We also com-pared thefit of these models to a model with two classes of fitness effects and estimated the strength of selection oper-ating on each class (s1ands2) and the proportion of
muta-tions in class 1 (p1). We assume that intronic sites are
evolving neutrally, since it has previously been shown that intronic sites evolve only slightly slower than ancestral transposable elements (Eöryet al. 2010), which are them-selves among the best candidates for neutrally evolving sites in the mammalian genome (Lunteret al.2006). The method also simultaneously estimates the parameters of a simple demographic model, which is a step change in population size, fromN1toN2, at some time (t) in the past.
Results
Evaluation of the ML inference procedure by simulation
We focused on evaluating the SFS inference method for simulated data sets giving nucleotide diversity u = 1023.
This is similar to silent-site nucleotide diversity in many human populations (Li and Sadler 1991) and should be a stringent test of the method, since the higher diversity in many other outbreeding species will reduce the relative
con-tribution of error. We present results for simulations gen-erated with the SFS shape parameter (r) set at 0.75, which implies that the density associated with consecutive ele-ments of the SFS declines more steeply than typically seen for putatively neutral sites in real data sets. Again, this should present a stiffer test than many real data sets. We also examined the more extreme case of r = 0.5, but results are qualitatively similar (not shown). We simu-lated data sets with a large number of sites, i.e., 107, as
would be generated for whole-genome sequencing of eukaryotes.
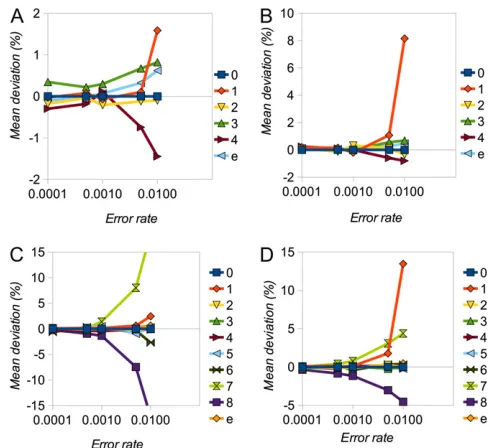
We assessed the performance of the inference procedure by estimating the mean deviations (as a percentage in 100 replicates) of each element of the estimated SFS and of the error parameter (e) from their true values. Figure 1 shows percentage deviation statistics plotted against the true value of e(ranging from 0.1u to 10u) for the case of random se-quencing errors. We examined SFSs with 8 and 16 alleles and depths of coverage of 5 and 10. In all cases the procedure produces close to unbiased estimates of the SFS elements and
e, as long as the true error rate is not substantially larger than
u. As the true value ofeincreases, estimates become increas-ingly biased. In particular, the frequency of the singleton class (one minor allele) becomes overestimated, presumably be-cause it is not possible to distinguish multiple errors in one individual from heterozygotes. Bias tends to be more serious at a higher depth of coverage, presumably because there are more opportunities for error. With nonrandom errors (see
Table S1for parameterization), estimates remain close to un-biased, as long ase# u, but bias becomes more serious for highere-values (Figure 2).
Human polymorphism data
We inferred the SFS and the error rate for three site classes (zerofold, fourfold, and intronic non-CpG–prone sites) in data sets generated by sampling 6, 8, or 10 individuals at each site from the low-coverage sequence data of Yoruba individuals produced as part of the 1000 Genomes Project phase-one pilot (1000 Genomes Project Consortium 2010). For the map- and base-quality filtering levels chosen, esti-mates of the error rate were relatively constant (e0.1%) across site classes and across different numbers of individu-als sampled (Table S2). However, for data recompiled us-ing lower-quality thresholds (byfiltering base calls of base quality ,10 and map quality,10), we inferred a higher error rate at all sites, as expected (Table S2).
The inferred SFSs for zerofold, fourfold, and intronic sites are plotted in Figure 3. As expected, zerofold sites show a higher frequency of singletons than both fourfold and intronic sites, indicative of the action of purifying selection maintaining recently arisen deleterious mutations at low frequencies. Furthermore, fourfold degenerate sites also show a higher frequency of singletons than intronic sites, consistent with the presence of weak negative selection at synonymous sites in humans (Comeron 2006). We then cal-culated two standard measures of diversity,upanduW, from the inferred SFSs.
Zerofold sites have substantially lower diversity by both measures (up=0.041%,uW= 0.045%) than both fourfold degenerate sites (up=0.086%,uW= 0.092%) and intronic sites (up=0.10%,uW= 0.11%). Furthermore, fourfold sites show lower diversity by both measures than intronic sites,
a result that is also consistent with weak negative selection acting on fourfold sites.
We then estimated the strength of selection acting on zerofold and fourfold degenerate mutations, under the assumption that introns evolve neutrally, using a published method (Keightley and Eyre-Walker 2007). Introns have been shown to evolve at similar rates to ancestrally inserted transposable elements (Eöryet al.2010), which themselves appear to be good candidates for neutrally evolving se-quence (Lunteret al.2006). Under a model with equal del-eterious mutational effects, estimates of the strength of selection (Nes) acting on zerofold and fourfold mutations
are 3.2 and 0.64, respectively (Table 3). For both zerofold and fourfold sites, a model that includes selection fits sig-nificantly better than one without (likelihood-ratio test,P,
0.001 in both cases). Interestingly, the estimated effect size for fourfold degenerate sites is remarkably consistent with the mean estimate produced by Comeron (2006,figure 4) of 0.5, using an independent approach based on the ratio of polymorphism to divergence of synonymous preferred and unpreferred mutations, also assuming thatNesis constant. A
model with a gamma distribution of fitness effectsfits sig-nificantly better than a model with equal effects for both zerofold and fourfold sites (likelihood-ratio test,P,0.001 in both cases). Under this model, the estimated parameters imply that, for zerofold sites, the majority of mutations (53%) are strongly selected with Nes .10 and 66% have
anNes.1. On the other hand, only 24% evolve effectively
neutrally (Nes , 0.1). Surprisingly, however, we find
evi-dence for strong selection operating on a proportion of four-fold degenerate sites: our estimated parameter values suggest that 11% have an Nes .10, and as many as 21% have an
Nes.1. For both zerofold and fourfold sites,fitting a model
with two classes of effects gives higher log-likelihoods, al-though the increase is only marginal for fourfold sites. The Akaike information criterion (AIC), which penalizes models that have more parameters, suggests that the two-effects Figure 2 Simulation results for nonrandom errors. (A–D) Mean deviation
(%) of SFS elements (labeled numerically in terms of number of minor alleles) and error rate (e) forn= 8 (A and B) andn= 16 (C and D) andd= 5 (A and C) andd= 10 (B and D). The shape parameter,r, of the SFS was 0.75.
model is the best choice for zerofold sites and that the gamma distribution is (marginally) the best choice for fourfold sites (Table 3). The parameter estimates obtained under a two-effects model are in broad agreement with the results from a gamma distribution model. For zerofold sites wefind that the majority (64%) of zerofold mutations are strongly deleterious (Nes = 34), whereas 36% have
weak selection coefficients (Nes = 0.0013). For fourfold
sites we infer that the majority of mutations (p1= 0.82)
are neutral (Nes1 = 0), while the remainder are strongly
selected (Nes2= 15).
Discussion
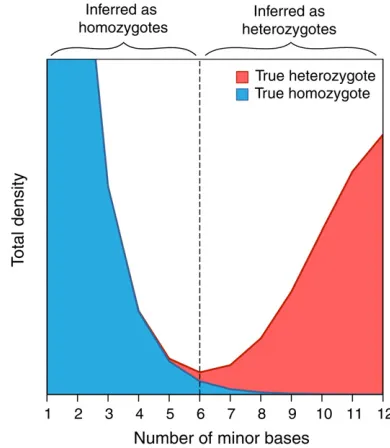
Genotype inference using high-throughput sequence data from diploids has two principal problems. First, due to sampling, reads from heterozygous sites could all come from a single allele, and therefore heterozygotes may be mis-classified as homozygous. Second, reads from any site are subject to sequencing errors, so a true homozygous site could be misclassified as heterozygous. This problem is illustrated in Figure 4, which shows a cartoon example of the contribution of heterozygous and homozygous sites to the minor nucleotide frequency distribution, under the as-sumption of binomial sampling of the number of minor nucleotides in heterozygotes along with random error. A heuristic approach to distinguish homozygous from hetero-zygous sites could, for example, set a threshold above (be-low) which a site is classified as heterozygous (homozygous) at the point where incorrect calls of homozygotes as hetero-zygotes and vice versa are minimized. Ideally the total den-sity at this point should be zero, but if the denden-sity is greater than zero then some proportion of both types of erroneous genotype calls will occur. The magnitude of this problem will increase with decreasing nucleotide diversity, because the number of base reads containing error increases relative to the frequency of heterozygotes. The problems associated with inferring the SFS from high-throughput sequence data therefore will tend to become more serious in species that have low nucleotide diversity (like humans) and are expected to be worse for sites that are under strong
purify-ing selection, such as nonsynonymous sites of protein-cod-ing genes and conserved noncodprotein-cod-ing elements.
Intuitively, we might expect that strong filtering on base and mapping quality should reduce the contribution of errors and allow more confident assignment of heterozy-gotes. We might also expect that by using sites with only high coverage, we should better distinguish between homo-zygotes subject to sequencing error and true heterohomo-zygotes. However, this is not necessarily the case for three reasons: Table 3 Demographic and strength of selection parameter estimates obtained byfitting models with a single selection coefficientfitted (equal-effects model), a two-selection–coefficient model (two-effects model), and a model that assumes a gamma distribution of mutational effects to the inferred SFSs for zerofold and fourfold degenerate sites
Class Model N2/N1 t/N2 b MeanNes Nes1 Nes2 p1 DLogL DAIC
Zerofold Equal effects 1.58 0.40 — 2.4 — — — 860 1710
Zerofold Gamma 2.31 0.52 0.14 490 — — — 12 22
Zerofold Two effects 2.31 0.59 — 21 0.0013 33 0.36 0 0
Fourfold Equal effects 2.31 0.57 — 0.62 — — — 9.8 16
Fourfold Gamma 2.31 0.55 0.038 20 — — — 0.8 0
Fourfold Two effects 2.31 0.56 — 2.8 0 15 0.82 0 0.4
We report estimates of the inferred change in population size (N2/N1, whereN1is the ancestral population size andN2is the current population size), the inferred number of generations since the population size change in units of the current population size (t/N2), the inferred shape of the gamma distribution (b, where applicable), and the inferred mean scaled selection coefficient (Nes). For the two-effects model we also report the estimated scaled selection coefficient for each effects class (Nes1andNes2) and the proportion of mutations in thefirst class (p1). In thefinal columns we report the difference between the model’s log-likelihood and Akaike information criteria (AIC) from that of the best-fitting model for that data set (DLogL andDAIC, respectively).
1. Reads in which a correct base call differs from the refer-ence tend to have low mapping quality.
2. The subset of sites sequenced at the highest depth is more likely to have incorrectly mapped reads. Strong filtering on minimum depth of coverage therefore tends to increase the contribution from mapping errors. 3. Strong filtering on base quality reduces the number of
usable base reads and therefore the number of usable sites, with the consequence that remaining sites come from the population of sites sequenced at high depth. The reads at these sites are more likely than average to be incorrectly mapped.
The interaction between these factors results in a trade-off between them. Less stringent filtering on base quality increases the contribution from sequencing errors, but too strongfiltering removes most of the data, and the remaining sites are subject to an increased frequency of mismapped reads. Reduction of filtering on mapping quality includes more mismapped reads, but stronger filtering tends to remove reads showing genuine differences between the sequenced individual and the reference. Finally, reducing the minimum coverage threshold makes it harder to distinguish between the contribution from sequence errors and binomial sampling of heterozygotes, whereas consider-ing only sites with a high depth of coverage increases the contribution from mismapped reads.
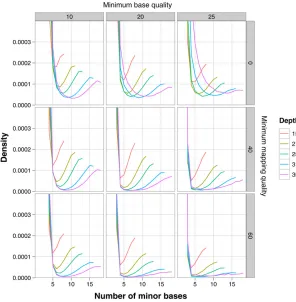
The interaction between these effects is illustrated in plots of the minor nucleotide frequency from a single
individual sequenced at high coverage as part of the phase-two pilot of the 1000 Genomes Project (Figure 5). The data consist of sites from chromosome 1 from individual NA12891 (from population CEU of European ancestry), which has a mean depth of coverage of27. We calculated the minor nucleotide frequency at each site afterfiltering the data on the basis of minimum base quality, minimum map quality, and minimum coverage and plotted the frequency distributions. As expected, in each plot there is a high fre-quency of sites where the minor nucleotide type is rare, presumably representing sequencing errors at homozygous sites, whereas there also appears to be a population of sites where the two nucleotides are present at nearly equal fre-quencies, presumably representing heterozygous sites. The distributions indicate that the best compromise for inference of an individual’s genotype from these particular data would be achieved by setting a minimum base quality of 20, a min-imum mapping quality of 40, and a minmin-imum coverage of 25. However, it is notable that the minima in all of the plotted distributions never reach zero, implying that errors will contribute to the inferred SFS, even if a cutoff for accepting/rejecting a site as heterozygous is set at this mini-mum. It is clear therefore that even with relatively high coverage, simple heuristic inference of genotypes will be error prone. Whereas the ultimate solution to the infer-ence problem outlined above is increasing depth of cover-age, problems will also be reduced by longer reads and paired-end reads, both of which will tend to reduce map-ping errors.
Our ML approach to infer the SFS is best suited to low coverage (say up to a depth of 10) because higher coverage than this will tend to lead to multiple errors at sites within an individual, and we model only up to two errors in the case of sites that are truly heterozygous. However, the algorithm could be modified to allow higher numbers of errors at a cost of increased computing time. We have also assumed independent errors, but nonindependent errors would be difficult to model within the current framework. With high depth of coverage, problems of inference are expected to essentially disappear for the reasons we have stated above.
We applied our ML method to the low-coverage genome-wide data produced as part of the 1000 Genomes Project phase-one pilot (1000 Genomes Project Consortium 2010). We used our method to infer SFSs and from these obtained estimates for the nucleotide diversity (up) at zerofold and fourfold sites of 0.041% and 0.086%, respectively. The esti-mate for zerofold sites is somewhat higher than an estiesti-mate of0.025% obtained for nonsynonymous sites by Torgerson
et al.(2009) for a data set of African-Americans. This could be partly a consequence of sequencing error contributing to our estimates, since up,efor zerofold sites. On the other hand, in the case of fourfold sites, up e, so we would expect our estimates to be less biased. Indeed our estimate of 0.086% is close to the estimate of0.08% obtained for synonymous sites by Torgerson et al. (2009). It should be noted, however, that these estimates are not directly com-parable for two reasons: First, we analyze zerofold and four-fold degenerate sites whereas Torgerson et al. obtained estimates for nonsynonymous and synonymous sites, which both include contributions from twofold degenerate sites. Second, we obtained estimates for non-CpG–prone sites only, whereas Torgerson et al.obtained estimates using all sites. The inclusion of hypermutable CpG-prone sites will increase estimates of diversity. Indeed, if we estimate up for all fourfold sites (including CpG-prone sites), we obtain a higher estimate of up= 0.11%. Finally, Torgerson et al. obtained their estimates from a data set of African-Ameri-cans, which potentially has lower levels of diversity than the Yoruba individuals analyzed here.
We used the inferred SFSs at zerofold, fourfold, and intronic sites to infer the strength of selection operating on zerofold and fourfold mutations under the assumption that mutations at intronic sites are neutral. We find significant evidence for selection operating on both zerofold and fourfold sites. Furthermore, models that include variable selection coefficients fit significantly better than an equal-effects model for both zerofold and fourfold sites (likelihood-ratio test,P,0.001 in all cases). Consistent with previous studies (Eyre-Walkeret al.2006; Keightley and Eyre-Walker 2007; Boykoet al.2008) when wefit a gamma distribution to the DFE, we infer that the majority (54%) of mutations at zerofold degenerate sites are strongly deleterious, and only 24% are effectively neutral. Intriguingly, the same model applied to fourfold sites reveals that 11% of mutations are
subject to strong purifying selection and that only 70% are effectively neutral. Possible causes of selection on synony-mous sites have been reviewed elsewhere (Chamary et al.
2006). Further analysis may reveal whether likely mecha-nisms, including the presence of subsets of sites important for mRNA stability and to control the removal of introns, are implicated.
Acknowledgments
We thank Thanasis Kousathanas for help in analyzing the two-effects model and Adam Eyre-Walker, Rob Ness, and two reviewers for helpful comments. D.L.H. and P.D.K. acknowledge support from a Biotechnology and Biological Sciences Research Council grant.
Literature Cited
Boyko, A. R., S. H. Williamson, A. R. Indap, J. D. Degenhardt, R. D. Hernandez, et al., 2008 Assessing the evolutionary impact of amino acid mutations in the human genome. PLoS Genet. 4: e1000083.
Chamary, J. V., J. L. Parmley, and L. D. Hurst, 2006 Hearing si-lence: non-neutral evolution at synonymous sites in mammals. Nat. Rev. Genet. 7: 98–108.
Clark, A. G., and T. S. Whittam, 1992 Sequencing errors and molecular evolutionary analysis. Mol. Biol. Evol. 9: 744–752. Comeron, J. M., 2006 Weak selection and recent mutational
changes influence polymorphic synonymous mutations in hu-mans. Proc. Natl. Acad. Sci. USA 103: 6940–6945.
Eöry, L., D. L. Halligan, and P. D. Keightley, 2010 Distributions of selectively constrained sites and deleterious mutation rates in the hominid and murid genomes. Mol. Biol. Evol. 27: 177– 192.
Eyre-Walker, A., M. Woolfit, and T. Phelps, 2006 The distribution offitness of new deleterious amino acid mutations in humans. Genetics 173: 891–900.
Haubold, B., P. Pfaffelhuber, and M. Lynch, 2010 mlRho a pro-gram for estimating the population mutation and recombination rates from shotgun-sequenced diploid genomes. Mol. Ecol. 19: 277–284.
Hellmann, I., Y. Mang, Z. Gu, P. Li, F. M. de la Vega, et al., 2008 Population genetic analysis of shotgun assemblies of ge-nomic sequences from multiple individuals. Genome Res. 18: 1020–1029.
Johnson, P. L. F., and M. Slatkin, 2008 Accounting for bias from sequencing error in population genetic estimates. Mol. Biol. Evol. 25: 199–206.
Keightley, P. D., and A. Eyre-Walker, 2007 Joint inference of the distribution offitness effects of deleterious mutations and pop-ulation demography based on nucleotide polymorphism fre-quencies. Genetics 177: 2251–2261.
Keightley, P. D., and A. Eyre-Walker, 2010 What can we learn about the distribution offitness effects of new mutations from DNA sequence data? Philos. Trans. R. Soc. B. 365: 1187– 1193.
Keightley, P. D., G. V. Kryukov, S. Sunyaev, D. L. Halligan, and D. J. Gaffney, 2005 Evolutionary constraints in conserved nongenic sequences of mammals. Genome Res. 15: 1373–1378. Keightley, P. D., U. Trivedi, M. Thomson, F. Oliver, S. Kumar,et al.,
Le, S. Q., and R. Durbin, 2011 SNP detection and genotyping from low-coverage sequencing data on multiple diploid samples. Genome Res. 21: 952–960.
Li, W.-H., and L. A. Sadler, 1991 Low nucleotide diversity in man. Genetics 129: 513–523.
Liu, X., Y.-X. Fu, T. J. Maxwell, and E. Boerwinkle, 2010 Esti-mating population genetic parameters and comparing model goodness-of-fit using DNA sequences with error. Genome Res. 20: 101–109.
Lunter, G., C. P. Ponting, and J. Hein, 2006 Genome-wide
identi-fication of human functional DNA using a neutral indel model. PLoS Comput. Biol. 2: e5.
Lynch, M., 2008 Estimation of nucleotide diversity, disequilibrium coefficients, and mutation rates from high-coverage genomes-sequencing projects. Mol. Biol. Evol. 25: 2421–2431.
Lynch, M., 2009 Estimation of allele frequencies from high-coverage genome-sequencing projects. Genetics 182: 295–301. Nelder, J. A., and R. Mead, 1965 A simplex method for
func-tion minimizafunc-tion. Comput. J. 7: 308–313.
1000 Genomes Project Consortium, 2010 A map of human ge-nome variation from population-scale sequencing. Nature 467: 1061–1073.
Ossowski, S., K., J. I. Schneeberger, N. Lucas-Lledó, R. M. Warthmann, and Clark, et al., 2010 The rate and molecular spectrum of spontaneous mutations in Arabidopsis thaliana. Science 327: 92–94.
Tajima, F., 1983 Evolutionary relationship of DNA sequences in
finite populations. Genetics 105: 437–460.
Torgerson, D. G., A. R. Boyko, R. D. Hernandez, A. Indap, X. Hu,
et al., 2009 Evolutionary processes acting on candidate cis-regulatory regions in humans inferred from patterns of polymorphism and divergence. PLoS Genet. 5: e1000592. Watterson, G. A., 1975 On the number of segregating sites in
genetical models without recombination. Theor. Popul. Biol. 7: 256–276.
GENETICS
Supporting Information http://www.genetics.org/cgi/content/full/genetics.111.128355/DC1
Inference of Site Frequency Spectra
From High-Throughput Sequence Data: Quanti
fi
cation
of Selection on Nonsynonymous and Synonymous
Sites in Humans
Peter D. Keightley and Daniel L. Halligan
Table S1 Illumina sequencing error frequency distribution empirically estimated based on D. melanogaster MA line whole‐genome sequence data.
To
A T G C
A ‐ 0.222 0.257 0.521
From T 0.222 ‐ 0.519 0.260
G 0.199 0.696 ‐ 0.106
C 0.695 0.199 0.105 ‐
We empirically estimated a matrix of nucleotide sequencing error frequencies from Illumina whole‐genome sequences of three Drosophila melanogaster mutation accumulation (MA) lines aligned to the reference D. melanogaster genome by the MAQ aligner (Li, H.et al. 2008. Genome Res. 18: 1851‐1858), which have been previously published (Keightley et al. 2009). The three initially isogenic lines were maintained for 262 generations by full‐sib mating (Fernandez, J. and López‐ Fanjul, C. 1996. Genetics 143: 829 837), and are therefore close to 100% inbred. Almost all sites sequenced are therefore expected to be homozygous, and any base reads that are different from a consensus base are likely to be errors. We counted the frequency of putative errors at sites that had a depth of coverage of at least 10, and classified them according to the kind of nucleotide change involved. There were 1,788,344 putative errors in 1,717,965,680 base reads, giving an estimated mean error rate of 0.00104 per base read. The data indicate a substantial departure from uniform errors, with errors of type A/T → C/G and C/G → A/T predominating.
Table S2 Percentage of sites used and inferred error rate for different site classes, and numbers of individuals sampled, as a function of minimum base quality threshold (base quality), minimum map quality threshold (map quality) and the number of individuals sampled (n).
Base Quality Map Quality n Class % Sites Used Error Rate
10 20 6 0‐fold 90 0.0057
10 20 6 4‐fold 87 0.0058
10 20 6 intron 83 0.0049
10 20 8 0‐fold 86 0.0056
10 20 8 4‐fold 83 0.0057
10 20 8 intron 76 0.0049
10 20 10 0‐fold 80 0.0056
10 20 10 4‐fold 77 0.0056
10 20 10 intron 68 0.0048
10 40 6 0‐fold 87 0.0048
10 40 6 4‐fold 85 0.0048
10 40 6 intron 79 0.0041
10 40 8 0‐fold 82 0.0047
10 40 8 4‐fold 79 0.0048
10 40 8 intron 72 0.0040
10 40 10 0‐fold 75 0.0046
10 40 10 4‐fold 72 0.0047
10 40 10 intron 62 0.0040
20 20 6 0‐fold 84 0.0014
20 20 6 4‐fold 80 0.0013
20 20 6 intron 77 0.0013
20 20 8 4‐fold 71 0.0013
20 20 8 intron 66 0.0012
20 20 10 0‐fold 63 0.0013
20 20 10 4‐fold 59 0.0013
20 20 10 intron 53 0.0012
20 40 6 0‐fold 81 0.0011
20 40 6 4‐fold 77 0.0011
20 40 6 intron 73 0.0011
20 40 8 0‐fold 71 0.0011
20 40 8 4‐fold 67 0.0011
20 40 8 intron 62 0.0010
20 40 10 0‐fold 58 0.0011
20 40 10 4‐fold 55 0.0011