HIGHLIGHTED ARTICLE
| INVESTIGATION
Spiraling Complexity: A Test of the Snowball Effect in
a Computational Model of RNA Folding
Ata Kalirad and Ricardo B. R. Azevedo1
Department of Biology and Biochemistry, University of Houston, Texas 77204-5001 ORCID IDs: 0000-0002-9500-3903 (A.K.); 0000-0001-5402-7071 (R.B.R.A.)
ABSTRACTGenetic incompatibilities can emerge as a byproduct of genetic divergence. According to Dobzhansky and Muller, an allele thatfixes in one population may be incompatible with an allele at a different locus in another population when the two alleles are brought together in hybrids. Orr showed that the number of Dobzhansky-Muller incompatibilities (DMIs) should accumulate faster than linearly—i.e., snowball—as two lineages diverge. Several studies have attempted to test the snowball effect using data from natural populations. One limitation of these studies is that they have focused on predictions of the Orr model, but not on its underlying assumptions. Here, we use a computational model of RNA folding to test both predictions and assumptions of the Orr model. Two populations are allowed to evolve in allopatry on a holey fitness landscape. Wefind that the number of inviable introgressions (an indicator for the number of DMIs) snowballs, but does so more slowly than expected. We show that this pattern is explained, in part, by the fact that DMIs can disappear after they have arisen, contrary to the assumptions of the Orr model. This occurs because DMIs become progressively more complex (i.e., involve alleles at more loci) as a result of later substitutions. We alsofind that most DMIs involve.2 loci,i.e., they are complex. Reproductive isolation does not snowball because DMIs do not act independently of each other. We conclude that the RNA model supports the central prediction of the Orr model that the number of DMIs snowballs, but challenges other predictions, as well as some of its underlying assumptions.
KEYWORDSspeciation; hybrid incompatibility; missing snowball; intrinsic postzygotic isolation; high-order epistasis
“[It is not] surprising that the facility of effecting a first cross, the fertility of the hybrids produced, and the capacity of being grafted together. . . should all run, to a certain extent, parallel with the systematic affinity of the forms which are subjected to experiment. . .”Darwin (1859)
I
N the absence of geneflow, the gradual accumulation ofdivergent genetically based characteristics in different pop-ulations can bring new species into being. Some of these divergent characteristics, known as reproductive isolating barriers (Johnson 2006), decrease the level of interbreed-ing between populations. As populations diverge, isolat-ing barriers accumulate, and the level of reproductive
isolation (RI) among populations increases (Coyne and Orr 1989; Roberts and Cohan 1993; Sasaet al. 1998; Edmands 2002; Presgraves 2002; Dettmanet al. 2003; Lijtmaeret al. 2003; Mendelson 2003; Moyleet al.2004; Bolnick and Near 2005; Litiet al.2006; Scopeceet al.2007; Stelkenset al.2010; Giraud and Gourbière 2012; Jewellet al.2012; Larcombeet al. 2015). Eventually, RI reaches a point where two of these pop-ulations are considered distinct species. Elucidating the precise nature of the relationship between genetic divergence and RI remains one of the central challenges in the study of speciation (Gavrilets 2004; Nosil and Feder 2012; The Marie Curie SPECIATION Network 2012; Seehausenet al.2014).
Dobzhansky (1937) and Muller (1942) proposed a gen-eral mechanism through which genetic divergence can cause RI. They noted that, in the absence of geneflow between two populations, an allele thatfixes in one population may be in-compatible with an allele at a different locus in another popu-lation when the two alleles are brought together in hybrids. This negative epistasis, or genetic incompatibility, causes the two populations to become reproductively isolated. Dobzhansky-Muller incompatibilities (DMIs) have been shown to cause Copyright © 2017 by the Genetics Society of America
doi:https://doi.org/10.1534/genetics.116.196030
Manuscript received September 19, 2016; accepted for publication March 3, 2017; published Early Online March 20, 2017.
Supplemental material is available online atwww.genetics.org/lookup/suppl/doi:10. 1534/genetics.116.196030/-/DC1.
1Corresponding author: Department of Biology and Biochemistry, University of
inviability or sterility in hybrids between closely related species (reviewed in Presgraves 2010b; Rieseberg and Blackman 2010; Maheshwari and Barbash 2011).
Orr (1995) modeled the accumulation of multiple DMIs as populations diverge. Consider two populations diverged atk loci and showingIksimple DMIs. AsimpleDMI is defined as a negative epistatic interaction between an allele at one locus in one population and an allele at a different locus in the other population. Orr showed that when the next substitu-tion takes place, the expected number of simple DMIs is
Ikþ1¼Ikþpk; (1)
wherepis the probability that there is a simple DMI between the latest derived allele and one of thekalleles at the loci that have previously undergone substitutions (from the popula-tion that did not undergo the latest substitupopula-tion). Assuming I1¼0;the solution to difference Equation 1 is
Ik ¼
pkðk21Þ
2 : (2)
Equation 2 predicts that the number of simple DMIs will accumulate faster than linearly as a function of divergence (prediction #1; Orr 1995). This prediction assumes that p remains constant as populations diverge (assumption #1).
DMIs involvingn$3 loci, known ascomplexDMIs (Cabot et al. 1994), are also expected to snowball, but following different relationships from that in Equation 2: DMIs of order n are expected to accumulate at a rate approximately pro-portional to kn (prediction #2; Orr 1995; Welch 2004). If DMIs have small, independent effects on RI (assumptions #2 and #3, respectively), then the postzygotic RI they gen-erate is also expected to increase faster than linearly withk (prediction #3; Orr 1995). Orr (1995) described this pattern of quantities increasing faster than linearly as“snowballing.” We shall refer to predictions #1–3 of the Orr model collec-tively as the“snowball effect”(Orr and Turelli 2001).
Several studies have attempted to test the snowball effect. They have employed three different approaches. Thefirst tests prediction #3 of the Orr model: that postzygotic RI snowballs. For example, Larcombeet al.(2015) measured the strength of hybrid incompatibility between Eucalyptus globulus and 64 species of eucalypts. They observed a faster than linear increase in RI with genetic distance, consistent with predic-tion #2 of the Orr model. Results from other studies using a similar approach have provided little support for a snowball effect in RI (Sasaet al.1998; Lijtmaeret al.2003; Mendelson et al. 2004; Bolnick and Near 2005; Gourbière and Mallet 2010; Stelkenset al.2010; Giraud and Gourbière 2012), lead-ing some to pronounce the snowball“missing”(Johnson 2006; Gourbière and Mallet 2010). However, this approach has several limitations. It can be applied only when postzygotic RI1:Furthermore, it only tests one prediction (#3) of the Orr model and this prediction relies on one assumption (#3) that typically goes untested. Thus, the number of DMIs might snowball (predictions #1–2) even if RI does not.
The second approach tests predictions #1–2 of the Orr model: that the number of DMIs snowballs. For example, Moyle and Nakazato (2010) used a QTL mapping approach to estimate the number of DMIs between species ofSolanum directly. They introgressed one or a few genomic segments from one species to another. When an introgressed segment caused a reduction infitness, they concluded that it partic-ipated in a DMI. They found that introgressions causing seed sterility accumulated faster than linearly. However, intro-gressions causing pollen sterility appeared to accumulate linearly, contrary to the snowball effect. Studies following similar approaches have tended to find support for the snowball effect (Matute et al.2010; Moyle and Nakazato 2010; Matute and Gavin-Smyth 2014; Sherman et al. 2014; Wanget al.2015).
One advantage of this approach over thefirst is that it relies on fewer assumptions (#1 compared to #1–3, respectively). However, the second approach also has limitations. The order ðnÞ of the DMIs identified is unknown. Therefore, this ap-proach cannot disentangle predictions #1 and #2. Another limitation of these studies is that they are likely to underes-timate the true number of DMIs for two reasons. First, the introgressed genomic segments typically contain many genetic differences. For example, the individual segments introgressed in Moyle and Nakazato (2010) included 2–4% of the ge-nome, and likely contained hundreds of genes. Second, indi-vidual alleles might participate in multiple DMIs, especially if complex DMIs are common (Guerreroet al.2016).
The third approach tests prediction #1 of the Orr model: that the number of simple DMIs snowballs. Consider two species, 1 and 2, diverged at kloci. If an allele,X2;at one of these loci (X) is known to be deleterious in species 1 but is
fixed in species 2, then species 2 must carry compensatory alleles at one or more lociðY2;Z2;. . .Þthat are not present in species 1 (which carries allelesY1;Z1;. . .at those loci). In other words, there must be a DMI involving the X2 and
Y1;Z1;. . .alleles.
Following Welch (2004), we defineP1as the proportion of thekfixed differences between the species where the allele from one species is deleterious in the other species. For ex-ample, Kachrooet al.(2015) replaced 414 essential genes of the yeast Saccharomyces cerevisiaewith their human ortho-logs. Over half of the human genes ðP1¼57%Þ could not functionally replace their yeast counterparts.
Welch (2004) has argued that estimates ofP1can be used to test the Orr model if two additional conditions are met. If each allele participates in at most one DMI, then we have P1¼Ik=k: If, in addition, P1 is entirely based on simple DMIs, then it is expected to increase linearly with genetic distance according to the Orr model (Equation 2).
P1¼
pðk21Þ
2 : (3)
both studies reported that P110% and is constant over broad ranges of genetic distances (e.g., human compared to either nonhuman primates orfishes; Kondrashovet al.2002). These results are inconsistent with prediction #1 of the Orr model (Welch 2004; Fraïsseet al.2016). The results of the second and third approaches give inconsistent results, a par-adox first noted by Welch (2004). However, the third ap-proach is less direct because it relies on two additional assumptions that have not been tested.
One common limitation to all approaches is that they focus on testing predictions of the Orr model, without testing its assumptions (e.g., assumption #1, constantp). Here we use a computational model of RNA folding (Schusteret al.1994; Lorenzet al.2011) to test both predictions and assumptions of the Orr model. The RNA folding model makes satisfactory predictions of the secondary structures of real RNA molecules (Mathewset al.1999; Doshiet al.2004; Lorenzet al.2011) and has been used to study other evolutionary consequences of epistasis, including robustness (van Nimwegenet al.1999; Ancel and Fontana 2000), evolvability (Wagner 2008; Draghi et al.2010), and the rate of neutral substitution (Draghiet al. 2011). We model populations evolving in allopatry on a holey fitness landscape (Gavrilets 2004). In his original model, Orr (1995) made no assumptions on either the evo-lutionary causes of genetic divergence, or the molecular basis of the DMIs arising from that divergence. Thus, Orr’s predic-tions should be met in our RNA“world.”Our results provide mixed support for the Orr model.
Materials and Methods
Genotype and phenotype
The genotype is an RNA sequence. Unless otherwise stated we used sequences with a length of 100 nt. The phenotype is the minimum free-energy secondary structure of the se-quence computed using the ViennaRNA package version 2.1.9 (Lorenzet al.2011) with default parameters.
Fitness
The fitness of RNA sequence i is determined using the function
wi¼
1 if bi.a and di#a
0 otherwise (4)
wherebiis the number of base pairs in the secondary struc-ture of sequencei,di is the base-pair distance between the structure of sequenceiand the reference structure, andais an arbitrary threshold. Unless otherwise stated, we used a¼12:Thefitness function in Equation 4 specifies a neutral network (Schusteret al.1994; van Nimwegenet al.1999) or holeyfitness landscape (Gavrilets 2004) (Figure 1).
Evolution
Burn-in period: We begin by picking a random viable RNA
sequence, define its secondary structure as the reference, and
allow the sequence to accumulate 200 random neutral sub-stitutions sequentially, allowing multiple hits. The resulting sequence is used as the ancestor. Supplemental Material, Ta-ble S1shows summary statistics of the ancestral sequences witha¼12:
The burn-in period is necessary because the initial se-quence is not representative for the fitness landscape. For example, it has the reference structure (i.e., di¼0 bp), whereas most sequences in thefitness landscape aredia bp away from the reference structure (Table S1).
Divergence: The ancestor is used to found two identical
haploid lineages. The lineages evolve by alternately accu-mulating a series of neutral substitutions without geneflow (allopatry) until they differ atk¼40 sites. At a given step, one of the evolving sequences is subjected to a random mutation. If the mutation is neutral, it is allowed to sub-stitute the ancestral nucleotide; if it is deleterious, it is discarded and a new random mutation is tried. The process is repeated until a neutral mutation is found. At the next step, the other evolving lineage is subjected to the same process.
All types of base-substitution mutations have equal probabil-ity. Insertions and deletions are not considered.
Inviable introgressions
Two viable sequences, 1 and 2, differ atksites. To detect DMIs of increasing complexity, we conduct introgressions of one, two, or three diverged nucleotides from one sequence to another.
Single introgressions:We introgress individual nucleotides
at each of the k divergent sites from sequence 1 to se-quence 2 and count the number of inviable introgressions, Jðk1Þ:We repeat the procedure in the opposite direction (se-quence 2/1) and calculate the average of the resultingJðk1Þ values. The proportion of single introgressions (in one di-rection) involved in a DMI is given by P1¼Jð
1Þ
k =k(Welch 2004).
Double introgressions: We introgress the iði21Þ=2 pairs
of nucleotides from sequence 1 to sequence 2, where i¼k2Jkð1Þis the number of divergent sites that are not in-volved in inviable single introgressions in the 1/2 direction. We count the number of inviable double introgressions,Jðk2Þ: We repeat the procedure in the opposite directionð2/1Þand calculate the average of the resultingJðk2Þvalues.
Triple introgressions: We introgress all triples of divergent
nucleotides from sequence 1 to sequence 2 that contain neither nucleotides involved in inviable single introgressions in the 1/2 direction, nor pairs of nucleotides involved in inviable double introgressions in the 1/2 direction. We count the number of inviable triple introgressions, Jðk3Þ:We repeat the procedure in the opposite direction ð2/1Þ and calculate the average of the resultingJðk3Þvalues.
Potential DMIs
The simple DMIs that might, potentially, affect a sequence can be computed exhaustively by measuring the fitness of all possible single and double mutants derived from the se-quence. A potential simple DMI is defined as an inviable double mutant between mutations that are individually neutral.
Direct estimation of p:The number of potential simple DMIs,
I, for a sequence allows us to estimate the value of the pa-rameter in the Orr model (Equation 1) as
p¼ 2I
jðj21Þ; (5)
wherejis the number of neutral mutations tested to es-timateI.
DMI network: We summarize the pattern of interactions
between sites using an undirected network where the vertices are sites and the edges represent the existence of at least one potential simple DMI between them (for every pair of sites,
there are nine combinations of double mutants). The resulting network is an example of the networks of interactions de-scribed by Orr and Turelli (2001) and Livingstone et al. (2012).
Reproductive isolation: The degree of RI between two
se-quences is defined as
RI¼12wR;
where wR is the mean fitness (Equation 4) of all possible 198 recombinants resulting from a single crossover between the sequences.
“Holeyness”of thefitness landscape:For each simulation,
we took the ancestor and each of thek¼40 genotypes gen-erated during the course of evolution, and measured the pro-portion of their single mutant neighbors (300 per sequence) that are inviable, excluding the 41 original sequences. This proportion estimates the local holeyness of thefitness land-scape traversed by the diverging lineages.
Statistical analyses
All statistical analyses were conducted with R version 3.3.0 (R Core Team 2016).
Data availability
The software used to run all simulations was written in Python 2.7 and is available at https://github.com/ Kalirad/spiraling_complexity (doi:http://doi.org/10.5281/ zenodo.400020).
Results
Inviable introgressions snowball in the RNA model, but more slowly than expected
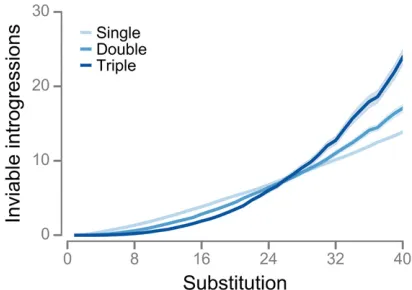
The Orr model predicts that DMIs of ordernshould accumu-late at a rate approximately proportional tokn;wherekis the number of substitutions (prediction #2: Orr 1995; Welch 2004). We tested this prediction using 103evolutionary sim-ulations with the RNA model. For each simulation, we esti-mated the numbers of inviable single, double, and triple introgressions. Wefitted the following model to the average numbers of inviable introgressions at eachk
JkðiÞ¼aiðk2iÞbi; (6)
wherei¼1;2 or 3 is the number of introgressed alleles, and aiandbiare parameters; thek2iterm ensures thatJðiiÞ¼0: An inviable introgression ofialleles indicates the existence of a DMI of ordern$iþ1:Furthermore, if each inviable in-trogression is caused by a single DMI, then predictions #1 and #2 of the Orr model lead to the prediction that the exponent bi$iþ1 (e.g.,b1$2 for inviable single introgressions).
In addition, the bi exponent increased with the number of introgressed alleles, i, in broad qualitative agreement with predictions #1 and #2 of the Orr model. However, inviable introgressions snowballed much more slowly than expected under the Orr modelðbiiþ1Þ:
Some inviable introgressions are caused by multiple DMIs in the RNA model
What explains this mismatch between the RNA data and the Orr model? One possibility is that some inviable introgressions are caused by multiple DMIs (Guerreroet al.2016). For ex-ample, imagine two genotypes, 1 and 2, divergent at multiple lociA;B;C;. . .Genotypeihas allelesAi;Bi;Ci;. . .If there are two simple DMIs between the two genotypes, A1=B2 and
A1=C2;then single introgressions from genotype 1 to geno-type 2 would only detect one inviable single introgression.
If we assume that all inviable single introgressions are caused by simple DMIs, then following the Orr (1995) model, the expected number of derived inviable introgressions after kþ1 substitutions is given by
Jkþ1¼Jkþpðk2JkÞ: (7)
For simplicity, we refer to Jðk1Þ as Jk (see File S1 for more details). AssumingJ1¼0;the solution to difference Equation 7 is
Jk¼k2
12ð12pÞk
p : (8)
Ifpis low then most inviable single introgressions are caused by single DMIs:JkIk(Figure S2). As a result, inviable sin-gle introgressions snowball, withb12 (Equation 6). Asp increases, the number of inviable introgressions caused by multiple DMIs increases andJkbegins to underestimateIk: In addition, the value of the b1 parameter in Equation 6 declines, slowing down the snowball as it were. For example, b11:92 when p¼0:005; and b11:61 when p¼0:05 (Figure S2B).
Fitting Equation 8 by nonlinear least-squares regression to the evolutionary response in inviable single introgressions shown in Figure 2 yields an estimate of p¼0:0264: If Jk evolved according to Equation 8 with this value ofp, then b11:75 in Equation 6 (Figure 3), confirming that some inviable single introgressions are caused by multiple DMIs in the RNA model.
However, the lack of agreement between the RNA data and the Orr model is not completely explained by the fact that some inviable introgressions are caused by multiple DMIs for two reasons. First,fitting Equation 6 directly to the same data yields an estimate ofb1¼1:351.75 (Figure 3 and Table 1). Second, the prediction ofb11:75 is con-servative because it assumes that all inviable single intro-gressions are caused bysimpleDMIs. In fact, afterk¼40 substitutions in the RNA model there were 13:8560:23 inviable single introgressions, but only 0:60060:052 sim-ple DMIs (mean and 95% confidence intervals, CIs) (see File S2 for details on how simple DMIs were detected).
The probability that a simple DMI appears is approximately constant in the RNA model
Another possible explanation the lack of agreement between the RNA data and the Orr model is thatpitself has evolved, contrary to assumption #1 of the Orr model. To evaluate this possibility, we allowed p in Equation 7 to change linearly with divergence according to the relationship
pk¼p0þck; (9)
and estimated thep0andcparameters by nonlinear least-squares. We obtained p0¼0:0431 and c¼ 20:000819; indicating that the lack of agreement between the RNA data and the Orr model might be explained by a declining p(Figure 3 andFigure S3, red dashed lines). IfJkevolved according to the red dashed line in Figure 3, thenb1 1:39 in Equation 6.
These results provide indirect evidence that assumption #1 of the Orr model is violated by the RNA data. To test the assumption more directly, we measuredpin each simulation using Equation 5. We found thatp did decline with diver-gence, but only slightly (Figure S3, black line). The observed decline inpwas not sufficient to explain the lack of agree-ment between the RNA data and the Orr model. IfJkevolves according to Equation 7 withpdeclining at the same rate,c, as observed in the RNA data (Figure S3, black line) and p0¼0:0283 (estimated by nonlinear least-squares regres-sion), thenb11:711:35:
Figure 2 Inviable introgressions snowball in the RNA model, but more slowly than expected. Evolution of the numbers of inviable single, double, and triple introgressions. Values are means of 103 simulations with
a¼12:Shaded regions indicate 95% CIs.
Table 1 Estimates of the parameters in Equation 6
Introgressed
alleles,i DMI order,n ai (95% CI) bi (95% CI)
1 $2 0.098 (0.002) 1.35 (0.005)
2 $3 0.023 (0.001) 1.82 (0.016)
3 $4 0.0036 (0.0004) 2.44 (0.033)
Simple DMIs do not persist indefinitely in the RNA model
The analyses summarized inFigure S3reveal two additional problems. First,fitting the Orr model to the RNA data under-estimated actual value ofpby approximately threefold. Sec-ond, even ifp0:0264 (Figure 3), then Equation 2 predicts an accumulation ofI4021 simple DMIs. However, we found that in 57% of runs there were no simple DMIs at all after k¼40 substitutions. These discrepancies indicate that a more fundamental assumption of the Orr model may be vio-lated in the RNA model: that simple DMIs, once they have arisen, persist indefinitely (assumption #4). This assumption was not stated explicitly by Orr (1995) and has never, to our knowledge, been called into question.
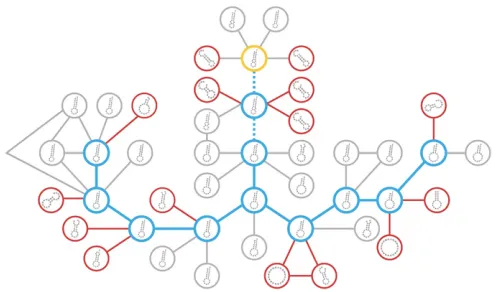
To test assumption #4, we estimated the DMI networks of sequences as they evolved in our RNA model. Figure 4A shows an example of an RNA sequence evolving on a holeyfitness landscape. Initially the sequence displays potential simple DMIs between 21 pairs of sites (Figure 4C). Figure 4B illus-trates a potential simple DMI between positions 5 and 12. We refer to these simple DMIs aspotentialbecause if two diverg-ing lineages each accumulate one of the substitutions under-lying one of these DMIs, a simple DMI between the lineages will appear.
The Orr model assumes that the DMI network is static: as populations evolve they actualize potential DMIs (for an alter-native, but equivalent, interpretation of DMI networks see Livingstoneet al.2012). However, DMI networks are not static in the RNA model. After a single neutral substitution, 13 pairs of sites (62%) lost all potential simple DMIs, and potential DMIs appeared between 18 new pairs of sites (Figure 4C).
The“disappearance”of a potential DMI can occur in one of two ways. First, the substitution may cause the mutations involved in the simple DMIs to become deleterious so that they can no longer participate in potential simple DMIs. A disappearance of this kind means that a potential simple DMI is no longer accessible through independent substitution in two lineages because one of the substitutions cannot take Figure 4 Simple DMIs do not persist indefinitely in the RNA model. (A) The 20 nt long RNA sequence on the left acquires a neutral U/A sub-stitution at position 18 (blue). The holeyfitness landscape is defined by a¼2 (Equation 4). The secondary structure of the sequence on the left is the reference (di¼0 bp). The structure on the right isdi¼2 bp away
from the reference. (B) There is a potential simple DMI between posi-tions 5 and 12 for the sequence on the left. A double mutant at those positions (5: A/G;12: C/G;red) makes the structure inviable (di¼11
bp), even though the single mutations are neutral (data not shown). However, a single substitution causes the potential simple DMI to disap-pear in the sequence on the right, although the single mutations remain neutral in the new background (data not shown). In other words, the substitution causes the simple DMI to become complex. (C) A single sub-stitution can dramatically rearrange the network of potential DMIs. DMI networks of the sequences in (A). Vertices correspond to positions in the sequences. An edge in the network on the left indicates that there is at least one potential simple DMI between the two sites (positions 4, 13, and 15–17 have no potential DMIs in either network and are not shown). Black edges in the network on the right are shared between the two networks. Blue edges exist only in the network on the right and indicate the appearance of new potential simple DMIs between sites caused by the substitution. Gray and red edges indicate disappearance of potential simple DMIs in the network on the right. Gray edges indicate disappear-ances due to the constituent alleles no longer being neutral in the new background. Red edges indicate disappearances caused by complexifi ca-tion; the DMI discussed in (B) is an example (5–12 edge).
place. Thus, such disappearances do not contradict assump-tion #4. The majority of disappearances in Figure 4C (gray lines) are of this kind.
The second kind of disappearance occurs when the sub-stitution modifies the interaction between previously incom-patible alleles (red lines in Figure 4C). In other words, the simple DMIs become complex. The potential simple DMI be-tween positions 5 and 12 shown in Figure 4B disappears in this way. This kind of disappearance—complexification— implies that some simple DMIs may not persist indefinitely. In other words, assumption #4 of the Orr model is violated in the RNA model. In the next section we explore the conse-quences of the complexification of simple DMIs for the snow-ball effect.
The modified Orr model
We incorporate the dynamic nature of simple DMIs by extend-ing the Orr (1995) model in Equation 1
Ikþ1¼ ð12qÞ Ikþpk; (10)
whereqis the probability that a simple DMI present afterk substitutions becomes complex after the next substitution. AssumingI1¼0;the solution to Equation 10 is
Ik¼
p q2
h
kq21þ ð12qÞk i
: (11)
This prediction assumes that bothpandqremain constant as populations diverge.
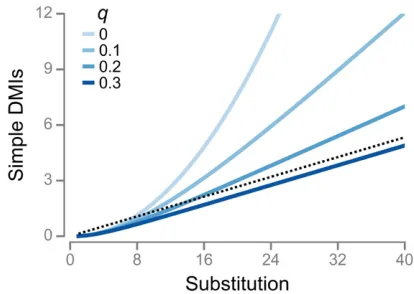
The original Orr model is a special case of the modified model whenq¼0:Whenq.0;Equation 11 has two conse-quences. First, the accumulation of simple DMIs eventually becomes linear with a slope of p=qwhenk is sufficiently large. Second, ifqis larger, the“linearization”of Equation 11 occurs for lower values ofk. Both patterns are illustrated in Figure 5A, which compares the accumulation of simple DMIs under the Orr model withp¼0:04ðq¼0Þ;and that under the modified Orr model with the same value ofpand increas-ing values ofq.
The modified Orr model can resolve the problems stated at the top of the previous section. For example, ifp0:0264 (Figure 3) andq¼1;the expected number of simple DMIs afterk¼40 substitutions is 1.0, which is close to the observed value. Thus, the modified Orr model predicts that most simple DMIs become complex within a single substitution.
DMI complexification is pervasive in the RNA model
Is there evidence for rampant DMI complexification in the RNA model as predicted under the modified Orr model? Fig-ure 2 shows that inviable double and triple introgressions, which must be based on complex DMIs of order n$3 and n$4;respectively, are quite common, as might be expected if more complex inviable introgressions are generated contin-uously from simpler ones. However, this is not conclusive evidence of complexification (Figure 6B): inviable introgres-sions of different complexity might simply arisede novo, with
more complex ones appearing at a higher rate, as proposed by Orr (1995) (Figure 6A).
To distinguish between the two scenarios, we tracked every inviable single, double, and triple introgression in each sim-ulation and classified it according to whether it originatedde novoor through the simplification or complexification of an-other inviable introgression present after the previous sub-stitution. For example, imagine that after k substitutions there are two inviable introgressions from one genotype to another:A(single) andB=C=D(triple). Afterkþ1 substitu-tions there are three inviable introgressions: A=E (double, resulting from complexification ofA),B=C(double, resulting from simplification ofB=C=D), andF(single,de novo). Figure 7 shows that initially, most inviable introgressions arise de novo. However, after k¼40 substitutions, the majority of inviable double and triple introgressions arise through complexification.
When we compared thefinal numbers of inviable single and double introgressions we found that they were strongly negatively correlated (Spearman’s rank correlation coeffi -cient:r¼ 20:469;P,1026;Figure S4). This result is diffi -cult to explain under the Orr model, because it envisages that the rates of origination of DMIs of different complexity are independent. However, a negative correlation would be expected if complexification is important and the rates of complexification vary across simulation runs.
Reproductive isolation does not snowball in the RNA model
among highly diverged sequences is high enough (Figure 2) that a substantial fraction of individual sites must partici-pate in multiple DMIs (Figure S2).
The structure of thefitness landscape influences the
accumulation of DMIs
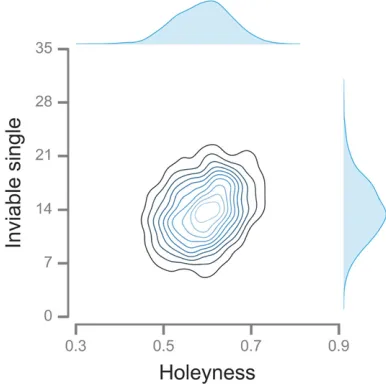
Figure 9 shows that the accumulation of inviable single in-trogressions varied extensively between simulations (see Figure S4for inviable double introgressions). What caused this variation? All simulations took place on the same se-quence space, but with differentfitness landscapes. Since all
fitness landscapes were“holey”(Gavrilets 2004), it follows that the exact pattern of “holeyness” might have had an effect on the evolutionary dynamics. One component of the holeyness of afitness landscape is the proportion of in-viable single mutant neighbors of all the sequences gener-ated during the course of evolution. This measure of the local holeyness of thefitness landscape was strongly posi-tively correlated with the final number of inviable single introgressions (r¼0:308;P,1026;Figure 9).
What determines holeyness? Thefitness landscapes in our RNA folding model have two determinants: the reference structure and the value of a(Equation 4). RNA secondary structures can differ in many ways, such as the number and size of base pair stacks, interior loops, and hairpin loops (Schusteret al.1994). The relationship between these struc-tural features and holeyness is difficult to predict a priori. For a given reference structure, lower values ofaare expected to specify fitness landscapes with more inviable sequences (i.e., holes) in them. To evaluate the extent to which these determinants of the fitness landscape influence holeyness, we ran 103 independent evolutionary simulations at each of another four values ofa. We found that holeyness was infl u-enced by both determinants of the fitness landscape: it was negatively correlated witha(r¼ 20:476;P,1026;Figure
S5A) and positively correlated with the number of base pairs in
the reference sequence,b(r¼0:134;P,1026;Figure S5B). Interestingly, changing the value ofahad only small effects on the patterns of accumulation of inviable introgressions (Figure S6andTable S3).
Discussion
We have tested both predictions and assumptions of the Orr model using a computational model of RNA folding. Our results provide mixed support for the snowball effect Figure 7 DMI complexification is pervasive in the RNA model. Origin of inviable single (A), double (B), and triple (C) introgressions. The width of each sector indicates the proportion of inviable introgressions arising either
de novo(blue) or through the modification of another inviable sion present after the previous substitution. (A) Origin of single introgres-sions. Incoming arrows intoi¼1 in Figure 6B: double, 2/1;triple, 3/1: (B) Origin of double introgressions. Incoming arrows intoi¼2 in Figure 6B: single, 1/2; triple, 3/2: (C) Origin of triple introgressions. Incoming arrows intoi¼3 in Figure 6B: single, 1/3;double, 2/3:
(Table 2). Inviable introgressions snowballed, but did so more slowly than expected (predictions #1 and #2; Figure 2 and Table 1). To elucidate why, we tested two assump-tions of the Orr model. First, that simple DMIs arise with constant probability,p(assumption #1). Although we did detect a decline inp, it was not sufficient to account for the pattern of accumulation of inviable single introgressions. Second, we tested assumption #4 that DMIs, once they have arisen, persist indefinitely. We found that this as-sumption was violated in the RNA model. Instead, DMIs had a tendency to become more complex as further sub-stitutions took place.
Despite the snowballing of inviable introgressions, RI did not snowball (prediction #3 of the Orr model), because DMIs did not act independently of each other on RI (assumption #3). These results indicate that RI is a poor indicator for the number of inviable introgressions or DMIs in our model. Thus, the pattern of change in RI with divergence is unsuit-able to test the Orr model (Mendelsonet al.2004; Johnson 2006; Gourbière and Mallet 2010; Presgraves 2010a). In conclusion, the RNA model provided qualitative support for the central prediction of the Orr model that the total number of DMIs snowballs. However, our results failed to confirm certain predictions of the Orr model, as well as some of its assumptions.
An earlier test of the Orr model using a computational model of gene networks also found no evidence for a snow-ball effect in RI (prediction #3), and concluded that some assumptions of the Orr model were not met (Palmer and Feldman 2009). However, the extent to which the complex-ification of DMIs influenced their results is unclear because they did not attempt to investigate the dynamics of the DMIs underlying RI.
In one direct empirical test of the snowball effect, inviable single introgressions affecting pollen sterility were found to accumulate linearly, whereas those affecting seed sterility were found to accumulate faster than linearly (Moyle and Nakazato 2010). Our results suggest a possible explanation for the discrepancy: faster complexification (i.e., higherq) of pollen sterility DMIs. Shermanet al.(2014) found evidence of greater complexity of the DMIs involved in pollen sterility. If all DMIs are simple and individual loci are at most involved in one DMI, then the proportion of thefixed differ-ences between species where an allele from one species is deleterious in another species, P1;is expected to increase linearly with genetic distance (Equation 3; Welch 2004). This prediction is contradicted by the observation that P1 is approximately constant over large genetic distances (Kondrashov et al. 2002; Kulathinalet al. 2004)—a result we call Welch’s paradox. Our results contradict both assump-tions behind the prediction thatP1 should increase linearly with genetic distance (Welch 2004): most DMIs are complex and individual loci are involved in multiple DMIs. These ef-fects are expected to act in opposite directions: the former would causeP1to snowball faster, whereas the latter would causeP1to snowball more slowly. In the RNA simulations,P1 increased with divergence but did so slower than linearly (Figure S7), indicating that the lack of independence between Figure 9 The structure of thefitness landscape influences the accumu-lation of DMIs in the RNA model. The number of inviable single intro-gressions accumulated after 40 substitutions is positively correlated with the holeyness of thefitness landscape. One- and two-dimensional kernel density estimates based on 103simulations witha¼12:
DMIs dominates the evolution ofP1:These results suggest a possible resolution for Welch’s paradox:P1 can be constant even if DMIs snowball if individual loci participate in multiple DMIs. Alternative resolutions of Welch’s paradox have been proposed (e.g., Fraïsseet al.2016).
We found that the vast majority of DMIs in the RNA model were complex. Complex DMIs have been discovered in many introgression studies (reviewed in Wu and Palopoli 1994, Fraïsseet al.2014). For example, Orr and Irving (2001) in-vestigated the sterility of male F1 hybrids between the USA and Bogota subspecies of Drosophila pseudoobscura and found that it is caused by a DMI between loci in both chro-mosomes 2 and 3 of USA, and loci in at least three different regions of the X chromosome of Bogota—a DMI of order n$5:More generally, high-order epistasis appears to be com-mon (Weinreich et al. 2013; Kondrashov and Kondrashov 2015; Taylor and Ehrenreich 2015). However, the relative prevalence of simple and complex DMIs in nature is unclear, because complex DMIs are more difficult to detect.
Two explanations for the abundance of complex DMIs have been proposed. First, that more complex DMIs evolve more easily than simpler DMIs because they allow a greater pro-portion of the possible evolutionary paths between the com-mon ancestor and the evolved genotypes containing the DMI (Cabotet al.1994; Orr 1995). Fraïsseet al.(2014) tested this mechanism using simulations and concluded that it is un-likely to be effective. Second, that the number of combina-tions ofnloci increases withn(Orr 1995). This explanation is difficult to evaluate in the absence of more information on the probability of origination of complex DMIs. Our results indicate that that probability could be higher than previously thought because complex DMIs are continuously generated from simpler DMIs. Indeed, our results suggest a new expla-nation for the abundance of complex DMIs: that DMIs have a tendency to become increasingly complex with divergence.
Our study has identified one determinant of the origination and complexification of DMIs: the holeyness of the fitness landscape. In a holeyfitness landscape, our measure of holey-ness is inversely related to the mutational robustholey-ness of the genotypes assayed (van Nimwegen et al. 1999; Ancel and Fontana 2000). In our model (as in Orr’s)“populations”are assumed to contain a single genotype; periodically, a mutant genotype arises and either goes tofixation or disappears. In such a model, mutational robustness is not expected to evolve
(van Nimwegen et al. 1999). Individual-based simulations would allow us to investigate the intriguing possibility that factors that influence the evolution of mutational robustness (e.g., mutation rate, recombination rate, environmental
fluctuations: Ancel and Fontana 2000; Wilkeet al. 2001; Azevedoet al.2006; Gardner and Kalinka 2006) may infl u-ence the accumulation of DMIs.
Perhaps the central insight from our study is that DMIs have a tendency to become more complex. Atfirst glance this claim might seem baffling. Can a DMI really be simple one moment and complex the next? The solution to this puzzle rests, we believe, on the difference between a DMI having a certain order nand our ability toinfer that it has ordernthrough genetic crosses. Imagine that one lineage has accumulated three consecutive substitutions at loci A,B, andC. Derived alleles are indicated by uppercase letters and ancestral alleles by lowercase letters. Now, imagine that there is a complex DMI of ordern¼3 between the allelesa,B, andc, and that there are no simple DMIs between any pairs of the three alleles (i.e.,a/B,a/c, andB/c). For simplicity, we also assume that none of the other alleles at theA,B, andC loci are in-volved in DMIs. The existence of a DMI is defined in the strict sense that any conceivable genotype containing all alleles involved in the DMI is inviable (conversely, the absence of a DMI indicates that at least one of the genotypes containing all alleles involved in the DMI are viable). Despite thea/B/cDMI being complex, after two substitutions, our introgression and rescue tests (File S2) would detect a nonexistent simple DMI between allelesaandB. The actual complex DMI can only be inferred after the third substitution has taken place. In the language we have been using so far, the simple DMI would appear tobecomemore complex.
We believe that our central finding that DMIs have a tendency to become more complex is independent of the details of our model. Other results, such as the precise rate of accumulation of DMIs or inviable introgressions, are likely to be influenced by the details of our model. The extent to which the RNA folding model is representative of other types of epistatic interactions (e.g., in gene networks) is unclear. One possible criticism is that we used very short sequences and that these are likely to experience unusually strong epistatic interactions. Orr and Turelli (2001) estimated p1027 in Drosophila, and Moyle and Nakazato (2010) estimated p1029 inSolanum, much lower values than Table 2 The RNA model provides mixed support for the Orr model
Test Confirmed? Data
Assumption
1.pconstant with divergence Yes, approximately Figure S3
2. DMIs have small effects on RI Yes Figure 8A
3. DMIs have independent effects on RI No Figure 8B
4. Simple DMIs persist indefinitely No Figure 4 and Figure 7
Prediction
1. Simple DMIs snowball No Figure 2 and Table 1
2. Complex DMIs snowball Yes, but more slowly than expected Figure 2 and Table 1
found in our simulations. However, an evolution experi-ment inS. cerevisiaedetected a simple DMI between two lineages that had only accumulated six unique mutations eachðk¼12Þ(Andersonet al.2010). This indicates a value ofp0:015;close to what we estimated in the RNA model (Figures 3 andFigure S3). Our approach to testing the Orr model can be applied to other computational models of biolog-ical systems, such as transcription-factor binding (Tulchinsky et al. 2014; Khatri and Goldstein 2015), gene networks (Palmer and Feldman 2009; ten Tusscher and Hogeweg 2009), and metabolic networks (Barve and Wagner 2013). Our results were robust to a broad range of holeyfitness landscapes defined in the RNA folding model. However, the holey landscape model makes two strong assumptions about the fitness landscape: all viable genotypes had the same
fitness, and all low fitness genotypes were completely in-viable. Neither assumption is met universally: many alleles involved in DMIs appear to have experienced positive selec-tion during their evoluselec-tionary history (Presgraves 2010b; Rieseberg and Blackman 2010; Maheshwari and Barbash 2011), and some DMIs are only mildly deleterious rather than lethal (Presgraves 2003; Schumer et al.2014). These assumptions can be relaxed in the RNA folding model (e.g., Cowperthwaiteet al.2005; Draghiet al.2011), and in other models (e.g., Palmer and Feldman 2009; Tulchinsky et al. 2014; Khatri and Goldstein 2015).
Studies like ours can test whether the snowball effect occurs under well-defined circumstances. However, they cannot test thereality of the snowball effect; introgression studies with real organisms remain the only way to do so (Matuteet al.2010; Moyle and Nakazato 2010; Matute and Gavin-Smyth 2014; Shermanet al.2014; Wanget al.2015).
Acknowledgments
Tim Cooper, Tiago Paixão, Leonie Moyle, and two anony-mous reviewers provided useful comments on the manu-script. We had helpful discussions with Rafael Guerrero, Peter Olofsson, and Jeff Tabor. We used the Maxwell and Opuntia clusters from the Center of Advanced Computing and Data Systems (CACDS) at the University of Houston. CACDS staff provided technical support. The National Science Foundation (grant DEB-1354952 awarded to R.B.R.A.) funded this work.
Literature Cited
Ancel, L. W., and W. Fontana, 2000 Plasticity, evolvability, and modularity in RNA. J. Exp. Zool. 288: 242–283.
Anderson, J. B., J. Funt, D. A. Thompson, S. Prabhu, A. Sochaet al., 2010 Determinants of divergent adaptation and Dobzhansky-Muller interaction in experimental yeast populations. Curr. Biol. 20: 1383–1388.
Azevedo, R. B. R., R. Lohaus, S. Srinivasan, K. K. Dang, and C. L. Burch, 2006 Sexual reproduction selects for robustness and negative epistasis in artificial gene networks. Nature 440: 87– 90.
Barve, A., and A. Wagner, 2013 A latent capacity for evolutionary innovation through exaptation in metabolic systems. Nature 500: 203–206.
Bolnick, D. I., and T. J. Near, 2005 Tempo of hybrid inviability in centrarchid fishes (Teleostei: Centrarchidae). Evolution 59: 1754–1767.
Cabot, E. L., A. W. Davis, N. A. Johnson, and C. I. Wu, 1994 Genetics of reproductive isolation in theDrosophila sim-ulansclade: complex epistasis underlying hybrid male sterility. Genetics 137: 175–189.
Cowperthwaite, M. C., J. J. Bull, and L. A. Meyers, 2005 Distributions of beneficialfitness effects in RNA. Genetics 170: 1449–1457. Coyne, J. A., and H. A. Orr, 1989 Patterns of speciation in
Dro-sophila. Evolution 43: 362–381.
Darwin, C., 1859 On the Origin of Species by Means of Natural Selection. J. Murray, London.
Dettman, J. R., D. J. Jacobson, E. Turner, A. Pringle, and J. W. Taylor, 2003 Reproductive isolation and phylogenetic diver-gence inNeurospora: comparing methods of species recognition in a model eukaryote. Evolution 57: 2721–2741.
Dobzhansky, T., 1937 Genetics and the Origin of Species. Columbia University Press, New York.
Doshi, K. J., J. J. Cannone, C. W. Cobaugh, and R. R. Gutell, 2004 Evaluation of the suitability of free-energy minimization using nearest-neighbor energy parameters for RNA secondary structure prediction. BMC Bioinformatics 5: 105.
Draghi, J. A., T. L. Parsons, G. P. Wagner, and J. B. Plotkin, 2010 Mutational robustness can facilitate adaptation. Nature 463: 353–355.
Draghi, J. A., T. L. Parsons, and J. B. Plotkin, 2011 Epistasis in-creases the rate of conditionally neutral substitution in an adapting population. Genetics 187: 1139–1152.
Edmands, S., 2002 Does parental divergence predict reproductive compatibility? Trends Ecol. Evol. 17: 520–527.
Fraïsse, C., J. A. D. Elderfield, and J. J. Welch, 2014 The genetics of speciation: are complex incompatibilities easier to evolve? J. Evol. Biol. 27: 688–699.
Fraïsse, C., P. A. Gunnarsson, D. Roze, N. Bierne, and J. J. Welch, 2016 The genetics of speciation: insights from Fisher’s geo-metric model. Evolution 70: 1450–1464.
Gardner, A., and A. T. Kalinka, 2006 Recombination and the evo-lution of mutational robustness. J. Theor. Biol. 241: 707–715. Gavrilets, S., 2004 Fitness Landscapes and the Origin of Species.
Princeton University Press, Princeton, NJ.
Giraud, T., and S. Gourbière, 2012 The tempo and modes of evo-lution of reproductive isolation in fungi. Heredity 109: 204–214. Gourbière, S., and J. Mallet, 2010 Are species real? The shape of the species boundary with exponential failure, reinforcement, and the“missing snowball”. Evolution 64: 1–24.
Guerrero, R. F., T. Nakazato, C. D. Muir, S. Josway, and L. C. Moyle, 2016 Pervasive antagonistic interactions among hybrid incom-patibility loci. bioRxiv DOI: 10.1101/090886.
Jewell, C., A. D. Papineau, R. Freyre, and L. C. Moyle, 2012 Patterns of reproductive isolation in Nolana (Chilean bellflower). Evolution 66: 2628–2636.
Johnson, N. A., 2006 The evolution of reproductive isolating bar-riers, pp. 374–398 inEvolutionary Genetics: Concepts and Case Studies, edited by C. W. Fox, and J. B. Wolf. Oxford University Press, Oxford, UK.
Kachroo, A. H., J. M. Laurent, C. M. Yellman, A. G. Meyer, C. O. Wilke et al., 2015 Systematic humanization of yeast genes reveals conserved functions and genetic modularity. Science 348: 921–925.
Kondrashov, A. S., S. Sunyaev, and F. A. Kondrashov, 2002 Dobzhansky-Muller incompatibilities in protein evolu-tion. Proc. Natl. Acad. Sci. USA 99: 14878–14883.
Kondrashov, D. A., and F. A. Kondrashov, 2015 Topological fea-tures of rugged fitness landscapes in sequence space. Trends Genet. 31: 24–33.
Kulathinal, R. J., B. R. Bettencourt, and D. L. Hartl,
2004 Compensated deleterious mutations in insect genomes. Science 306: 1553–1554.
Larcombe, M. J., B. Holland, D. a. Steane, R. C. Jones, D. Nicolle
et al., 2015 Patterns of reproductive isolation inEucalyptus—a phylogenetic perspective. Mol. Biol. Evol. 32: 1833–1846. Lijtmaer, D. A., B. Mahler, and P. L. Tubaro, 2003 Hybridization
and postzygotic isolation patterns in pigeons and doves. Evolu-tion 57: 1411–1418.
Liti, G., D. B. H. Barton, and E. J. Louis, 2006 Sequence diversity, reproductive isolation and species concepts in Saccharomyces. Genetics 174: 839–850.
Livingstone, K., P. Olofsson, G. Cochran, A. Dagilis, K. MacPherson
et al., 2012 A stochastic model for the development of Bateson–Dobzhansky–Muller incompatibilities that incorporates protein interaction networks. Math. Biosci. 238: 49–53. Lorenz, R., S. H. Bernhart, C. Höner Zu Siederdissen, H. Tafer, C.
Flammet al., 2011 ViennaRNA Package 2.0. Algorithms Mol. Biol. 6: 26.
Maheshwari, S., and D. A. Barbash, 2011 The genetics of hybrid incompatibilities. Annu. Rev. Genet. 45: 331–355.
Mathews, D. H., J. Sabina, M. Zuker, and D. H. Turner,
1999 Expanded sequence dependence of thermodynamic
pa-rameters improves prediction of RNA secondary structure. J. Mol. Biol. 288: 911–940.
Matute, D. R., and J. Gavin-Smyth, 2014 Fine mapping of domi-nant X-linked incompatibility alleles inDrosophilahybrids. PLoS Genet. 10: e1004270 (erratum: PLoS Genet. 11:e1005558). Matute, D. R., I. A. Butler, D. A. Turissini, and J. A. Coyne, 2010 A
test of the snowball theory for the rate of evolution of hybrid incompatibilities. Science 329: 1518–1521.
Mendelson, T. C., 2003 Sexual isolation evolves faster than hy-brid inviability in a diverse and sexually dimorphic genus offish (Percidae:Etheostoma). Evolution 57: 317–327.
Mendelson, T. C., B. D. Inouye, and M. D. Rausher, 2004 Quantifying patterns in the evolution of reproductive isolation. Evolution 58: 1424–1433.
Moyle, L. C., and T. Nakazato, 2010 Hybrid incompatibility
”snowballs”betweenSolanumspecies. Science 329: 1521–1523. Moyle, L. C., M. S. Olson, and P. Tiffin, 2004 Patterns of reproductive
isolation in three angiosperm genera. Evolution 58: 1195–1208. Muller, H. J., 1942 Isolating mechanisms, evolution and
temper-ature. Biol. Symp. 6: 71–125.
Nosil, P., and J. L. Feder, 2012 Genomic divergence during speciation: causes and consequences. Phil. Trans. R. Soc. B 367: 332–342. Orr, H. A., 1995 The population genetics of speciation: the
evo-lution of hybrid incompatibilities. Genetics 139: 1805–1813. Orr, H. A., and S. Irving, 2001 Complex epistasis and the genetic
basis of hybrid sterility in theDrosophila pseudoobscura Bogota-USA hybridization. Genetics 158: 1089–1100.
Orr, H. A., and M. Turelli, 2001 The evolution of postzygotic iso-lation: accumulating Dobzhansky-Muller incompatibilities. Evo-lution 55: 1085–1094.
Palmer, M. E., and M. W. Feldman, 2009 Dynamics of hybrid in-compatibility in gene networks in a constant environment. Evo-lution 63: 418–431.
Presgraves, D. C., 2002 Patterns of postzygotic isolation in Lepi-doptera. Evolution 56: 1168–1183.
Presgraves, D. C., 2003 Afine-scale genetic analysis of hybrid in-compatibilities inDrosophila. Genetics 163: 955–972.
Presgraves, D. C., 2010a Speciation genetics: search for the miss-ing snowball. Curr. Biol. 20: R1073–R1074.
Presgraves, D. C., 2010b The molecular evolutionary basis of spe-cies formation. Nat. Rev. Genet. 11: 175–180.
R Core Team, 2016 R: A Language and Environment for Statistical Computing. R Foundation for Statistical Computing, Vienna, Austria.
Rieseberg, L. H., and B. K. Blackman, 2010 Speciation genes in plants. Ann. Bot. (Lond.) 106: 439–455.
Roberts, M. S., and F. M. Cohan, 1993 The effect of DNA
se-quence divergence on sexual isolation in Bacillus. Genetics 134: 401–408.
Sasa, M. M., P. T. Chippindale, and N. A. Johnson, 1998 Patterns of postzygotic isolation in frogs. Evolution 52: 1811–1820. Schumer, M., R. Cui, D. Powell, R. Dresner, G. G. Rosenthalet al.,
2014 High-resolution mapping reveals hundreds of genetic in-compatibilities in hybridizingfish species. Elife 3: e02535. Schuster, P., W. Fontana, P. F. Stadler, and I. L. Hofacker,
1994 From sequences to shapes and back: a case study in
RNA secondary structures. Proc. Biol. Sci. 255: 279–284. Scopece, G., A. Musacchio, A. Widmer, and S. Cozzolino,
2007 Patterns of reproductive isolation in Mediterranean de-ceptive orchids. Evolution 61: 2623–2642.
Seehausen, O., R. K. Butlin, I. Keller, C. E. Wagner, J. W. Boughman
et al., 2014 Genomics and the origin of species. Nat. Rev. Genet. 15: 176–192.
Sherman, N. A., A. Victorine, R. J. Wang, and L. C. Moyle, 2014 Interspecific tests of allelism reveal the evolutionary tim-ing and pattern of accumulation of reproductive isolation mu-tations. PLoS Genet. 10: e1004623.
Stelkens, R. B., K. A. Young, and O. Seehausen, 2010 The accu-mulation of reproductive incompatibilities in African cichlidfish. Evolution 64: 617–633.
Taylor, M. B., and I. M. Ehrenreich, 2015 Higher-order genetic interactions and their contribution to complex traits. Trends Genet. 31: 34–40.
ten Tusscher, K. H. W. J., and P. Hogeweg, 2009 The role of
genome and gene regulatory network canalization in the evolu-tion of multi-trait polymorphisms and sympatric speciaevolu-tion. BMC Evol. Biol. 9: 159.
The Marie Curie SPECIATION Network, 2012 What do we need to
know about speciation? Trends Ecol. Evol. 27: 27–39.
Tulchinsky, A. Y., N. A. Johnson, W. B. Watt, and A. H. Porter, 2014 Hybrid incompatibility arises in a sequence-based bioen-ergetic model of transcription factor binding. Genetics 198: 1155–1166.
van Nimwegen, E., J. P. Crutchfield, and M. Huynen,
1999 Neutral evolution of mutational robustness. Proc. Natl. Acad. Sci. USA 96: 9716–9720.
Wagner, A., 2008 Robustness and evolvability: a paradox
re-solved. Proc. Biol. Sci. 275: 91–100.
Wang, R. J., M. A. White, and B. A. Payseur, 2015 The pace of hybrid incompatibility evolution in house mice. Genetics 201: 229–242.
Weinreich, D. M., Y. Lan, C. S. Wylie, and R. B. Heckendorn,
2013 Should evolutionary geneticists worry about
higher-order epistasis? Curr. Opin. Genet. Dev. 23: 700–707. Welch, J. J., 2004 Accumulating Dobzhansky-Muller
incompati-bilities: reconciling theory and data. Evolution 58: 1145–1156. Wilke, C. O., J. L. Wang, C. Ofria, R. E. Lenski, and C. Adami, 2001 Evolution of digital organisms at high mutation rates leads to survival of theflattest. Nature 412: 331–333.
Wu, C.-I., and M. F. Palopoli, 1994 Genetics of postmating repro-ductive isolation in animals. Annu. Rev. Genet. 28: 283–308.