ABSTRACT
RYU, YONGHEE. Fragility of Piping Systems and Reliability of Piping Components. (Under the direction of Dr. Abhinav Gupta and Dr. Vernon Matzen.)
Probabilistic frameworks are proposed to address the problem of evaluating seismic fragility for building-piping systems and the minimum reliability levels associated with piping design equation (9) in the ASME Boiler and Pressure Vessel Code, Section III, Division 1, NC/ND-3600 (ASME, 2007) in nuclear power plants. The main objective of the framework is to evaluate piping fragility in building-piping systems. To do so, a system level analytical piping model and a component level analytical model were developed based on experimental data. A methodology to reconcile experimental and analytical results for piping systems is presented. The damage to a piping system is characterized using the alternative form of the ASME criterion in terms of "First Leakage" as observed in laboratory tests. A nonlinear finite element model for the T-joint connection is formulated and validated with experimental results. Seismic fragility of a large-scale piping system in representative high-rise, mid-rise, and low-rise buildings is evaluated using nonlinear time history analyses. The emphasis is on evaluating the effects of piping interaction with building performance on piping fragility. The building models include the effects of building nonlinearity due to nonlinear behaviors of beams and columns which are characterized by a plastic hinge fiber model as well as a linear frame model. The main objective of the framework in the reliability-based design of piping systems is to evaluate the minimum reliability levels of the piping design equation. The
design equation defined by the ASME B2 equation or the modified B2 equation is calibrated
Fragility of Piping Systems and Reliability of Piping Components
by Yonghee Ryu
A dissertation submitted to the Graduate Faculty of North Carolina State University
in partial fulfillment of the requirements for the Degree of
Doctor of Philosophy
Civil Engineering
Raleigh, North Carolina 2013
APPROVED BY:
Dr. Mohammed Zikry Dr. Mervyn Kowalsky
Dr. Vernon Matzen Dr. Abhinav Gupta
ii
DEDICATION
iii BIOGRAPHY
Yonghee was born on December 19th, 1978 in Pyengtaek, South Korea. He received a Bachelor’s degree in Civil Engineering at Dan Kook University in South Korea in February 2002. He continued his Master of Engineering program in the Department of Civil Engineering at the same university and received a Master’s degree in Structural Engineering in May 2004. Following graduation, he worked more than 3 years at Geukdong Engineering Co., Ltd., - Engineering Design and Technical Supervision, South Korea as a senior engineer and a deputy manager. In January 2009, he began graduate school pursuing a PhD degree from North Carolina State University. He worked as a Research Assistant in the Center for Nuclear Energy Facilities and Structures (CNEFS) as well as a Teaching Assistant for “Matrix Structural Analysis I and II” and “Structural Behavior and Measurements” at North
Carolina State University. He is a member of the Korean-American Scientists and Engineers Association (KSEA).
iv
ACKNOWLEDGEMENTS
The research was supported by the Center for Nuclear Energy Facilities and Structures (CNEFS) at North Carolina State University and the National Science Foundation (NSF) as a part of the NEES Grand Challenge Project “Simulation of the Seismic Performance of Nonstructural Systems.” Resources for the center came from dues of the member organizations, National Science Foundation, Department of Civil, Construction and Environmental Engineering and College of Engineering at NCSU. I am so thankful for the center for providing a good environment with all the facilities and support throughout my graduate school. I would also like to thank all the staff members of the Civil Engineering department for their teaching and supporting me to grow in knowledge over the years.
I would like to express sincere appreciation for my advisors, Dr. Abhinav Gupta and Dr. Vernon Matzen for giving me the opportunity to pursue my graduate studies at NCSU. They taught me much about scientific research as well as the philosophy of teaching. Because of their invaluable guidance and inspiration throughout my graduate studies, my dream of an advanced degree came true.
v
vi
TABLE OF CONTENTS
LIST OF FIGURES ... x
LIST OF TABLES ... xv
PART I: INTRODUCTION ... 1
1. INTRODUCTION... 2
2. BACKGROUND ... 3
2.1 FRAGILITY OF THREADED PIPING SYSTEMS IN HOSPITALS AND OTHER NON-NUCLEAR FACILITIES ... 3
2.2 DESIGN OF PIPING COMPONENTS IN NUCLEAR POWER PLANTS ... 4
2.3 CHARACTERIZING THE BEHAVIOR OF PIPING ELBOWS... 6
3. SEISMIC FRAGILITY ... 7
4. RELIABILITY-BASED CODE CALIBRATION ... 8
5. OBJECTIVES ... 11
6. PROPOSED RESEARCH... 12
7. ORGANIZATION ... 17
REFERENCES ... 19
PART II: A RECONCILIATION OF EXPERIMENTAL AND ANALYTIC RESULTS FOR PIPING SYSTEMS ... 24
ABSTRACT ... 25
1. INTRODUCTION... 27
2. DEVELOPMENT OF COMPONENT LEVEL ANALYTICAL MODELS ... 30
2.1 COMPONENT LEVEL EXPERIMENTAL TEST ... 30
2.2 COMPONENT LEVEL FINITE ELEMENT MODELS ... 32
3. CHARACTERIZATION OF DAMAGE STATE BY LEAKAGE ... 34
vii
4.1 SYSTEM LEVEL EXPERIMENTAL TEST ... 36
4.2 SYSTEM LEVEL FINITE ELEMENT MODEL... 37
5. LEAKAGE LOCATIONS CAUSED BY CEILING SYSTEM INTERACTION . 38 6. CONCLUSIONS ... 40
ACKNOWLEDGEMENTS ... 42
REFERENCES ... 43
PART III: FRAGILITY EVALUATION IN BUILDING-PIPING SYSTEMS: EFFECT OF PIPING INTERACTION WITH BUILDING ... 72
1. INTRODUCTION... 75
2. DESCRIPTION OF MODELS ... 77
2.1 PIPING SYSTEM DESCRIPTION ... 78
2.2 BUILDING DESCRIPTION ... 78
3. NUMERICAL MODELING ... 79
3.1 NUMERICAL MODELING OF THE PIPING SYSTEM ... 79
3.2 NUMERICAL MODELING FOR BUILDINGS ... 80
4. MODAL CHARACTERISTICS OF PIPING SYSTEM AND BUILDINGS ... 81
4.1 PIPING CHARACTERISTICS ... 81
4.2 BUILDING CHARACTERISTICS ... 82
5. TIME HISTORY ANALYSIS ... 83
6. FRAGILITY ESTIMATION FOR LARGE-SCALE PIPING SYSTEM ... 84
6.1 CHARACTERIZATION OF DAMAGE STATE ... 84
6.2 SEISMIC FRAGILITY EVALUATION ... 86
7. ANALYSIS OF THE COUPLED SYSTEM ... 87
viii
8. EFFECT OF PIPING INTERACTION WITH BUILDINGS ... 91
8.1 EVALUATION OF CRITICAL FLOOR LEVELS IN A DETUNED BUILDING-PIPING SYSTEM ... 91
8.2 EVALUATION OF CRITICAL FLOOR LEVELS OF TUNED AND NEARLY TUNED BUILDING-PIPING SYSTEMS ... 93
9. CONCLUSIONS ... 95
ACKNOWLEDGEMENTS ... 97
REFERENCES ... 98
PART IV: PROBABILISTIC CHARACTERIZATION OF AN ALLOWABLE DESIGN MOMENT IN A PIPING ELBOW ... 145
ABSTRACT ... 146
1. INTRODUCTION... 148
2. DEFINITION OF THE ASME DESIGN CODE ... 150
2.1 ASME DESIGN EQUATIONS FOR PIPING COMPONENTS ... 150
2.2 PRIMARY STRESS INDICES B1 and B2 ... 152
2.3 COLLAPSE MOMENT CRITERION ... 154
3. MOMENT EQUATIONS FOR PIPING ELBOWS ... 155
3.1 THE ALLOWABLE DESIGN MOMENT AND B2 ... 157
3.2 THE COLLAPSE MOMENT EQUATION ... 159
4. PROBABILISTIC CHARACTERIZATION ... 161
4.1 CHARACTERIZATION OF VARIABLES... 161
4.2 PROBABILISTIC CHARACTERIZATION OF THE DESIGN MOMENT ... 162
5. RELIABILITY-BASED CODE CALIBRATION ... 163
6. PERFORMANCE FUNCTIONS FOR RELIABILITY EVALUATIONS ... 165
ix
8. CONCLUSIONS ... 168
ACKNOWLEDGEMENTS ... 171
REFERENCES ... 172 PART V: SUMMARY, CONCLUSIONS, AND RECOMMENDATIONS FOR
FUTURE RESEARCH ... 199
1. SUMMARY AND CONCLUSIONS ... 200 1.1 RECONCILIATION OF EXPERIMENTAL AND ANALYTIC
RESULTS FOR PIPING SYSTEMS... 200 1.2 FRAGILITY EVALUATION IN BUILDING-PIPING SYSTEMS: EFFECT OF PIPING INTERACTION WITH BUILDING ... 202 1.3 PROBABILISTIC CHARACTERIZATION OF AN ALLOWABLE DESIGN MOMENT IN A PIPING ELBOW ... 203
x
LIST OF FIGURES
PART I: INTRODUCTION
FIGURE 1: COLLAPSE MOMENT CRITERION (ASME, 2007) ... 18
PART II: A RECONCILIATION OF EXPERIMENTAL AND ANALYTIC RESULTS FOR PIPING SYSTEMS FIGURE 1: RELATIVE DAMAGE BY PERFORMANCE CATEGORY (FEMA 2007) ... 48
FIGURE 2: TESTS OF T-JOINT COMPONENT (TIAN ET AL., 2010) ... 49
FIGURE 3: LOADING PROTOCOLS FOR MONOTONIC AND CYCLIC TEST ... 50
FIGURE 4: TEST RESULTS OF T-JOINT COMPONENT ... 51
FIGURE 5: COMPONENT LEVEL PIPING MODEL ... 55
FIGURE 6: EXPERIMENTAL VERSUS ANALYTICAL RESULTS UNDER MONOTONIC LOADING CONDITION ... 56
FIGURE 7: EXPERIMENTAL VERSUS ANALYTICAL RESULTS UNDER CYCLIC LOADING CONDITION ... 57
FIGURE 8: ROTATIONAL SPRING MODEL FOR MONOTONIC TEST ... 58
FIGURE 9: 1 INCH ROTATIONAL SPRING MODEL FOR CYCLIC TEST ... 59
FIGURE 10: 2 INCH AND 4 INCH ROTATIONAL SPRING MODEL FOR CYCLIC TEST ... 60
xi
FIGURE 12: DEFINITION OF ROTATION LIMIT STATE ... 64
FIGURE 13: COMPARISON OF PROPOSED LIMIT STATE WITH TEST DATA ... 65
FIGURE 14: 2-STORY PIPING SYSTEM MODEL ... 68
FIGURE 15: LOADING PROTOCOL DYNAMIC TEST ... 69
FIGURE 16: SYSTEM LEVEL PIPING MODEL ... 70
FIGURE 17: TEST RESULTS VERSUS ANALYSIS RESULTS ... 71
PART III: FRAGILITY EVALUATION IN BUILDING-PIPING SYSTEMS: EFFECT OF PIPING INTERACTION WITH BUILDING FIGURE 1: THE COST OF MEDIUM-SIZE HOSPITAL (FEMA, 2007) ... 107
FIGURE 2: FLOWCHART FOR EVALUATION OF SYSTEM LEVEL PIPING FRAILTIES... 108
FIGURE 3: 2-STORY PIPING SYSTEM MODEL ... 109
FIGURE 4: RC MOMENT FRAME BUILDINGS ... 110
FIGURE 5: 1 INCH ROTATIONAL SPRING MODEL FOR CYCLIC TEST ... 111
FIGURE 6: 2 INCH AND 4 INCH ROTATIONAL SPRING MODEL FOR CYCLIC TEST ... 112
FIGURE 7: BEAM WITH HINGES ELEMENT DIAGRAM... 113
FIGURE 8: NODE NUMBERS IN PIPING MODEL ... 114
xii
FIGURE 10: MEAN CURVE FOR NORMALIZED EARTHQUAKE RECORDS ... 120
FIGURE 11: LOG-NORMAL DISTRIBUTION OF EACH PIPE FOR “FIRST LEAKAGE” CAPACITY... 121
FIGURE 12: COUPLED SYSTEM ... 124
FIGURE 13: SDOF BUILDING – SDOF PIPING SYSTEM ... 125
FIGURE 14: ELEMENT FORCE IN PIPING OSCILLATOR, 2-DOF COUPLED SYSTEM ... 126
FIGURE 15: FRAGILITY CURVES USING CLASSICAL VS. NON-CLASSICAL
DAMPING IN COUPLED SYSTEM ... 127
FIGURE 16: 20-STORY: ABSOLUTE MAXIMUM ACCELERATION AT 1.3G (LINEAR FRAME) ... 128
FIGURE 17: 20-STORY: ABSOLUTE MAXIMUM ACCELERATION AT 1.3 G
(PLASTIC HINGE FIBER) ... 129
FIGURE 18: PIPING FRAGILITY CURVES IN 20-STORY BUILDING ... 130
FIGURE 19: r
VERSUS STORY LEVEL OF 8-STORY LINEAR BUILDING IN X DIRECTION ... 134FIGURE 20: r
VERSUS STORY LEVEL OF 8-STORY NONLINEAR BUILDING IN X DIRECTION ... 135
xiii
FIGURE 22: 8-STORY: ABSOLUTE MAXIMUM ACCELERATION AT 2.3 G (PLASTIC
HINGE FIBER) ... 137
FIGURE 23: PIPING FRAGILITY CURVES IN 8-STORY BUILDING ... 138
FIGURE 24: PIPING FRAGILITY CURVES IN 2-STORY BUILDING ... 142
PART IV: PROBABILISTIC CHARACTERIZATION OF AN ALLOWABLE DESIGN MOMENT IN A PIPING ELBOW FIGURE 1: STRAIGHT PIPE SUBJECTED TO INTERNAL PRESSURE AND MOMENT LOADS ... 178
FIGURE 2: PIPING ELBOW CONFIGURATION ... 179
FIGURE 3: RELATIONSHIP BETWEEN B1 AND B2 STRESS INDEX ... 180
FIGURE 4: COLLAPSE MOMENT CRITERION (ASME, 2007) ... 181
FIGURE 5: B2 VALUES VERSUS H BY ASME AND MODIFIED B2 EQUATIONS ... 182
FIGURE 6: FEA PIPING ELBOW MODEL ... 183
FIGURE 7: END EFFECT ... 184
FIGURE 8: STANDARD DEVIATION LEVEL... 185
FIGURE 9: PROBABILITY DENSITY FUNCTION ... 186
FIGURE 10: PDFS OF MOMENTS WITHOUT PRESSURE WHEN H = 0.23 ... 187
xiv
FIGURE 12: PDFS OF MOMENTS WITH PRESSURE EFFECT (2.0PA) WHEN H = 0.6
... 189
FIGURE 13: PROBABILITY DENSITY FUNCTIONS FOR S, L, AND Z ... 190
FIGURE 14: COMPARISON OF AFORM AND MONTE CARLO SIMULATION WHEN H = 0.6 ... 191
FIGURE 15: MINIMUM RELIABILITY INDICES FOR STRAIGHT PIPE ... 192
FIGURE 16: MINIMUM RELIABILITY INDICES FOR H = 0.96 ... 193
FIGURE 17: MINIMUM RELIABILITY INDICES FOR H = 0.3 ... 194
FIGURE 18: PDFS OF Y ... 195
FIGURE 19: COEFFICIENT OF VARIATION OF Y ... 196
FIGURE 20: EFFECT OF CHANGING COV FOR D, T, AND R e FOR H = 0.96 ... 197
xv
LIST OF TABLES
PART II: A RECONCILIATION OF EXPERIMENTAL AND ANALYTIC RESULTS FOR PIPING SYSTEMS
TABLE 1: FIRST LEAKAGE ... 45
TABLE 2: DETECTED LEAKAGE LOCATIONS ... 46
TABLE 3: ANALYSIS RESULTS AT T-JOINT CONNECTION ON BOTTOM FLOOR (CASE 2) ... 47
PART III: FRAGILITY EVALUATION IN BUILDING-PIPING SYSTEMS: EFFECT OF PIPING INTERACTION WITH BUILDING TABLE 1: BUILDING DESIGN SUMMARY (WOOD ET AL., 2010) ... 101
TABLE 2: PIPING SYSTEM FREQUENCIES ... 102
TABLE 3: BUILDING SYSTEM FREQUENCIES ... 103
TABLE 4: SELECTED GROUND MOTIONS ... 104
TABLE 5: COEFFICIENT OF VARIATION ... 105
TABLE 6: PARAMETERS FOR LOG-NORMAL DISTRIBUTION ... 106
PART IV: PROBABILISTIC CHARACTERIZATION OF AN ALLOWABLE DESIGN MOMENT IN A PIPING ELBOW TABLE 1: STATISTICAL CHARACTERISTICS OF RANDOM VARIABLES ... 176
1 PART I
2 1. INTRODUCTION
3 2. BACKGROUND
2.1 FRAGILITY OF THREADED PIPING SYSTEMS IN HOSPITALS AND OTHER NON-NUCLEAR FACILITIES
4
(2011) performed the fragility analysis of threaded T-joint connections in a typical hospital piping system that was composed of main piping runs along 4 sections with a total of 64 branches. The laboratory test data on various T-joint components were used to characterize the "First Leakage" damage state. The system fragilities were obtained using nonlinear analyses of the entire piping system for the first leakage limit state.
2.2 DESIGN OF PIPING COMPONENTS IN NUCLEAR POWER PLANTS
Design of piping components in nuclear facilities is based on consideration of combined effects of pressure and moment loads as can be seen in the ASME piping design equation (9) of NC/ND-3600 in Section III of the Boiler and Pressure Vessel Code (ASME 2007):
m e
KS
Z
M
B
t
PD
B
1
2
2
(1)where, P is the allowable design pressure (psi); D is the outside pipe diameter (in); Ze is the
elastic section modulus (in3); M is the resultant moment due to a combination of mechanical loads (lb-in); Sm is the allowable stress at design temperature (psi), which is defined as the
smaller value of: (i) one-fourth of the ultimate stress (Su/4) or (ii) two-third of yield stress
(2Sy/3). B1 and B2 are stress indices for pressure and moment loads, respectively. K is a factor
5
6
2.3 CHARACTERIZING THE BEHAVIOR OF PIPING ELBOWS
The structural behavior of an elbow is more complex than a straight pipe because of its geometry especially due to a change in cross section, referred to as ovalization. Many researches (Von Karman, 1911; Hovgaard, 1926; Vigness, 1934; Reissner, 1949; Clarke and Reissner, 1951; Turner and Ford, 1957; Cheng and Thailer, 1968; Spence and Findlay, 1973; Calladine, 1974; Tan, 2001; Chattopadhyay et al., 2004; Kim and Oh, 2006) have studied the behavior of the elbow connections using different approaches. ASME Code Section NB-3683.7 (ASME 2007) specifies characteristics of elbows by modifying values of B1 and B2
stress indices instead of using the constant values as is the case for the straight pipe in Equation (1). The B1 stress index is associated with the internal pressure. The B1 stress index
equation is developed by the combined effect of pressure and moment loadings based on experimental data (Rodabaugh and More, 1978). The B2 stress index is associated with the
moment. The current ASME equation of B2 stress index is based on limit load analysis
(Matzen and Tan, 2002). Tan et al. (2001) proposed a modified equation for B2 stress index
based on the nonlinear finite element analysis (FEA) in which the collapse moment was defined by the intersection of the moment-rotation curve and a collapse limit line such that relative to the ordinate as shown in Figure 1.
The modified B2 equation (Tan et al., 2001) gives lower values of stress index
compared to the ASME equation for B2 stress index. The allowable design moment as
7
index. For example, the allowable design moment can be very different when calculated using the modified equation for B2 stress index as given by Tan et al. (2001) instead of using
the ASME equation for B2 stress index. Tan (2001) used the nonlinear FEA for prediction of
the elbow behavior under monotonic static loadings based on a comparison between experimental and the nonlinear FEA results. Chattopadhyay et al. (2004) and Kim and Oh (2006) used the nonlinear FEA including the effect of large geometry change to propose empirical equations for the collapse moment in elbows. Availability of these equations can facilitate the probabilistic characterization of design moment for elbows and also in evaluating the minimum reliability levels associated with the existing ASME design equation for piping elbows. The process of evaluating minimum reliability levels associated with an existing code equation is called “code calibration.” The code calibration helps in arriving at
the target reliability levels for developing partial safety factors in accordance with the LRFD methodology.
3. SEISMIC FRAGILITY
Seismic fragility Pf
is defined as the conditional probability of failure when a systemattains or exceeds a specified damage criteria, G(), at a given intensity of ground motion
excitation , e.g. peak ground acceleration (PGA). The damage state G()is defined by the
demand L (Load) and the capacity S (Strength) of a system. The fragility Pf
can be
8
defined as the probability when S ≤ L at a given level of . Mathematically, it can be expressed as:
P
SL0|
Pf (2)
According to Ju et al. (2011), the capacity S of a threaded pipe joint can be characterized in
terms of a limiting rotation Limit
.. In this case, the system fragility is defined as:
P
PGA
Pf Limit | (3)
The fragility can be estimated empirically by conducting multiple nonlinear time history analyses of the piping system for various ground motions by considering uncertainties in other related parameters:
N PGA P N i Limit i f
1 , | ) (1
(4)
where, i, represents the maximum rotation from th
i earthquake time history analysis at a PGA level of and 1(–) is the indicator function.
4. RELIABILITY-BASED CODE CALIBRATION
Reliability is related to the definition of a performance function or state function corresponding to a design limit state for the specified survival modes. The supply capacity S denotes the strength and the demanded requirement L, the load. Both S and L can be modeled
9
as random variables, and the reliability R can be defined as the probability when S > L. Mathematically,
)
(S L
P
R (5)
where, P()symbolizes the probability of an event. The performance function can be written
as Z = S - L, and a generalized formulation can be defined as:
) ,..., , ( ) ,
(S L g X1 X2 Xn g
Z (6)
where, Xi represents probabilistically defined variables by the loads and the strength. The
function g()is a limit-state function that characterizes the criterion:
0 )
(
g , Failure state
0 )
(
g , Limit state
0 )
(
g , Survival state
(7)
The probability of survival Ps is given by the joint probability distribution of Xi’s.
0 ) ( 3 2 1 3 2 1 3 21, , ,...., ( , ..., ) , , .... ... g n n n X X X
S f
x
x
x
x
dx
dx
dx
dx
P (8)
where, fX1,X2,X3,....,n(
x
1,x
2x
3...,x
n) is the joint probability density function of the randomvariables Xi's. In general, the joint density function is unknown and the evaluation of the
10
First Order Reliability Method (AFORM), also known as the Hasofer-Lind method (1974). In AFORM, the performance function Z is expressed by a linear function obtained from a
Taylor series expansion about the most probable failure point ( , *2, *..., *)
*
3 1 x x xn
x at which
0 ) ..., , ,
( *2 * * *
3
1
x x x xn
Z . The reliability can be expressed in terms of the reliability index 𝛽
such that PS = Φ(𝛽), where Φ is the cumulative distribution function of the standard normal
varieties (Ang and Tang 1990). For a specified target reliability index, the probability distributions of the load and strength variables are used to evaluate the mean load and strength factors. To do so, an iterative procedure such as that given by Ayyub and McCuen (2002), by Ang and Tang (1990), or by Haldar and Mahadevan (2000) is usually employed. To evaluate the reliability levels, we formulate the performance function as:
P Z M B t D P Su
X
X
X
X
X
X
B
X
g
22
)
(
1
(9)in which, XP is the random variable representing internal pressure P, XD is the random
variable representing pipe diameter D, P Z
X is the random variable representing plastic
section modulus ZP, Xt is the random variable representing pipe thickness t, XSu is the
random variable representing ultimate strength Su, and XM is the random variable
representing bending moment M, B1 is the constant value, and
2
B
X is the random variable
representing B2. Gupta and Choi (2003) and Saigal (2005) calculated the reliability level
11
ratio on straight pipes. The mean stress ratio on elbows will be also defined in terms of mean pressure stress and mean moment stress as:
t
D
Z
r
p e m4
/
/
(10)where, m is mean moment; p is mean pressure. The minimum reliability indices
corresponding to each performance function are calculated using AFORM and Monte Carlo simulation.
5. OBJECTIVES
12 6. PROPOSED RESEARCH
The specific tasks needed to accomplish the objectives of this research can be itemized as:
Task A: Fragility of Piping Systems
Task A-1: Development of a nonlinear moment–rotation model for the threaded T-joint
connection
A nonlinear moment–rotation model for the T-joint connection that reconciles with component-level test data will be developed by using simple monotonic and cyclic test data provided by University at Buffalo, State University of New York (UB). Specific tasks in such a framework can be enumerated as:
Define the T-joint behavior for various kinds of T-joint connections. Monotonic and
cyclic tests were conducted on two types of piping material – Black Iron and CPVC and three types of piping connections – Threaded, Cement, and Groove Fit from University at Buffalo. Two types of connections, the 1 inch and 2 inch threaded and the 4 inch groove fit black iron T-joint connections, are considered in this study.
Determine the analytical models associated with the moment – rotation relationships
13
Task A-2: Incorporation of the component-level nonlinear model in a system-level piping
model
System-level structural fragilities are calculated by nonlinear time history analyses in which the experimentally validated nonlinear FE models of component-level threaded joints are incorporated into a system-level piping model. The component-level nonlinear models are applied at the T-joint connections on 4 inch main piping line and 1 inch and 2 inch branches.
Task A-3: Characterization of the limit state for “First Leakage” at a threaded-joint
This task focuses on characterization of the limit state based on the observations from the test results. The criterion that forms the basis of design guidelines specified in the ASME Boiler & Pressure Vessel Code (ASME 2007) anticipates the reasonable limit rotation criterion that prevents “first-leakage” compared to the experimental results.
Task A-4: Fragility estimation for a large-scale piping system
This task focuses on evaluation of fragility functions by using experimentally validated large-scale FE models to conduct nonlinear time history analyses along with a consideration of uncertainties in the ground motion.
Task A-5: Effect of nonstructural fragility interaction with buildings
14
analysis. Seismic fragility of a large-scale piping system in representative high-rise, middle-rise, and low-rise buildings is evaluated using nonlinear time history analyses. The building models include the effects of building nonlinearity due to nonlinear behaviors of beams and columns, in which the element models are designed by using a plastic hinge fiber model as well as a linear frame model.
Task B: Reliability of Piping Components
Task B-1: Review of existing code equation and approaches for design of piping elbows
Review B1 and B2 stress indices that denote the primary stress indices for a piping
component subjected to the longitudinal stresses due to internal pressure and moment loadings.
Review and understand the different approaches to evaluate the maximum allowable
design moment for elbows. It has been studied by many researchers using various approaches:
o A minimum potential energy analysis (Von Karman, 1911; Vigness, 1934; Kafka
and Dunn, 1956; Rodabaugh and George, 1957)
o A mechanics of materials analysis (Hovgaard, 1926; Turner and Ford, 1957;
Smith, 1967)
o A thin-shell theory analysis (Tueda, 1934; Reissner, 1949; Clarke and Reissner,
1951; Cheng and Thailer, 1968)
15
o A finite element analysis (Chattopadhyay et al., 2004; Kim and Oh, 2006)
Task B-2: Evaluate the validity of existing equations for evaluating collapse moment in
elbows
Evaluate the validity of existing equations using nonlinear FE models. Chattopadhyay
et al. (2004) and Kim and Oh (2006) proposed the collapse moment equations for elbows subjected to in-plane bending moment considering the geometric nonlinearity for elastic perfectly plastic material.
Evaluate the end-effect of elbow arms on the validity of equations proposed by
Chattopadhyay et al. (2004) and Kim and Oh (2006). Diem and Muller (1985) indicated that the end effect can be ignored if the length of the elbow arm Le is greater
than five times the outside diameter D. The equations are developed for the specific ranges of:
o 0.1 ≤ h < 0.6, 5 ≤ r/t < 20, L = 3D (Chattopadhyay et al., 2004)
o 0.1 ≤ h < 0.6, 5 ≤ r/t < 20, L = 5Re (Kim and Oh, 2006)
Task B-3: Probabilistic characterization of design moment
Characterize the probability distribution of the design moment for an elbow
16
Evaluate probabilistic distributions for the maximum allowable design moment
without the pressure effect use the B2 stress index equation of the ASME design code
as well as Tan et al. (2001).
Evaluate probabilistic distributions for the maximum allowable design moment by
using the equation proposed by Kim and Oh (2006).
Characterize the effect of pressure for the maximum allowable design moment
evaluated using the ASME design equation (9) (ASME 2007).
Task A-4: Reliability evaluations
Conduct the code calibration for the ASME piping design equation.
Formulate the performance function.
Conduct analysis with given performance functions using the advanced first order
reliability method (AFORM) or Monte-Carlo simulation.
Task A-5: Sensitivity Analysis
Sensitivity analysis is performed for the different values of coefficient of variation (COV) for the critical parameters such as the diameter D, thickness t, and bend radius Re in piping
17 7. ORGANIZATION
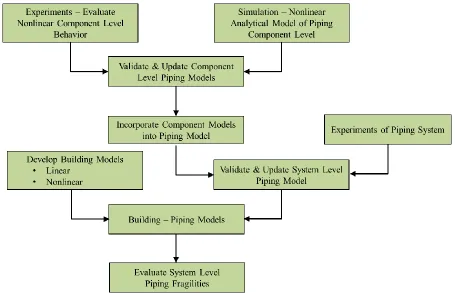
This dissertation consists primarily of three manuscripts which will be submitted for possible publications in peer reviewed journals. The first manuscript (Part II) of the dissertation, presents the reconciliation of experimental and analytic results for piping systems. Reconciliation with both the component level and system level piping models with experimental results is discussed in development of analytical models.
The second manuscript (Part III) in this dissertation discusses the evaluation of the piping fragility of the building-piping system by conducting nonlinear time history analyses of coupled building – piping systems using experimentally validated piping models.
The third manuscript (Part IV) in this dissertation addresses evaluation of the minimum reliability levels associated with the ASME piping design equation for piping elbows.
18
19 REFERENCES
American Society of Mechanical Engineers, 2007, Rues for construction of nuclear facility components, ASME Boiler & Pressure Vessel Code, Section III.
Ang, A. and Tang, W. H., 1990, Probability Concepts in Engineering Planning and Design, Vol II, Decision Risk and Reliability, John Wiley and Sons, NY.
Antaki, G. and Guzy, D., 1998, “Seismic Testing of Grooved and Threaded Fire Protection Joints and Correlation with NFPA Seismic Design Provisions,” ASME 1998, PVP-Vol. 364, Seismic Engineering-1998, 69-75
Assakkaf, I. A., Ayyub, B. M., and Mattei, N. J., 2000, “Reliability-based load and resistance factor design (LRFD) of hull structural components of surface ships,” Association of
Scientists and Engineers—37th Annual Technical Symposium, May 10.
Avrithi, K. and Ayyub, B. M., 2009, “A Reliability-Based Approach for the Design of Nuclear Piping for Internal Pressure,” ASME J. Pressure Vessel Technol., 131, p. 041201. Avrithi, K. and Ayyub, B. M., 2010 “A Reliability-Based Approach for the Design of Nuclear Piping for Internal Pressure,” ASME J. Pressure Vessel Technol., 132 , p. 021101.
Ayres, J. M. and Phillips, R. J., 1998, “Water Damage in Hospitals Resulting from the Northridge Earthquake,” ASHRAE Trans., Vol. 104, Part 1, American Society of Heating, Refrigerating and Air-Conditioning Engineers, Atlanta, Georgia.
Ayyub, B. M., Beach, J., and Packard, T., 1995, “Methodology for the development of reliability-based design criteria for surface ship structures,” Naval Engineers J. ASNE 107 (1), 45–61.
Ayyub, B. M. and McCuen, R. H., 2002, Probability, Statistics and Reliability for Engineers, CRC Press LLC.
20
Badillo-Almaraz H., 2003, “Seismic fragility testing of suspended ceiling systems,” Master's Thesis, Department of Civil, Structural and Environmental Engineering, University at
Buffalo.
Calladine C. R.., 1974, “Limit analysis of curved tubes,” Journal of Mechanical Engineering Science, 16, p 85-87.
Chattopadhyay, J., Tomar, AKS, Dutta, B. K., and Kushwaha, H. S., 2004, “Closed-form collapse moment equations of through wall circumferentially cracked elbows subject to in-plane bending moment,” J Pressure Vessel Technol, 126, p 307–317.
Chen, S. J., An, Qi, and Zhang, Yi., 2010, “Loading Analysis on the Thread Teeth in Cylindrical Pipe Thread Connection,” Journal of Pressure Vessels Technology, v. 132, p 031202.
Cheng, D. H. and Thailer, H. J., 1968, “In-plane bending of curved circular tubes,” Trans. ASME J. Eng. Industry 90B, p 666.
Clarke, R. A. and Reissner, E., 1951, Bending of curved tubes, Advances in Applied Mechanics vol. 2, Academic Press, New York.
Diem, H. and Muller, K. U., 1987, “Deformation and Failure Behavior of Elbows,” SMiRT, F1 7/9.
FEMA 273, 1997, NEHRP Guidelines for the Seismic Rehabilitation of Buildings, Washington, DC, October 1997.
FEMA 577, 2007, Risk Management Series Design Guide for Improving Hospital Safety in Earthquakes, Floods, and High Winds, June 2007.
Galambos, T. V., Ellingwood, B., MacGregor, J.G., and Cornell, C.A., 1982, “Probability-Based Load Criteria: Load Factors and Load Combinations”, ASCE Journal of Structural Division, Vol. 108, No. 5, 978-997.
21
Gupta, Abhinav and Choi, Byounghoan, 2003, “Reliability-based load and resistance factor design for piping: an exploratory case study,” Nucl. Eng. Des., 224, p 161-178.
Haldar, A. and Mahadevan, S., 2000, Probability, Reliability and Statistical Methods in Engineering Design, John Wiley and Sons.
Hovgaard, W., 1926, The elastic deformation of pipe bends, J. Math. Phys. 6 (No. 2), p 69. Ju, Bu-Seog, Tadinada Sashi K, and Gupta, Abhinav, 2011, “Fragility Analysis of Threaded T-Joint Connections in Hospital Piping Systems,” ASME 2011 Pressure Vessels and Piping Conference, Baltimore, Maryland, PVP2011-57958
Kafka, P. F. and Dunn, M. B., 1956, “Stiffness of curved circular tubes with internal pressure,” Trans. ASME 78E, p 247.
Kennedy, R. P., 1997, “Using Component Test Data to Assist in Establishing Code Criteria to Achieve the Desired Seismic Capacity Margin,” Technical Report, PRK Consulting, Yorba Linda, CA, September 1997.
Kim, Yun-Jae and Oh, Chang-Sik, 2006, “Closed-form plastic collapse loads of pipe bends under combined pressure and in-plane bending,” Engineering Fracture Mechanics, 73, p 1437-1454.
Markl, A. R. C., 1952, ‘‘Fatigue Tests of Piping Components,” Trans. ASME, 74, p 287– 303.
Matzen, V. C. and Tan, Y., 2002, “The history of the B2 stress index”, Journal of Pressure Vessel Technology, Transactions of the ASME, v 124, n 2, p 168-176.
McKenna, F., Fenves, G. L., Scott, M. H., and Jeremic, B., 2000, “Open System for
Earthquake Engineering Simulation (OpenSees),” Pacific Earthquake Engineering Research Center, University of California, Berkeley, CA.
Miller, A. G., 1988, ‘‘Review of Limit Loads of Structures Containing Defects,” Int. J. Pres. Ves. & Piping, v 32 , p 197-327.
22
Moore, S. E. and Rodabaugh, E. C., 1982, “Background for Changes in 1981 Edition of the ASME Nuclear Power Plant Components Code for Controlling Primary Load in Piping Systems,” Journal of Pressure Vessels Technology, v. 104, p 351-361.
Porter KA., 2003, “An overview of PEER's performance-based earthquake engineering methodology,” Proceedings of Ninth International Conference on Applications of Statistics and Probability in Civil Engineering, San Francisco, CA, 2003.
Rackwitz, R. and Fiessler, B., 1978, “Structural stability under combined random load sequences”, Computers and Structures, 9, 489-584.
Reissner, E., 1949, “On Bending of Curved Thin-Walled Tubes,” Proc. Inst.Mech. Engrs., 1(B):465-479
Rodabaugh, E. C. and George, H. H., 1957, “Effect of internal pressure on flexibility and stress intensification factors on curved pipes and welding elbows,” Trans. ASME 79, p 939. Rodabaugh, E. C. and Moore, S. E., 1978, “Evaluation of the Plastic Characteristics of Piping Products in Relation to ASME Code Criteria,” USNRC NUREG Report No. NUREG/CR-0261, July, 1978.
Saigal, R. K., 2005, “Seismic Analysis and Reliability-Based Design of Secondary Systems,” Ph.D. Dissertation, North Carolina State University, Raleigh, NC.
Smith, R.T., 1967, “Theoretical analysis of the stresses in pipe bends subject to out-of plane bending,” J. Mech. Eng. Sci., 9 (No. 2), p 115.
Spence J. and Findlay G. E., 1973, “Limit load for pipe bends under in-plane bending,” In: Proceeding of the 2nd international conference on pressure vessel technology, San Antonio, vol. 1–28, p 393–9.
Stevenson, J. D., Harris, D. O., Hill, R. S., and Ghiocel, D., 2000, “Analysis of the reliability of piping designed to ASME Boiler and Pressure Vessel Code Allowables,” Report
submitted to ASME Working Group on Piping Design, ASME.
Structural Engineers Association of California (SEAOC), 1995, “Vision 2000, conceptual framework for performance-based seismic design. Recommended Lateral Force
23
Tan, Y., 2001, “Experimental and Nonlinear FEA Investigation of Elbow Leading to a New Definition of the B2 Stress Index,” Ph.D. dissertation, North Carolina State University, Raleigh, NC.
Tan, Y., Matzen, V. C., and Yuan, X., 2001, ‘‘A Margin—Consistent Procedure for
Calculating the B2 Stress Index and a Proposed New Design Equation,’’ Trans. SMiRT-16 Tueda, M., 1934, “Mathematical theories of pressure tube and bending of curved pipes,” Mem. Coll. Eng. Kyoto Imp. Univ. 8, p 102.
Turner, C.E. and Ford, H., 1957, “Examination of theories for calculating the stresses in pipe-bends subject to in-plane bending,” Proc. Inst. Mech. Engrs. 171, p 513.
USNRC, “PRA Procedures Guide: A Guide to the Performance of Probabilistic Risk Assessments for Nuclear Power Plants,” NUREG/CR-2300, 1983.
Vigness, I., 1943, “Elastic properties of curved tubes,” Trans. ASME 65, p 105.
Von Karman, 1911, "Ü ber die formänderung dünnwandieger Rohe, insbersondere federnder ausgliechrohre," Zeitschrift des vereines deutscher ingenieure, 55, p 1889–1895.
Wasilewski, R. J., 1998, “Seismic Restraints for piping System,” ASHRAE Transactions Part 1B, SF-98-14-1, 1273-1285.
24 PART II
A RECONCILIATION OF EXPERIMENTAL AND ANALYTIC RESULTS FOR PIPING SYSTEMS
25 ABSTRACT
26
27 1. INTRODUCTION
28
conditioning (HVAC), and water piping systems can cause direct economic loss and/or indirect loss of life.
In recent years, many researchers have recognized the importance of nonstructural components in buildings and have tried to address at the design stage the requirement of nonstructural components to remain operational and functional after an earthquake. In past earthquakes, piping systems often failed due to the damage at the connections. Ayers and Ezer (1996) report that at the Los Angeles County Olive View Hospital and the Holy Cross Medical Center, sprinkler systems failed at threaded fittings as during the Northridge Earthquake, thereby indicating that the inelasticity was mostly confined to the joint connections. For this reason, Antaki and Guzy (1998) conducted static and dynamic tests on fire protection piping systems designed according to the National Fire Protection Association (NFPA), and characterized the failure modes, the leakage, and rupture limits of grooved couplings and threaded joints. Ryu et al. (2011) conducted a series of monotonic tests on 1 inch diameter specimens of black iron schedule 40 pipe in a cantilever configuration with a threaded flange. It was confirmed that pipe specimens remained in an elastic region for the entire test, and the inelasticity was confined to the threaded connection.
29
Step 1: Develop an effective component level model based on experimental test data. To conduct a full-scale system analysis, an experimentally validated component model such as a nonlinear moment-rotational model for the T-joint has been reconciled with component level test data. Laboratory tests were conducted by the University at Buffalo, State University of New York (UB) as a part of the NEES Grand Challenge Project “Simulation of the Seismic Performance of Nonstructural Systems” on various kinds of
T-joint components in branch lines of sprinkler piping systems (Tian et al., 2010). The behaviors of T-joint connections for each component were modeled by the computational models in the Open System for Earthquake Engineering Simulation (Open Sees, 2010). Step 2: Characterize the failure limit of components in terms of piping performance based on experimental test data. Seismic performance levels for structural or nonstructural systems are achieved if the member forces or deformations on each element in a structural analysis do not exceed predefined limits (SEAOC, 1995; FEMA 273, 1997). ASME Boiler & Pressure Vessel Code (ASME, 2007) specifies the limit load criteria that prevent the gross plastic deformation and large displacement of ductile materials. Using similar approach, the limit criterion of rotations in a piping component can be defined by the moment corresponding to the intersection of the moment-rotation curve and a collapse limit line with twice an angle of the elastic angle from the moment-axis.
30
nonlinear spring models were applied to critical locations of T-joint connections in a system level nonlinear piping model. The system level simulation results were sensitive to the interaction of the piping with the ceiling system. The reconciliation of experimental and analytical results at system level, by incorporating the experimentally validated component level non-linear models, provides a strong basis for evaluating a full-scale system level piping model.
2. DEVELOPMENT OF COMPONENT LEVEL ANALYTICAL MODELS
Many assemblies and sub-assemblies in piping systems such as a threaded piping joint require a nonlinear finite element analysis using dense meshing and special contact elements (Chen et al., 2010; Wittenberghe et al., 2010). For full-scale nonlinear time history analysis in piping systems, however, designing a dense meshing model at piping connections is computationally inefficient. Instead, a simpler, experimentally validated nonlinear finite element model can be used. To do so, experimental monotonic and cyclic tests are required to develop a nonlinear moment-rotation model at the joint connection and to define typical damage states of the piping connection.
2.1 COMPONENT LEVEL EXPERIMENTAL TEST
31
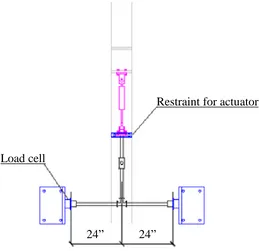
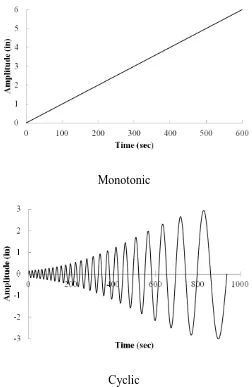
selected to be tested. Various sizes of pipe-6 inch, 4 inch, 2 inch, 1 inch, and ¾ inch- were included in the laboratory tests, and a detailed discussion of the validation of the 1 and 2 inch black iron schedule 40 pipes with treaded joints and the 4 inch black iron schedule 10 pipe with the grooved fit will be provided in this paper. The test setup is shown in Figure 2. In-plane loading is applied from the bottom of the T-shaped component, connected to an actuator with a 6 inch stroke. The loading protocols for both monotonic and cyclic tests are shown in Figure 3. The directions of the loading were forward for the monotonic test and both forward and reverse for the cyclic test, the axis perpendicular to the center of the T-joint. The tests were performed with a constant loading rate of 0.01 in/sec for the monotonic test, and it was gradually increased with each cycle up to the maximum rate of 0.2 in/sec for the cyclic test. City water pressure was used through a water hose at the piping component arrangement to detect water leakage.
32
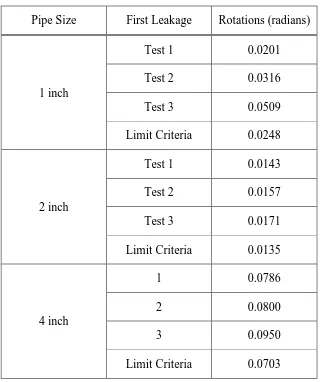
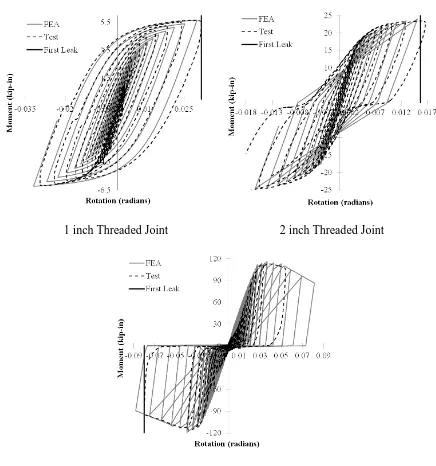
characterized system failure in terms of "First Leakage" and if observed, in terms of “pipe fracture”. He defined the limit state in terms of the performance of the threaded T-joint connection corresponding to the first leakage in the cyclic loading condition. Table 1 shows the detected "First Leakage" points in the three cyclic tests with 1 inch, 2 inch, and 4 inch T-joint connections. The ranges of the measured rotation at first leakage in the cyclic tests were 0.020 – 0.051 radians, 0.014 – 0.017 radians, and 0.079 – 0.095 radians for the 1 inch and 2 inch black iron schedule 40 pipes with treaded joints and the 4 inch black iron schedule 10 pipe with the grooved fit, respectively. The detected leakage points in rotation from the cyclic test were always smaller in rotation than the detected "First Leakage" points from the monotonic test, as shown in Figure 4 and Table 1. Detailed discussion of a structural component or system failure in terms of the "First Leakage" limit state will be discussed later.
2.2 COMPONENT LEVEL FINITE ELEMENT MODELS
33
by the test data. Branches of the piping were modeled with frame elements, and they were connected to either side of the flanges, which are supported by a hinge on one end and a support that acts like a roller at the other. The monotonic and cyclic loadings as shown in Figure 3 were applied as an axial load at the bottom of the T-joint.
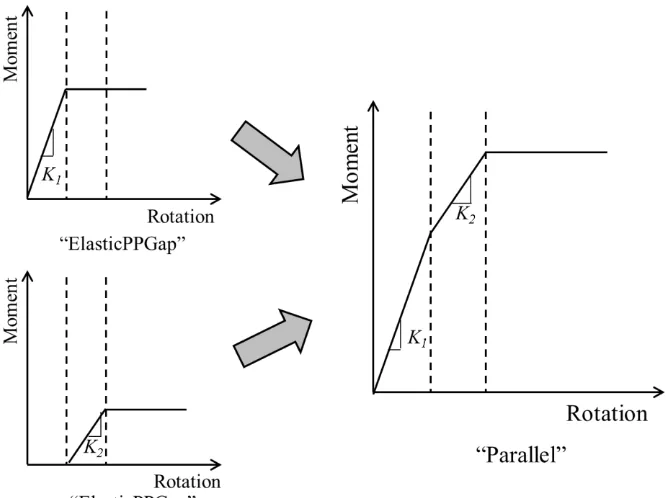
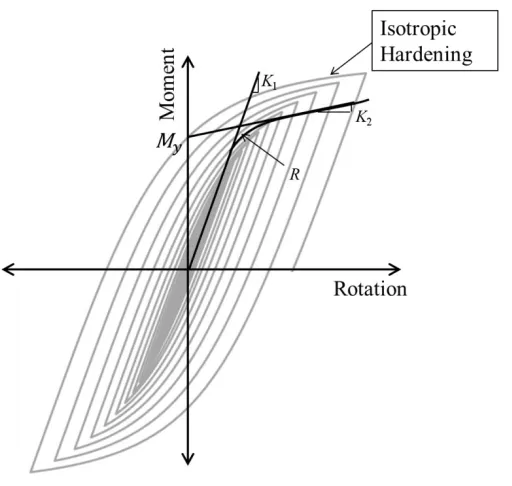
The moment–rotation curves between experimental and analytical results for the monotonic and cyclic loadings agree well, as shown in Figure 6 and Figure 7. The test data was used to define rotational spring properties for each T-joint connection. The rotational springs for the monotonic and hysteretic behavior were characterized by models in Open Sees Element Package (Mazzoni et al., 2006). Figure 8 shows a schematic figure in which the stiffness of a multi-linear monotonic model is specified by combination of parallel linear models. The hysteretic behavior of T-joint connections for 1 inch piping is characterized by yield strength My, initial stiffness K1, hardening stiffness K2, and parameter R, which controls
the transition from elastic to plastic branches as shown in Figure 9. The isotropic hardening parameter defines the increase of the compression or tension yield envelope as a proportion of yield strength after a plastic strain. The hysteretic behavior of T-joint connections in 2 inch and 4 inch piping is characterized by a material that represents a "pinched" moment-rotation response as shown in Figure 10. Pp1, Pp2, Pp3, and Pp4are the moment points under the
positive loading condition. As shown in this figure, a “pinched” behavior can be represented relatively simply by using 8 points. Four of these points, Pn1, Pn2, Pn3, and Pn4 are the
moment points under the reverse loading condition. FN is the moment point that defines the
34
developed under monotonic loading. The point FP defines this strength ratio for unloading
from a negative load. DN and DPare the points defining the moment ratio at which reloading
begins. The cyclic strength and stiffness degradation properties are determined in this model by considering stiffness degradation during unloading and reloading and strength degradation from the test data.
3. CHARACTERIZATION OF DAMAGE STATE BY LEAKAGE
35
above with the criterion that forms the basis of design guidelines specified in the ASME Boiler & Pressure Vessel Code (ASME 2007) which specifies the limit load criterion based on preventing the gross plastic deformation and large displacement of ductile materials. Gerdeen (1979) gives detailed guidance and explanations of this criterion. He defined the collapse limit by a comparison of elastic and plastic work contributions. In his approach, when the load reaches the collapse load, gross deformation occurs and the plastic work becomes significant compared to the elastic work. Using the same methodology, the criterion can be defined as limit rotation corresponding to the collapse moment in terms of performance characterization. Figure 12 shows the moment corresponding to the intersection of the moment-rotation curve and a collapse limit line such that relative to the ordinate. Angle θ is defined as the initial slope of the moment-rotation curve with respect to the moment-axis. Since the angle θ is typically small, it can be assumed as . Ju (2011) used this criterion to define failure in terms of "First Leakage" in 2 inch black iron threaded T-joint piping connections. We applied this approach to 1 inch black iron treaded and 4 inch black iron grooved fit T-joint piping connections. The safety demand against “leakage” is the primary objective in a pipe-joint connection of the types encountered in
36
with the grooved fit. The values of the rotation limit states defined by the criteria are shown in Table 1.
4. SYSTEM LEVEL PIPING PERFORMANCE
4.1 SYSTEM LEVEL EXPERIMENTAL TEST
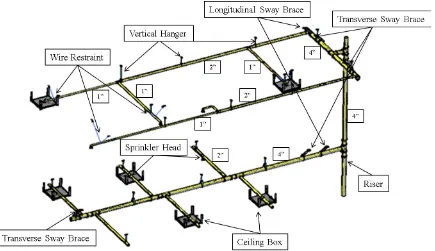
Full-scale laboratory tests were conducted by the University at Buffalo, State University of New York (UB) as part of the NEES Grand Challenge Project “Simulation of the Seismic
37
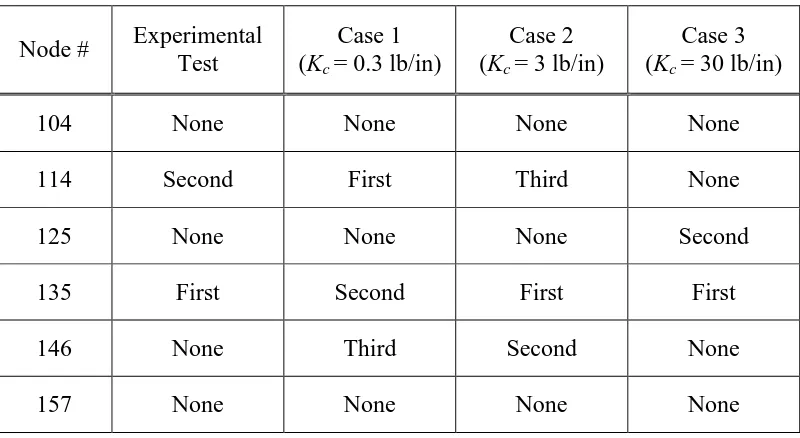
included at the ends of piping braches on the bottom level in this system. The ceiling systems were installed in a grid that was hung with suspension wires from the top of the test frame. City pressure water was used through a water hose at the piping component arrangement to detect water leakage during the test. The response data during the dynamic test were not provided, but the chronicle leakage locations at T-joint connection in the piping system were reported as shown in Table 2. No leakage was found on the upper level, while two leakage locations, the node numbers 114 and 135, were found on the lower level during the test (See Figure 16).
4.2 SYSTEM LEVEL FINITE ELEMENT MODEL
38
main piping lines and braches were modeled using linear elastic frame elements. The six critical locations on the bottom floor and three locations on the top floor are selected for the nonlinear rotational spring models based on the experimental test. The real mass of pipes including water inside was calculated by the measured weights of the real pipe members, and the mass for the mass blocks were added at the ends of piping braches on the bottom level. The ceiling systems were installed in a grid that was hung with suspension wires from the top of the box frame, and the sprinkler heads were supported by ceiling tiles. This boundary condition between tiles and sprinkler head is not completely fixed or free, i.e. the connectivity acts as partial restraint. Therefore, the ceiling tiles were modeled as spring elements to consider the interaction between the piping branch and ceiling system.
5. LEAKAGE LOCATIONS CAUSED BY CEILING SYSTEM INTERACTION
39
elements Kc was used as 0.3 lb/in. Leakage occurred chronologically in node 114, then in
node 135, and finally in node 146 in this analysis. In this case the leakage locations for the nodes 114 and 135 matched with the experimental test results, but chronological order did not. For Case 2, Kc was used 3 lb/in, about 10 times more here than that in Case 1. Leakage
in node 114 followed leakage in node 135, as in experimental observation, but there was an additional leakage in node 146 which was not detected in the experiment. For Case 3, we used more rigid spring elements with Kc = 30 lb/in. In this analysis, the first leakage location,
40
location and chronological order in a piping system is very sensitive to the definition of the limit-state.
6. CONCLUSIONS
In this paper, we present a technique to reconcile the component level piping and system level piping models with experimental results. The laboratory tests were conducted at the University at Buffalo on various T-joint components such as threaded connections on 1 inch and 2 inch pipes and a grooved fit on a 4 inch pipe in sprinkler systems. Simple laboratory tests of the threaded and grooved fit connections under monotonic and cyclic loading provide insights into the behavior and the typical damage patterns. An accurate FE model for a connection like a threaded piping joint often requires dense meshing using special contact elements, thus making the problem computationally inefficient. The T-joint connection was, instead, modeled by two non-linear rotational springs, one on either side, with spring model parameters determined by the test data. The nonlinear moment-rotation models for threaded and grooved fit T-joints reconciled well with the experimental results for various different pipe sizes.
41
angle approach of the criterion gives a good prediction of the limit for the 1 inch and 2 inch black iron schedule 40 pipes with treaded joints as well as the 4 inch black iron schedule 10 pipe with the grooved fit.
42 ACKNOWLEDGEMENTS
43 REFERENCES
American Society of Mechanical Engineers, 2007, Rules for construction of nuclear facility components, ASME Boiler & Pressure Vessel Code, Section III.
Antaki, G. and Guzy, D., 1998, “Seismic Testing of Grooved and Threaded Fire Protection Joints and Correlation with NFPA Seismic Design Provisions,” ASME 1998, PVP-Vol. 364, Seismic Engineering-1998, 69-75
Ayers, J. Marx, 1996, Northridge Earthquake Hospital Water Damage Study, Ayers & Ezers Associates, Inc. Los Angeles, California.
Ayres, J. M. and Phillips, R. J., 1998, “Water Damage in Hospitals Resulting from the Northridge Earthquake,” ASHRAE Trans., Vol. 104, Part 1, American Society of Heating, Refrigerating and Air-Conditioning Engineers, Atlanta, Georgia.
Chen, S. J., An, Qi, and Zhang, Yi, 2010, “Loading Analysis on the Thread Teeth in Cylindrical Pipe Thread Connection,” Journal of Pressure Vessels Technology, v. 132, p 031202.
Gerdeen J. C., 1979, “A critical evaluation of plastic behavior data and a united definition of plastic loads for pressure vessel components,” WRC Bull 1979; 254.
FEMA273, 1997, NEHRP Guidelines for the Seismic Rehabilitation of Buildings. Washington, DC, October 1997.
FEMA 577, 2007, Risk Management Series Design Guide for Improving Hospital Safety in Earthquakes, Floods, and High Winds, June 2007.
Ju, Bu-Seog, Tadinada, Sashi K, and Gupta, Abhinav, 2011, “Fragility Analysis of Threaded Tee-joint Connections in Hospital Piping Systems,” ASME 2011 Pressure Vessels and Piping Conference, Baltimore, Maryland, PVP2011-57958
Mazzoni, S., Mckenna, F., Scott, M. H., Fenves, G. L., and et al., 2006, “OpenSees Command Language Manual,” Open System for Earthquake Engineering
44
Ryu, Yonghee, Behrouzi, Anahid, Melesse, Tsega, and Matzen, C. Vernon, 2011, “Inelastic behavior of threaded piping connections: Reconciliation of experimental and analytic results,” AMSE 2011 Pressure Vessels and Piping Conference, Baltimore, Maryland, PVP2011-57949.
Structural Engineers Association of California (SEAOC), 1995, “Vision 2000, conceptual framework for performance-based seismic design. Recommended Lateral Force
Requirements and Commentary,” 1996, 6th Edition. Sacramento, CA: 391-416.
Tian, Yuan, Fuchs, Jessica, Mosqueda, Gilberto, and Filiatrault, Andre, 2010, “NEESR Nonstructural: Progress Report on Tests of Tee Joint Component of Sprinkler Piping System”, Progress Report, NEESR-GC: Simulation of the Seismic Performance of Nonstructural Systems, October, 2010
Tian, Yuan, 2011, “Progress Report of Sprinkler Piping Subsystems Dynamic Test on NCS”, Progress Report, NEESR-GC: Simulation of the Seismic Performance of Nonstructural Systems, April, 2011
Wasilewski, R. J., 1998, “Seismic Restraints for piping System,” ASHRAE Transactions Part 1B, SF-98-14-1, 1273-1285.
45
Table 1: First Leakage
Pipe Size First Leakage Rotations (radians)
1 inch
Test 1 0.0201
Test 2 0.0316
Test 3 0.0509
Limit Criteria 0.0248
2 inch
Test 1 0.0143
Test 2 0.0157
Test 3 0.0171
Limit Criteria 0.0135
4 inch
1 0.0786
2 0.0800
3 0.0950
46
Table 2: Detected Leakage Locations
Node # Experimental Test
Case 1 (Kc = 0.3 lb/in)
Case 2 (Kc = 3 lb/in)
Case 3 (Kc = 30 lb/in)
104 None None None None
114 Second First Third None
125 None None None Second
135 First Second First First
146 None Third Second None
47
Table 3: Analysis Results at T-joint Connection on Bottom Floor (Case 2)
Node # Rotation
(radians)
104 0.0129
114 0.0158
125 0.0134
135 0.0176
146 0.0153
48
Structural Damage Nonstructural Damage
49
Figure 2: Tests of T-joint Component (Tian et al., 2010)
24” 24”
Restraint for actuator
50 Monotonic
Cyclic
51
52 Monotonic
Cyclic
53 Monotonic
Cyclic
54 Monotonic
Cyclic
55
56
1 inch Threaded Joint 2 inch Threaded Joint
4 inch Grooved Fit Joint
57
1 inch Threaded Joint 2 inch Threaded Joint
4 inch Grooved Fit Joint
58
59
60
61
62
1 inch Threaded Joint
63
64
65
66
1 inch Threaded Joint
67
68
69 Upper Story
Lower Story
70
71
72 PART III
FRAGILITY EVALUATION IN BUILDING-PIPING SYSTEMS: EFFECT OF PIPING INTERACTION WITH BUILDING
73 ABSTRACT
Many studies assessing the damage from the 1971 San Fernando and 1994 North Ridge earthquakes reported that the failures of non-structural components like sprinkler piping systems were one of the significant causes of shutting down hospitals immediately after the earthquake. This paper is focused on evaluating seismic fragility of a large-scale piping system in representative high-rise, middle-rise, and low-rise buildings using nonlinear time history analyses. Piping fragilities were evaluated empirically by using experimentally validated nonlinear finite element models. The emphasis in this study is on evaluating the effects of piping interaction with building performance on piping fragility. The building models included the effects of building nonlinearity due to nonlinear behaviors of beams and columns, in which the element models were designed by using a plastic hinge fiber model as well as a linear frame model.
74
75 1. INTRODUCTION
76
Performance-based design and seismic probabilistic risk assessment of structural systems and its components have been the subjects of great concern over the past several decades, especially for seismic loads. Performance-based design is a methodology that addresses performance instead of load-resistance in the system in terms of risks like collapse and fatalities (Porter, 2003). Seismic performance satisfy levels for structural or nonstructural systems are achieved if the member forces or deformations on each element in structural analysis do not exceed predefined limits (SEAOC, 1995; FEMA 273, 1997). In the nuclear
energy area, fragility curves of a component Pf
a are characterized by the probability offailure for nuclear power plant (NPP) structural and nonstructural components as a function of a specified damage criterion at seismic excitation of peak ground acceleration (PGA) equal to a (USNRC, 1983). The failure frequency f
c|a
for structures and components is
77
frame representation as well as a plastic hinge fiber model for beams and columns. A related objective is to evaluate the effects of tuning between the building and the piping system. Also, changes in piping fragilities are studied due to consideration of classical versus non-classical damping in a coupled system. The numerical simulations were conducted by nonlinear time history analyses, and the piping fragility was evaluated for building–piping coupled systems. The assumptions made in this research were:
In the piping system, nonlinearity occurs at the T-joint connection.
In the building, nonlinearity occurs at the plastic hinge fiber.
Piping failure is defined in terms of “First Leakage.”
2. DESCRIPTION OF MODELS
78 2.1 PIPING SYSTEM DESCRIPTION
A system level finite element piping model discussed in Part II was validated using experimental data provided by the University at Buffalo, State University of New York (UB) (Tian, 2010; Tian et al., 2011). The main piping line and riser were made of 4 inch pipes, and the branches were comprised of pipes with 1 inch and 2 inch diameters. Schedule 10 pipes with steel groove fit connections were used for the main line and riser, and Schedule 40 pipes with black iron threaded connections were used for the branch lines. This system was supported by transverse sway braces, longitudinal sway braces, wire restraints and vertical hangers. It includes sprinkler heads and ceiling boxes. The real weight of pipes, including water inside, was included the mass of the piping system.
2.2 BUILDING DESCRIPTION