20th International Conference on Structural Mechanics in Reactor Technology (SMiRT 20) Espoo, Finland, August 9-14, 2009 SMiRT 20-Division 5, Paper 1702
Identification of Modal Parameters of a Containment Using
Ambient Vibration Measurements
Sanghyun Choi
a, Dae-Hyuk Kim
a, Sooyong Park
b, Yung-Moo Shin
b, Ha-Yeon Kim
b,
Chang-Hun Hyun
c, Moon-Soo Kim
c, and Sang-Yun Kim
ca
Korea National Railroad College, Dept. of Railroad Facility Engineering, Uiwang, Kyunggi-do 437-763, Korea, e-mail: [email protected]
b
Korea Maritime University, Pusan, Korea
c
Korea Institute of Nuclear Safety, Daejeon, Korea
Keywords: Modal Parameters, Containment, Ambient Vibration, Structural Integrity Monitoring, Resonant Frequency.
1
ABSTRACT
The importance of maintaining the structural integrity of a containment, which preserves the nuclear reactor and the other safety related systems from man-made as well as natural disasters, and protects publics from hazardous radioactive materials can never be exaggerated. So far, the structural integrity of the containment has been evaluated periodically via visual inspections, chemical tests, nondestructive strength tests, etc. However, these methods can only provide the local information on the structural condition and require considerable time and cost to estimate overall structural integrity. In this paper, modal parameters of the containment, which can be utilized in evaluating the structural integrity of the containment, are identified from the ambient vibration measurements. The modal parameters, i.e., resonant frequencies and corresponding mode shapes, are extracted using the modal identification techniques in the frequency domain, i.e., the peak picking and the frequency domain decomposition methods. The relevance to the analytical modal parameters is established using the finite element method.
2
INTRODUCTION
Ensuring and maintaining the structural integrity of the containment in nuclear power plants is essential in preserving the nuclear reactor and the safety related systems from man-made as well as natural disasters, and protecting plant workers and publics from hazardous radioactive materials. Especially the structural condition of the reinforced concrete and prestressing system which constitute the containment should be continuously monitored, because of the time-dependent characteristics of concrete that may result in the degradation of strength, crack, and neutralization. To date, the structural integrity of the containment has been evaluated periodically via visual inspections, chemical tests, nondestructive strength tests, etc. However, these methods can only provide the local information on the structural condition and require considerable time and cost to estimate overall structural integrity of such large structures as containment. That shortcoming can be overcome by continuously inspecting and quantifying the structural integrity via utilizing a health monitoring method based on the dynamic response measuring technique and the system identification. During the past few decades, research on monitoring the structural integrity of civil structures using dynamic response measurements has actively conducted (Doebling et al., 1996), and successful applications have been reported (Choi et al., 2004).
identification techniques in the frequency domain, i.e., the peak picking (Bendat and Piersol, 1993) and the frequency domain decomposition (Brincker et al., 2000) methods. To identify the relevance to the analytical modal parameters, a finite element model for the containment of the Ulchin Unit 5 is constructed and the correspondence between the extracted experimental and the analytical modal parameters are established.
3
DESCRIPTION OF THE STRUCTURE
The Ulchin Unit 5 is located in Kyeongsangbuk-do, South Korea, and its containment is made of reinforced concrete. The containment is composed of a circular base mat, an upright cylindrical walls and spherical-shape dome. The thickness of the cylindrical wall is 1,220 mm. The thicknesses of the dome and the base mat are 1,070 mm and 3,600 mm, respectively. The post-tensioning system with horizontal and vertical tendons is installed in the wall and the dome. The height and the inner diameter of the structure are 67 m and 43.9 m, respectively. On inner surface of the containment, 5 mm thick steel liner plates are installed. The cross section of the containment structure is depicted in Fig. 1. The two neighbouring structures, i.e. the primary auxiliary building and the nuclear fuel building, are physically separated with the gaps between the structures filled by chemical substances.
4
AMBIENT VIBRATION TEST
4.1 Test setup and procedure
Instrumentation used to conduct the ambient vibration testing consisted of 6 strain-gage-type accelerometers, a digital dynamic strain meter, an amplifier, and a portable computer. Data acquisition software installed in the computer was the Visual Log DRA-7630. The length of acquired time window was about 170 minutes for all datasets.
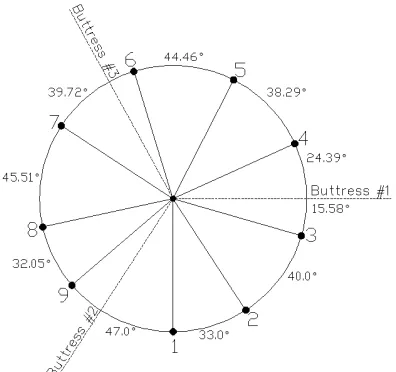
Measurement locations were chosen to identify structural configuration of the modes of interest. Only horizontal acceleration responses normal to the outer surface of the containment were measured. The accelerometers were mounted on the outer surface of the containment structure at 9 locations of the same level (2.7 m above the roof top of the primary auxiliary building and 29.3 m above the basemat) as depicted in Fig. 2. Except Sensors 1 through 5, other sensors were attached using a bucket truck. Due to the limitation of the number of sensors, the measurements were taken as two separate sets for two days: Set 1 (Sensors 1 through 5) on day one and Set 2 (Sensors 6 through 9) on day two. The reference sensor, at which acceleration responses were measured in both Set 1 and Set 2, was installed between Sensor 1 and Sensor 9 and 3 m above other roving sensors.
Figure 2. Sensor locations
The weather conditions were cloudy with 22 °C degree on day one and rainy with 21 °C degree on day two. To minimize the influence of the rain on day two, the sensors were fully wrapped up with watertight tape. The major excitation source inside the containment was the reactor coolant pump with rpm of 1190 (19.8 Hz).
4.2 Identification of modal parameters
The modal parameters were extracted using modal identification techniques in the frequency domain, i.e., the peak picking and the frequency domain decomposition (FDD) methods. In usual peak picking practice, the transmissibility, which is the ratio of a roving response divided by a fixed reference response for output only modal analysis, is utilized to determine the resonances. However, since peaks in the transmissibility measurement are not the evidence of resonances and thus at least one auto spectrum must be supplemented for locating resonance peaks, the operational deflection shape frequency response function (ODS FRF) is utilized in this paper (Vold et al., 2000). The ODS FRF is formed by combining the magnitude of a roving response auto spectrum with the phase of the cross spectrum between the roving response and the reference response. Unlike the transmissibility, the peaks in the ODS FRF graph represent the resonances. Also, while the transmissibility automatically takes care of the effects of a variable force level between measurement sets, the magnitudes of a set of ODS FRFs must be corrected to account for changes in the excitation level between the measurement sets. The correction can be achieved through multiply the magnitude of every ODS FRF in the ith measurement set by a scale factor, SFi, defined below:
i ns k k i
S ns
S SF
!
=
"
=1 (1)where ns is the number of measurement sets and S is the averaged value of the reference response auto spectrum for the ith measurement set.
(a) acceleration response
(b) auto spectrum
Figure 3. Measured acceleration response and corresponding auto spectrum at Sensor 1
Table 1. Extracted resonant frequencies
Mode Pick Picking FDD
1 7.715 7.690
2 8.813 8.838
3 10.01 10.01
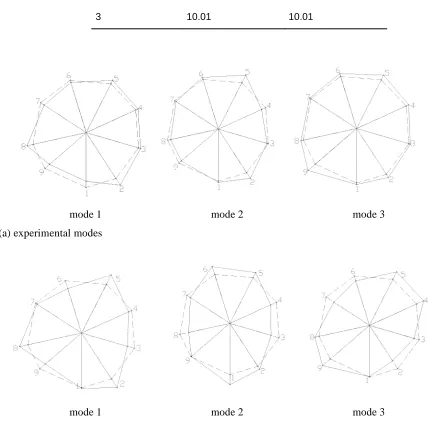
mode 1 mode 2 mode 3
(a) experimental modes
mode 1 mode 2 mode 3
(b) analytical modes
Figure 5. Experimental and analytical modeshapes
The main procedures for the FDD technique are as follows (Gentile and Bernardini, 2008):
(1) Evaluation of the spectral matrix G(!), i.e., the matrix where diagonal terms are auto spectrums while the other terms are cross spectrums;
(2) Find SVD of G(!) at each frequency as:
T U X U
G(!)= (!) (!) (!) (2)
(3) Inspection of the curves representing the singular values to identify the resonant frequencies and estimate the corresponding mode shape using the information contained in the singular vectors of the singular value decomposition.
For the measurements from the containment, the spectral matrix was calculated for every 2,048 data with 50% data overlapping. From the FDD, three distinct resonant frequencies were identified as summarized at third column in Table 1. In the table, it can be seen that the resonant frequencies extracted by two methods, i.e., the peak picking and the FDD, are almost identical.
5
ANALYTICAL MODELING
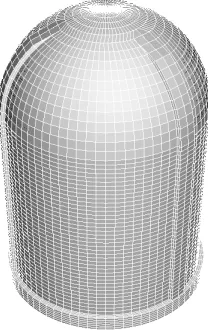
The numerical model of the containment was built using the commercial finite element program ABAQUS (Jeon et al., 2005). Fig. 6 depicts schematics of the finite element model. The concrete parts of the containment including walls, buttresses, and base mat were modeled using 3-D solid elements. The elastic constant, the poisson’s ratio, the mass density of the concrete was modeled as 29.5 MPa, 0.17, and 2300 kg/m3 respectively. All the reinforcing steels (yield strength of 420 MPa) were idealized as distributed stiffness in the walls considering spacing, diameters, directions, and locations. The tendons were modeled using truss elements embedded in the walls. The inner steel liners with the yield strength of 224 MPa were modeled using shell elements. The elastic modulus of reinforcing bars and tendons was modeled as 196 MPa and 200 MPa, respectively. The translational movements of the bottom of the basemat was restrained. The free vibration analysis was conducted to obtain the resonant frequencies and the corresponding mode shapes. The analytical mode shapes of the most correspondence with the experimental mode shapes are depicted in Fig. 5.
Figure 6. Finite element model for the containment
6
CORRELATION BETWEEN THE EXPERIMENTAL AND NUMERICAL MODELS
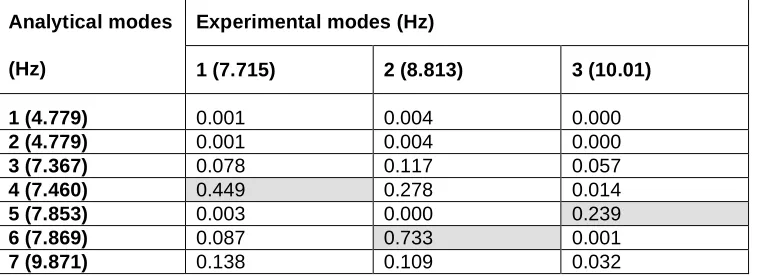
The correspondence between the obtained numerical and the experimental mode shapes can be quantified using the modal assurance criterion (MAC) (Allemang and Brown, 1982).
j T j i T i j T i j i MAC ! ! ! ! ! ! ! ! 2 ) ,
( = (3)
where !i represents ith mode shape vector.
MAC value of 0.733, the second mode is closely related with the 6th analytical mode while the other two modes show insufficient correlations. The authors attribute poor MAC values obtained for the first and third modes to inevitable errors involved in measuring sensor locations, geometric complexities comparing to one-dimensional bridge structures, variation in the weather conditions, etc.
7
CONCLUSIONS
In this paper, the ambient vibration measurements from the containment of Ulchin NPP Unit 5 and the modal parameters, i.e., resonant frequencies and corresponding mode shapes, extracted using the modal identification techniques in the frequency domain, i.e., the peak picking and the frequency domain decomposition methods, were presented. From the study, the following conclusions are drawn:
(1) from the ambient vibration measurements, resonant frequencies along with corresponding mode shapes can be extracted using the frequency domain modal identification techniques;
(2) using the finite element model for the containment, the correlations between the experimental and analytical mode shapes are established via the MAC, and one mode shows acceptable correlation; and
(3) in measuring the ambient vibration of the containment, more corroborated efforts are needed to enhance the accuracy of the identified modal parameters.
Acknowledgements. This research was supported by the Korea Institute of Nuclear Safety (Contract Number RS05-56-PB). The authors also thank Korea Hydro & Nuclear Power Co. and Daewoo Institute of Construction Technology Co. for their supports and cooperation in modal testing and analyzing the containment of Ulchin NPP Unit 5.
Table 2. MAC values
Experimental modes (Hz) Analytical modes
(Hz) 1 (7.715) 2 (8.813) 3 (10.01)
1 (4.779) 0.001 0.004 0.000
2 (4.779) 0.001 0.004 0.000
3 (7.367) 0.078 0.117 0.057
4 (7.460) 0.449 0.278 0.014
5 (7.853) 0.003 0.000 0.239
6 (7.869) 0.087 0.733 0.001
REFERENCES
Allemang, R.J. and Brown, D.L. 1982. A correlation coefficient for modal vector analysis. Proceedings of the 1st International Modal Analysis Conference (IMAC), Orlando, FL.
Bendat, J.S. and Piersol, A.G. 1993. Engineering Applications of Correlation and Spectral Analysis, Wiley Interscience, New York.
Brincker, R., Zhang, L. and Anderson, P. 2000. Modal identification from ambient responses using frequency domain decomposition. Proc. 18th International Modal Analysis Conferencce (IMAC), San Antonio, TX.
Choi, S., Park, S., Bolton, R., Stubbs, N., Sikorsky, C. 2004. Periodic monitoring of physical changes in a concrete box-girder bridge. Journal of Sound and Vibration, Vol. 278, pp.365-381.
Doebling, S.W., Farrar, C., Prime, M.B., Shevitz, D.W. 1996. Damage identification and health monitoring of structural and mechanical systems from changes in their vibrational characteristics: a literature review. Technical Report LA-13070-MS, Los Alamos National Laboratory.
Gentile, C., Bernardini, G. 2008. Output-only modal identification of a reinforced concrete bridge from radar-based measurements. NDT&E International, Vol. 41, pp.544-553.
Jeon, S.J., Lee, Y.S., Chung, C.H. and Chung, Y.S. 2005. Dynamic nonlinear response of domestic nuclear containment buildings subjected to large aircraft impact load. KSCE Journal of Civil Engineering, Vol. 25(1A), 191-200.