c
Owned by the authors, published by EDP Sciences, 2017
Measurements of the Vector boson production with the ATLAS
Detector
Kostas KORDAS1,a, On behalf of the ATLAS Collaboration
1Department of Physics, Aristotle University of Thessaloniki, Thessaloniki, GR-54124 Greece
Abstract.The electroweak sector of the Standard Model can be tested by precision mea-surements of its fundamental parameters, such as theWboson mass or the electroweak mixing angle. In this contribution we present the first measurement of theWboson mass, based on the 7 TeV data set corresponding to an integrated luminosity of 4.6 fb−1. With this data set the detector and physics modelling have been studied in great detail, leading to an overall uncertainty of 19 MeV. The ATLAS collaboration also performed a new precise triple differentialZ/γ∗Drell-Yan cross-section measurement as a function of the
dilepton mass, the dilepton rapidity and cosθ∗defined in the Collins-Soper frame. This
measurement provides sensitivity to the PDFs and theZforward-backward asymmetry,
AFB, which is derived and will be presented. The latter builds the foundation for a possi-ble future extraction of the weak-mixing angle. The production of jets in association with vector bosons is an important process to study perturbative QCD in a multi-scale envi-ronment. The ATLAS collaboration has performed new measurements of vector boson plus jets cross sections, differential in several kinematic variables, in proton-proton
col-lision data, taken at center-of-mass energies of 8 TeV and 13 TeV. These measurements are presented and compared to state-of-the art theory predictions. They are sensitive to higher-order pQCD effects, and can be used to constrain the proton structure. In addition,
we present a new measurement of the splitting scales of thektjet-clustering algorithm for final states containing aZ-boson candidate at a centre-of-mass energy of 8 TeV.
1 Introduction
The electroweak sector of the Standard Model (SM) can be tested by precision measurements of
fun-damental parameters, such as theWboson mass (mW) and the electroweak mixing angle ( sin2θW). In
addition, precise cross section measurements ofWandZproduction constrain the Parton Distribution
Functions (PDFs) and are sensitive probes of higher order QCD corrections. In this note a collection of various ATLAS [1] measurements on these topics are presented, starting with the measurement of
theWmass [2] which is determined with an overall uncertainty of 19 MeV, on par with the best single
measurement to-date from CDF [3]. Then, inclusive production measurements ofWandZbosons are
presented, where unprecedented precision and strong constraints on PDFs, in particular the
strange-quark density, are obtained [4]. The production ofZbosons in various jet multiplicities is presented
next [5], as well as a measurement of the jet splitting scales in such events [6]; these measurements
are compared to state-of-the art theory predictions. Last, the triple differential cross section of the
Z/γ∗ Drell-Yan production is presented [7] and the forward-backward asymmetry is derived, which
forms the base for a future measurement of the electroweak mixing angle.
2
W
mass measurement
At lowest order in the electroweak theory, the W-boson mass, mW, can be expressed solely as a
function of theZ-boson mass,mZ, the fine-structure constant,α, and the Fermi constant,GF.
Higher-order corrections introduce an additional dependence on the gauge couplings and the masses of the
heavy particles of the SM. Thus, in the SM theW-boson mass is particularly sensitive to the top-quark
and Higgs-boson masses, while in theories beyond the SM theW mass receives contributions from
additional particles and interactions. These effects can be probed by comparing the measured and
predicted values ofmW . The world average value ismW =80385±15 MeV [8], driven by the CDF
measurement [3]. Given the precisely measured values ofα,GF andmZ , and recent top and Higgs
mass measurements [8], the SM prediction ismW =80356±8 MeV according to Ref. [9] andmW =
80362±8 MeV according to Ref. [10]. In the context of global fits to the SM parameters, constraints
on physics beyond the SM are currently limited by theW-boson mass measurement precision [9];
thus, 8 MeV is a good target for the precision of the measuredWmass.
Data collected by ATLAS at √s = 7 TeVppcollisions are used for the measurement reported
here [2]. The W mass is measured in decays of the W to leptons, W− → −ν¯
and their charge
conjugate decays, withdenoting electrons or muons. In such events theW mass is derived from fits
to the distributions of the leptonpT(pT) and theW-bosonmT, wheremT =
2p
TpmissT (1−cos∆φ)
is the transverse mass of theW boson; pmissT = −(p
T +uT) is the missing transverse momentum;
uT is the transverse momentum of the “recoil” accompanying the producedW, determined from the
vector sum of all energy deposits in the calorimeter excluding the one from the lepton; and∆φis the
azimuthal opening angle between the charged lepton and the missing transverse momentum.
Template distributions for variousmWvalues are compared to the observed pT andmT
distribu-tions, and this yieldsmW based on aχ2test. The templates are affected by the modeling of both the
background and the signal, with the later dominating by far the uncertainty of the measurement. The
effects on the signal modelling are classified in two broad categories: the “physics modelling” (the
description of theW recoil, the pT distribution of theW, the fraction ofW-bosons produced in the
various helicity states, and the proton PDFs), and the “detector response” (energy and momentum
calibration, as well as lepton identification and reconstruction efficiencies).Z→e+e−andZ→µ+µ−
events are used to calibrate the detector, control the physics modelling and validate the mass extraction
method. The mass of theW-boson is extracted in various categories (electron/muon decay channels,
lepton charge and pseudorapidity), with both thepT andmT methods, for cross-checking. The final
Wmass is obtained from the combination of all these measurements. An overview of the variousmW
determinations and their weights in the overall combination is shown is Figure 1.
The systematics from the physics modelling amount to 14 MeV. The largest contribution comes
from the PDFs, which improves in the combination ofW+andW−to become 9.2 MeV. The next two
biggest contributions, at6 MeV each, are from the uncertainty on theW pT and from the angular
coefficients in the description of the fraction of theW bosons produced in the different polarization
states. Both of these sources of uncertainty have a similar effect onmW between theW+ andW−
states and between thepT andmT kinematics. The QED/ElectroWeak modelling of the final state
radiation, and the interference between the initial and final state radiations contribute 5.5 MeV to the
are compared to state-of-the art theory predictions. Last, the triple differential cross section of the
Z/γ∗ Drell-Yan production is presented [7] and the forward-backward asymmetry is derived, which
forms the base for a future measurement of the electroweak mixing angle.
2
W
mass measurement
At lowest order in the electroweak theory, the W-boson mass, mW, can be expressed solely as a
function of theZ-boson mass,mZ, the fine-structure constant,α, and the Fermi constant,GF.
Higher-order corrections introduce an additional dependence on the gauge couplings and the masses of the
heavy particles of the SM. Thus, in the SM theW-boson mass is particularly sensitive to the top-quark
and Higgs-boson masses, while in theories beyond the SM theW mass receives contributions from
additional particles and interactions. These effects can be probed by comparing the measured and
predicted values ofmW. The world average value ismW =80385±15 MeV [8], driven by the CDF
measurement [3]. Given the precisely measured values ofα,GF andmZ , and recent top and Higgs
mass measurements [8], the SM prediction ismW =80356±8 MeV according to Ref. [9] andmW =
80362±8 MeV according to Ref. [10]. In the context of global fits to the SM parameters, constraints
on physics beyond the SM are currently limited by theW-boson mass measurement precision [9];
thus, 8 MeV is a good target for the precision of the measuredWmass.
Data collected by ATLAS at √s = 7 TeV ppcollisions are used for the measurement reported
here [2]. The W mass is measured in decays of the W to leptons, W− → −ν¯
and their charge
conjugate decays, withdenoting electrons or muons. In such events theWmass is derived from fits
to the distributions of the leptonpT(pT) and theW-bosonmT, wheremT=
2p
TpmissT (1−cos∆φ)
is the transverse mass of theW boson; pmissT = −(p
T +uT) is the missing transverse momentum;
uT is the transverse momentum of the “recoil” accompanying the producedW, determined from the
vector sum of all energy deposits in the calorimeter excluding the one from the lepton; and∆φis the
azimuthal opening angle between the charged lepton and the missing transverse momentum.
Template distributions for variousmWvalues are compared to the observed pT andmT
distribu-tions, and this yieldsmWbased on aχ2test. The templates are affected by the modeling of both the
background and the signal, with the later dominating by far the uncertainty of the measurement. The
effects on the signal modelling are classified in two broad categories: the “physics modelling” (the
description of theW recoil, the pT distribution of theW, the fraction ofW-bosons produced in the
various helicity states, and the proton PDFs), and the “detector response” (energy and momentum
calibration, as well as lepton identification and reconstruction efficiencies).Z→e+e−andZ→µ+µ−
events are used to calibrate the detector, control the physics modelling and validate the mass extraction
method. The mass of theW-boson is extracted in various categories (electron/muon decay channels,
lepton charge and pseudorapidity), with both thepT andmT methods, for cross-checking. The final
Wmass is obtained from the combination of all these measurements. An overview of the variousmW
determinations and their weights in the overall combination is shown is Figure 1.
The systematics from the physics modelling amount to 14 MeV. The largest contribution comes
from the PDFs, which improves in the combination ofW+andW−to become 9.2 MeV. The next two
biggest contributions, at6 MeV each, are from the uncertainty on theW pT and from the angular
coefficients in the description of the fraction of theW bosons produced in the different polarization
states. Both of these sources of uncertainty have a similar effect onmW between theW+ andW−
states and between thepTandmT kinematics. The QED/ElectroWeak modelling of the final state
radiation, and the interference between the initial and final state radiations contribute 5.5 MeV to the
mWuncertainty.
[MeV]
W
m 80280 80300 80320 80340 80360 80380 80400 80420 80440 80460
ν + l → + , W T l p ν − l → − , W T l p ν ± l → ± , W T l p ν + l → + , W T m ν − l → − , W T m ν ± l → ± , W T m ν ± e → ± , W T l p ν ± e → ± , W T m ν ± µ → ± , W T l p ν ± µ → ± , W T m ν + l → + , W T l -p T m ν l → -, W T l -p T m ν ± l → ± , W T l -p T m (Partial Comb.) W m Stat. Uncertainty Full Uncertainty (Full Comb.) W m Stat. Uncertainty Full Uncertainty ATLAS -1
= 7 TeV, 4.1-4.6 fb
s Combination Weight
Electrons 0.427
Muons 0.573
mT 0.144
p
T 0.856
W+ 0.519
W− 0.481
Figure 1: Left: Overview of themW determinations from the pT andmT distributions, and for the
combination of the pT andmT distributions, in the muon and electron decay channels and forW+
andW− events. The horizontal lines and bands show the statistical and total uncertainties of the
individualmW determinations. The combined result formW, its statistical and total uncertainties are
also indicated (vertical line and bands). Right: Total weights of the electron and muon channels, of
themTandpTdistributions, and of theW+andW−samples in the overall combination to extractmW,
for the optimal fitting range (32<p
T<45 GeV, 66<mT<99 GeV) used for the fit [2].
[MeV]
W
m 80320 80340 80360 80380 80400 80420
LEP Comb. 80376±33 MeV
Tevatron Comb. 80387±16 MeV
LEP+Tevatron 80385±15 MeV
ATLAS 80370±19 MeV
Electroweak Fit 80356±8 MeV
W m Stat. Uncertainty Full Uncertainty ATLAS [GeV] t m 165 170 175 180 185
[GeV] W m 80.25 80.3 80.35 80.4 80.45
80.5 ATLAS mW = 80.370 ± 0.019 GeV
0.70 GeV ± = 172.84 t m 0.24 GeV ± = 125.09 H m t and m W
68/95% CL of m
68/95% CL of Electroweak
t
and m
W
Fit w/o m
(Eur. Phys. J. C 74 (2014) 3046)
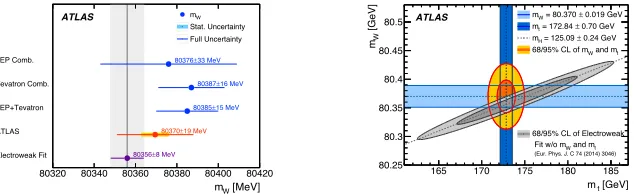
Figure 2:Left:The measured value ofmW is compared to other published results. The vertical band
shows the uncertainty of the theoretical prediction [9], and the horizontal bands and lines show the
statistical and total uncertainties of the ATLAS and other published results.Right:The 68% and 95%
confidence-level contours of the W and top masses determined indirectly from the global electroweak fit [9], are compared to the respective ATLAS measurements, shown with the equivalent confidence-level contours [2].
The systematics from experimental sources amount to 11 MeV, dominated by the lepton
uncer-tainties. Momentum scale and resolution corrections are derived fromZ→+−data, and are
extrap-olated to theW boson using the leptonpTspectra. “Sagitta biases” (from detector displacements and
twists) are studied fromZevents again and fromE/pmeasurements inW →eνdecays. The electron
and muon uncertainties contribute 6.4 MeV and 6.6 MeV, respectively, to themWdetermination. The
response of the detector to the recoil and the modelling of the background contribute 2.9 MeV and 4.5 MeV, respectively.
With a 7 MeV statistical uncertainty on the combined mW measurement, ATLAS achieves an
overall uncertainty of 19 MeV, equal to that of the single best measurement to date from CDF [3],
and reports [2]:mW=80370±19 MeV. In Figure 2 this measurement is compared to other published
3
W
and
Z
/γ
production cross sections
Measurements of the Drell-Yan production ofW andZ/γbosons at the LHC provide a benchmark
of our understanding of perturbative QCD and probe the proton structure in a unique way.
Here, recent high-precision measurements by the ATLAS Collaboration are presented for the
in-clusiveW+→+ν,W−→−ν¯andZ/γ→ +−Drell-Yan production at the LHC (withdenoting
as before electrons and muons) [4], using data of an integrated luminosity of 4.6 fb−1 collected in
proton–proton collisions at √s = 7 TeV. DifferentialW+ andW−cross sections are measured in a
lepton pseudorapidity range|η|<2.5. DifferentialZ/γcross sections are measured as a function of
the absolute dilepton rapidity, for|y|<3.6, for three intervals of dilepton mass,m, extending from 46
to 150 GeV. The results report “fiducial” cross sections, corresponding to the reduced phase-space of the measurements, including the branching ratios for the decay channels.
Integrated measurements forW andZ production cross section in the electron and muon decay
channels are also derived. These measurements, extrapolated to a common fiducial phase space, are used to form cross section ratios, where luminosity uncertainties cancel. Ratios between the electron
and muon channels of the same boson are sensitive to lepton universality. From the ratio of theW
electronic and muonic cross sections (for each channel theWboson cross section is the sum of the W+
and W−cross sections) the ratioRW =BR(W →eν)/BR(W →µν) is obtained. The ATLAS result of
RW =0.997±0.010 is more precise than the combination of LEP results frome+e−→ W+W−data,
as well as from the CDF and LHCb results (see Ref. [4] and references therein). The corresponding
ratio ofZboson cross sections yieldsRZ=BR(Z→e+e−)/BR(Z→µ+µ−)=1.0026±0.0050, which
agrees well with the value obtained from the combination ofe+e− → Z data from LEP and SLC of
0.9991±0.0028 [11]. The ratio ofW+toW−and of theW±sum to theZcross sections is sensitive
to the PDFs, as seen in Figure 3. The predictions for the ratioW±/Zare systematically higher than in
the data, and this is investigated further with the differential cross sections as a function of rapidity.
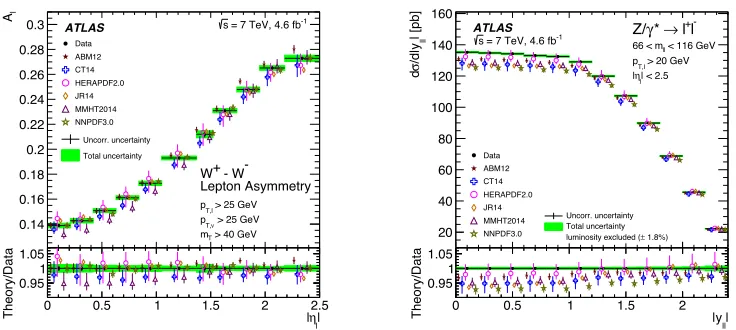
The lepton charge asymmetry,A, inWdecays, defined as the difference between theW+andW−
cross sections over their sum, is shown as a function of the lepton pseudorapidity in Figure 4, left. The data have an accuracy of better than 1% and it is seen that in general all PDFs agree with the data. The
best description is given by NNPDF3.0 which usesWcharge asymmetry data from CMS [12], but, as
shown in Ref. [4], it does not describe well the separate pseudorapidity distributions of+and−. The
HERAPDF2.0 PDF follows well both the charge asymmetry as seen in Figure 4, and the individual+
ν
l
→
-W
fid
σ
/
ν +
l
→ +
W
fid
σ
1.42 1.44 1.46 1.48 1.5 1.52 1.54
ATLAS -1 = 7 TeV, 4.6 fb s
Data stat. uncertainty total uncertainty ABM12 CT14 HERAPDF2.0 JR14 MMHT2014 NNPDF3.0
-l
+
l
→
*
γ
Z/
fid
σ
/
ν
±
l
→
±
W
fid
σ
9.2 9.4 9.6 9.8 10 10.2
ATLAS -1 = 7 TeV, 4.6 fb s
Data stat. uncertainty total uncertainty ABM12 CT14 HERAPDF2.0 JR14 MMHT2014 NNPDF3.0
Figure 3: Ratios of the fiducial cross sections times leptonic branching ratios for theW+ toW−
(left) and for the sum ofW+andW− to theZ (right). In both plots, the sum of electron and muon
channels is taken. The data (solid blue line) are shown with the statistical (yellow band) and the total uncertainties (green band). Theoretical predictions based on various PDF sets are shown with open
symbols of different colours. The uncertainties of the theoretical calculations correspond to the PDF
3
W
and
Z
/γ
production cross sections
Measurements of the Drell-Yan production ofW andZ/γ bosons at the LHC provide a benchmark
of our understanding of perturbative QCD and probe the proton structure in a unique way.
Here, recent high-precision measurements by the ATLAS Collaboration are presented for the
in-clusiveW+→ +ν,W−→−ν¯andZ/γ→ +−Drell-Yan production at the LHC (withdenoting
as before electrons and muons) [4], using data of an integrated luminosity of 4.6 fb−1 collected in
proton–proton collisions at √s = 7 TeV. DifferentialW+andW−cross sections are measured in a
lepton pseudorapidity range|η|<2.5. DifferentialZ/γcross sections are measured as a function of
the absolute dilepton rapidity, for|y|<3.6, for three intervals of dilepton mass,m, extending from 46
to 150 GeV. The results report “fiducial” cross sections, corresponding to the reduced phase-space of the measurements, including the branching ratios for the decay channels.
Integrated measurements forW andZ production cross section in the electron and muon decay
channels are also derived. These measurements, extrapolated to a common fiducial phase space, are used to form cross section ratios, where luminosity uncertainties cancel. Ratios between the electron
and muon channels of the same boson are sensitive to lepton universality. From the ratio of theW
electronic and muonic cross sections (for each channel theWboson cross section is the sum of the W+
and W−cross sections) the ratioRW=BR(W →eν)/BR(W →µν) is obtained. The ATLAS result of
RW =0.997±0.010 is more precise than the combination of LEP results frome+e− →W+W−data,
as well as from the CDF and LHCb results (see Ref. [4] and references therein). The corresponding
ratio ofZboson cross sections yieldsRZ =BR(Z→e+e−)/BR(Z→µ+µ−)=1.0026±0.0050, which
agrees well with the value obtained from the combination ofe+e− → Z data from LEP and SLC of
0.9991±0.0028 [11]. The ratio ofW+toW−and of theW±sum to theZcross sections is sensitive
to the PDFs, as seen in Figure 3. The predictions for the ratioW±/Zare systematically higher than in
the data, and this is investigated further with the differential cross sections as a function of rapidity.
The lepton charge asymmetry,A, inW decays, defined as the difference between theW+andW−
cross sections over their sum, is shown as a function of the lepton pseudorapidity in Figure 4, left. The data have an accuracy of better than 1% and it is seen that in general all PDFs agree with the data. The
best description is given by NNPDF3.0 which usesWcharge asymmetry data from CMS [12], but, as
shown in Ref. [4], it does not describe well the separate pseudorapidity distributions of+and−. The
HERAPDF2.0 PDF follows well both the charge asymmetry as seen in Figure 4, and the individual+
ν l → -W fid σ / ν + l → + W fid σ
1.42 1.44 1.46 1.48 1.5 1.52 1.54
ATLAS -1 = 7 TeV, 4.6 fb s Data stat. uncertainty total uncertainty ABM12 CT14 HERAPDF2.0 JR14 MMHT2014 NNPDF3.0 -l + l → * γ Z/ fid σ / ν ± l → ± W fid σ
9.2 9.4 9.6 9.8 10 10.2
ATLAS -1 = 7 TeV, 4.6 fb s Data stat. uncertainty total uncertainty ABM12 CT14 HERAPDF2.0 JR14 MMHT2014 NNPDF3.0
Figure 3: Ratios of the fiducial cross sections times leptonic branching ratios for theW+ to W−
(left) and for the sum ofW+ andW−to theZ (right). In both plots, the sum of electron and muon
channels is taken. The data (solid blue line) are shown with the statistical (yellow band) and the total uncertainties (green band). Theoretical predictions based on various PDF sets are shown with open
symbols of different colours. The uncertainties of the theoretical calculations correspond to the PDF
uncertainties only [4].
|
l
η
|
0 0.5 1 1.5 2 2.5
l A 0.14 0.16 0.18 0.2 0.22 0.24 0.26 0.28 0.3 Uncorr. uncertainty Total uncertainty Data ABM12 CT14 HERAPDF2.0 JR14 MMHT2014 NNPDF3.0 -1
= 7 TeV, 4.6 fb s - W + W Lepton Asymmetry
> 25 GeV
T,l
p > 25 GeV ν
T,
p > 40 GeV
T m ATLAS | l η |
0 0.5 1 1.5 2 2.5
Theory/Data 0.951 1.05 | ll |y
0 0.5 1 1.5 2
| [pb]ll
/d|y σ d 20 40 60 80 100 120 140 160 Uncorr. uncertainty Total uncertainty 1.8%) ± luminosity excluded ( Data ABM12 CT14 HERAPDF2.0 JR14 MMHT2014 NNPDF3.0 -1
= 7 TeV, 4.6 fb s -l + l → * γ Z/
< 116 GeV
ll
66 < m > 20 GeV
T,l
p | < 2.5
l η | ATLAS | ll |y
0 0.5 1 1.5 2
Theory/Data
0.951 1.05
Figure 4: Left: Lepton charge asymmetry A in W → ν production as a function of the lepton
pseudorapidity|η|. Right: Differential cross-section for Z/γ → +− production in the Z-peak
region, 66< m < 116 GeV. Predictions at NNLO QCD with NLO EW corrections using various
PDF sets (open symbols) are compared to the data (full points). The ratio of theoretical predictions to the data is also shown. The predictions are displaced within each bin for better visibility. The theory uncertainty is the quadratic sum of the PDF uncertainty and the statistical uncertainty of the calculation [4].
and−distributions [4], but has large uncertainties. In the dilepton rapidity distribution ofZ decays
(see Figure 4, right), almost all predictions are below the observed cross section for|y|<1, and even
HERAPDF2.0 is systematically lower, though consistent in each individual rapidity bin due to its’ large uncertainty. This can be due to a mismodelling of the fraction of strange quarks in the sea, as suggested by the previous ATLAS observation [13] of an enlarged strangeness fraction in the light quark sea.
The data presented in this analysis are then introduced in the MMHT14 and CT14 PDFs by a procedure called “PDF profiling” (described in Ref. [4]), which provides a shifted set of parton dis-tributions with generally reduced uncertainties. In fact, taking these data into account in these PDFs
yields an increased strange fractionRs(x) =[s(x)+s¯(x)]/[¯u(x)+d¯(x)], towards unity, at the scale
Q2=1.9 GeV2; the smallest uncertainty onR
sis obtained for values of Bjorkenxaround 0.023.
A complete QCD fit analysis is then performed, as described in Ref. [4] and [13], and a brand new PDF set is derived from a combination of the HERA data and the ATLAS data which provide more sensitivity to the flavor composition of the quark sea as well as to the valence-quark distributions
at lower x. The new PDF set is termed ATLAS-epWZ16 and at Q2 = 1.9 GeV2 and x = 0.023
it yieldsRs = 1.13±0.05 (exp)±0.02 (mod)+−00..010006 (par); experimental (exp) and PDF-fit related
uncertainties are reported, where the latter results from the model (mod) and parameterization (par) uncertainties [4]. This result represents an improvement by a factor of three in the experimental uncertainty relative to the previous measurement from the ATLAS-epWZ12 set [13]. Thus, the new
PDF set indicates clearly an unsuppressed strangeness atx=0.023, where the current ATLASWand
Zcross section measurements have the largest constraining power. The enhanced strange contribution
constraint on the sum 4¯u+d¯+s¯from the precise measurement of the proton structure functionF2at
HERA.
In addition, this new PDF set allows the determination of the|Vcs|parameter, by allowing it to
vary freely while all other CKM matrix elements are fixed to the PDG values; it is measured to be
|Vcs|=0.969±0.013 (exp)+0.006
−0.003(mod)−+00..003027(par)+−00..011005(thy), where “thy” represents an additional
uncertainty due to the extra freedom given to the strange-quark distribution when releasing the
as-sumption thatxd¯(x) andxs¯(x) should be the same at lowx. In this fit, theRsvalue is also determined
and it is found consistent with that determined above, when the|Vcs|value was fixed assuming CKM
unitarity. The precision of this|Vcs|measurement is comparable to extractions from charm meson
decays (see references in Ref. [4]).
4
Z
production in association with jets
The measurement of the production of aZ boson in association with jets, “Z +jets”, constitutes a
powerful test of perturbative QCD. The large production cross section and easily identifiable decays of
theZboson to charged leptonic final states offer clean experimental signatures which can be precisely
measured. Such processes also constitute a non-negligible background for studies of the Higgs boson and in searches for new phenomena; typically in these studies, the multiplicity and kinematics of the
jets are exploited to achieve a separation of the signal of interest from the Standard ModelZ+jets
process, so the latter should be modelled well.
Measurements ofZ +jets production cross section in proton-proton collisions at √s =13 TeV
are presented here [5], using data corresponding to an integrated luminosity of 3.16 fb−1 collected
by ATLAS in 2015. Inclusive and differential cross sections are measured for events containing aZ
boson decaying to electrons or muons and produced in association with up to seven jets withpT>30
GeV and|y|<2.5.
Predictions from different Monte Carlo generators based on leading-order (LO) and
next-to-leading-order (NLO) matrix elements for up to two additional partons interfaced with parton shower and fixed-order predictions at next-to-leading order and next-to-next-to-leading order (NNLO) are compared with the measured cross sections. In Figure 5 (left) the jet multiplicity is shown, and it is
seen that the LO Alpgen+Pythia6 prediction (Z +≤6 jets) and the NLO predictions by Sherpa 2.2
and MG5_aMC+Pythia8 FxFx do not describe well the high jet multiplicity, where a non-negligible
fraction of the jets are from parton shower; instead, the LO generator MG5_aMC+Py8 CKKWL
de-scribes the jet multiplicity. The NLO QCD fixed-order calculations from BlackHat+Sherpa predict
only up to 4 jets.
On the right side of Figure 5, the leading-jet pT in inclusiveZ+ ≥1,2,3,4 jet events is shown.
The “Z+≥1 jet Njetti” NNLO perdition and the NLO predictions (BlackHat+Sherpa, Sherpa 2.2,and
MG5_aMC+Py8 FxFx) describe well the jetpT, whereas the LO MG5_aMC+Py8 CKKWL generator
predicts a too-hard jetpT spectrum at highpT, indicating that the dynamic factorization and
renor-malization scales,µFandµRrespectively, used in the generation are not appropriate for the full jetpT
range.
Other variables which are frequently used to separate either heavier SM particles or beyond-SM
physics from theZ +jets process, are also examined in this analysis: angular relations between the
two leading jets, dijet massses, as well as quantities based on inclusivepTsums of final-state objects,
such asHT(the scalarpTsum of all visible objects in the final state). It is observed that all predictions
describe well the mostly back-to-back configuration of the two leading jets, with the recentZ+≥1
constraint on the sum 4¯u+d¯+s¯from the precise measurement of the proton structure functionF2at
HERA.
In addition, this new PDF set allows the determination of the|Vcs|parameter, by allowing it to
vary freely while all other CKM matrix elements are fixed to the PDG values; it is measured to be
|Vcs|=0.969±0.013 (exp)+0.006
−0.003(mod)−+00..003027(par)+−00..011005(thy), where “thy” represents an additional
uncertainty due to the extra freedom given to the strange-quark distribution when releasing the
as-sumption thatxd¯(x) andxs¯(x) should be the same at lowx. In this fit, theRsvalue is also determined
and it is found consistent with that determined above, when the|Vcs|value was fixed assuming CKM
unitarity. The precision of this|Vcs|measurement is comparable to extractions from charm meson
decays (see references in Ref. [4]).
4
Z
production in association with jets
The measurement of the production of aZ boson in association with jets, “Z +jets”, constitutes a
powerful test of perturbative QCD. The large production cross section and easily identifiable decays of
theZboson to charged leptonic final states offer clean experimental signatures which can be precisely
measured. Such processes also constitute a non-negligible background for studies of the Higgs boson and in searches for new phenomena; typically in these studies, the multiplicity and kinematics of the
jets are exploited to achieve a separation of the signal of interest from the Standard ModelZ +jets
process, so the latter should be modelled well.
Measurements ofZ +jets production cross section in proton-proton collisions at √s =13 TeV
are presented here [5], using data corresponding to an integrated luminosity of 3.16 fb−1 collected
by ATLAS in 2015. Inclusive and differential cross sections are measured for events containing aZ
boson decaying to electrons or muons and produced in association with up to seven jets withpT>30
GeV and|y|<2.5.
Predictions from different Monte Carlo generators based on leading-order (LO) and
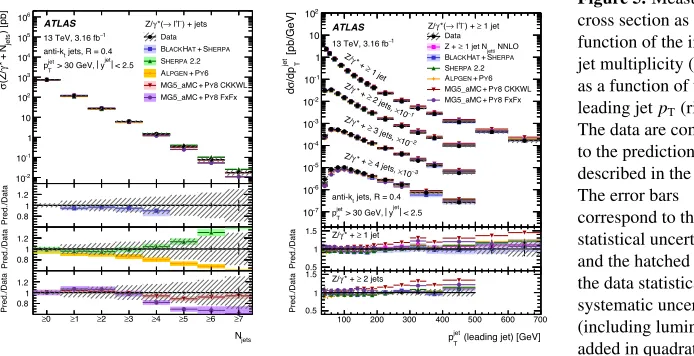
next-to-leading-order (NLO) matrix elements for up to two additional partons interfaced with parton shower and fixed-order predictions at next-to-leading order and next-to-next-to-leading order (NNLO) are compared with the measured cross sections. In Figure 5 (left) the jet multiplicity is shown, and it is
seen that the LO Alpgen+Pythia6 prediction (Z+≤6 jets) and the NLO predictions by Sherpa 2.2
and MG5_aMC+Pythia8 FxFx do not describe well the high jet multiplicity, where a non-negligible
fraction of the jets are from parton shower; instead, the LO generator MG5_aMC+Py8 CKKWL
de-scribes the jet multiplicity. The NLO QCD fixed-order calculations from BlackHat+Sherpa predict
only up to 4 jets.
On the right side of Figure 5, the leading-jet pT in inclusive Z+ ≥1,2,3,4 jet events is shown.
The “Z+≥1 jet Njetti” NNLO perdition and the NLO predictions (BlackHat+Sherpa, Sherpa 2.2,and
MG5_aMC+Py8 FxFx) describe well the jetpT, whereas the LO MG5_aMC+Py8 CKKWL generator
predicts a too-hard jetpT spectrum at highpT, indicating that the dynamic factorization and
renor-malization scales,µFandµRrespectively, used in the generation are not appropriate for the full jetpT
range.
Other variables which are frequently used to separate either heavier SM particles or beyond-SM
physics from theZ +jets process, are also examined in this analysis: angular relations between the
two leading jets, dijet massses, as well as quantities based on inclusivepTsums of final-state objects,
such asHT(the scalarpTsum of all visible objects in the final state). It is observed that all predictions
describe well the mostly back-to-back configuration of the two leading jets, with the recentZ+≥1
jet Njetti NNLO prediction describing best all the distributions examined [5].
jets
N
0
≥ ≥1 ≥2 ≥3 ≥4 ≥5 ≥6 ≥7
) [pb] jets N +* γ (Z/ σ -2 10 -1 10 1 10 2 10 3 10 4 10 5 10 6 10 ATLAS 1 − 13 TeV, 3.16 fb jets, R = 0.4
t anti-k < 2.5 jet y
> 30 GeV,
jet T
p
) + jets − l + l → *( γ Z/ Data HERPA S + AT H LACK B 2.2 HERPA S 6 Y P + LPGEN A 8 CKKWL Y P + MG5_aMC 8 FxFx Y P + MG5_aMC jets N 0
≥ ≥1 ≥2 ≥3 ≥4 ≥5 ≥6 ≥7
Pred./Data 0.8 1 1.2 jets N 0
≥ ≥1 ≥2 ≥3 ≥4 ≥5 ≥6 ≥7
Pred./Data 0.8 1 1.2 jets N 0
≥ ≥1 ≥2 ≥3 ≥4 ≥5 ≥6 ≥7
Pred./Data 0.8
1 1.2
(leading jet) [GeV]
jet T
p
100 200 300 400 500 600 700
[pb/GeV] jet T /dp σ d -7 10 -6 10 -5 10 -4 10 -3 10 -2 10 -1 10 1 10 2 10 ATLAS 1 − 13 TeV, 3.16 fb
1 jet ≥ ) + − l + l → *( γ Z/
jets, R = 0.4
t anti-k < 2.5 jet y
> 30 GeV,
jet T p 1 jet ≥ * + γ Z/ 1 − 10 × 2 jets, ≥ * + γ Z/ 2 − 10 × 3 jets, ≥ * + γ Z/ 3 − 10 × 4 jets, ≥ * + γ Z/ Data NNLO jetti
1 jet N ≥ Z + HERPA S + AT H LACK B 2.2 HERPA S 6 Y P + LPGEN A 8 CKKWL Y P + MG5_aMC 8 FxFx Y P + MG5_aMC
(leading jet) [GeV] jet T p 100 200 300 400 500 600 700 Pred./Data 0.5
1 1.5 Z/γ* + ≥ 1 jet
(leading jet) [GeV]
jet T
p
100 200 300 400 500 600 700
Pred./Data 0.5
1 1.5 Z/γ* + ≥ 2 jets
Figure 5.Measured cross section as a function of the inclusive jet multiplicity (left) and as a function of the leading jetpT(right). The data are compared to the predictions described in the text. The error bars correspond to the statistical uncertainty, and the hatched bands to the data statistical and systematic uncertainties (including luminosity) added in quadrature [5].
5
k
tsplitting scales in Z events
The jet activity inZevents is also studied in ATLAS at different “jet splitting scales”; 20.2 fb−1ofpp
collisions at 8 TeV are used in this analysis [6].
Thektjet-clustering algorithm starts from a list of particles in the event and at each iteration the
number of input objects drops by one (fromk+1 tok). At each iteration a jet splitting scaledk
is defined as follows [6]. For any two objectsi and j in the list, a “distance”di j is calculated as
di j = min(p2T,i,p2T,j)×DR2i j/R2, where the minimum of their squared pT values is weighted by the
square of theη−φseparationDRi jof the objects relative to a fixed jet-radiusR. For each individual
objectiin the list, the square of itspTis used as its “distance”dibto the beam axis. Having formed all
these distances, at each iterationk+1→kthe jet splitting scaledkis the minimum of all the
paired-or single- object distances fpaired-ormed; this can be either a two-body distancedi j, in which case the two
objectsiand jare combined, or it can be the distance of objectito the beam,dib, in which case the
object is removed from the list and it is called a completed jet. The “order” of the jet splitting scale
is the iteration stepk; e.g.,k=0 corresponds to the last iteration step (1→ 0) before the jet-finding
algorithm terminates, and so √d0is the pTof the leading jet in the event. TheNthjet splitting scale,
dN, is the distance measure at which anN-jet event can be resolved as an (N+1)-jet event.
Differential distributions as a function of the value of the various jet splitting scales are sensitive to
the “hard” perturbative modelling (at high values of the splitting scales), as well as to “soft” hadronic activity (at low values of the splitting scales), and they provide complementary input to standard jet
measurements. In this measurement [6] such differential cross sections are compared to the
theoreti-cal predictions from Sherpa with NLO multijet merging ("MEPS@NLO") and from Powheg+Pythia8
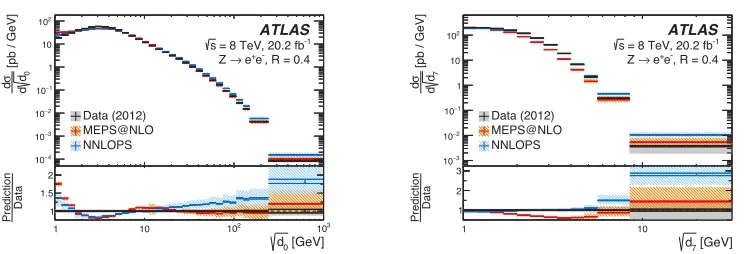
with NNLO matching ("NNLOPS"). On the left side of Figure 6 the differential cross section with
respect to √d0is given; both predictions overshoot significantly the data in the region around 1 GeV,
while both of them underestimate the cross section in the peak region (around 3 GeV) by about 10–20%; at 10 GeV they are both consistent with the data, but at higher values the NNLOPS pre-diction is systematically higher than the data. For higher order splitting scales (see the right side of
Figure 6 for√d7), the MEPS@NLO prediction agrees well with the data at the hard region, where the
NNLOPS prediction overestimates the cross section. It is also observed that the NNLOPS predictions
1 10 102 103
[pb / GeV] d0
d
σ
d
4
−
10 3
−
10 2
−
10 1
−
10 1 10 2 10
-1 , 20.2 fb = 8 TeV s
, R = 0.4 -e + e
→
Z
ATLAS
Data (2012) MEPS@NLO NNLOPS
[GeV]
0
d
1 10 102 103
Data
Prediction 1
1.5
2 1 10
[pb / GeV] d7
d
σ
d
3
−
10 2
−
10 1
−
10 1 10 2
10 -1
, 20.2 fb = 8 TeV s
, R = 0.4 -e + e
→
Z
ATLAS
Data (2012) MEPS@NLO NNLOPS
[GeV]
7
d
1 10
Data
Prediction 1
2 3
Figure 6: Charged-only distributions for two splitting scales (√d0on the left, and√d7 on the right)
in the electron channel using the jet-radius parameterR =0.4. The size of the error bars reflects the
statistical uncertainty, while the combined statistical and systematic uncertainty is indicated by the grey band. Theoretical predictions from Sherpa with NLO multijet merging ("MEPS@NLO") and
from Powheg+Pythia 8 with NNLO matching ("NNLOPS") are displayed including error bands for
the generator uncertainties [6].
low-order splitting scale √d0. Such comparisons indicate that the data can provide new input for the
tuning of the event generators.
6 Triple differential cross section for
Z
→
+−
production
This measurement [7] reports the triple-differential cross section for the Drell–Yan processZ/γ →
+−, whereis an electron or a muon. The measurement is performed for invariant masses of the
lepton pairs,m, between 46 and 200 GeV using a sample of 20.2 fb−1 of ppcollisions at 8 TeV
collected by ATLAS in 2012. The data are presented in bins of the dilepton invariant mass, absolute
dilepton rapidity,|y|, and the angular variable cosθbetween the outgoing lepton and the incoming
quark in the Collins–Soper frame. The measurements are performed in the range|y| <2.4 in the
muon channel, and extended to|y|<3.6 in the electron channel.
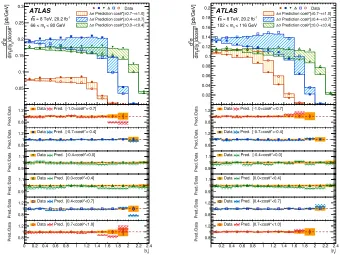
Figure 7 shows examples of plots representing the triple differential cross section
d3σ/dm
d|y|dcosθ. Each plot gives the differential cross section as a function of|y|, for six
bins in cosθand for a specificm
range. The combined cross sections are also integrated to produce
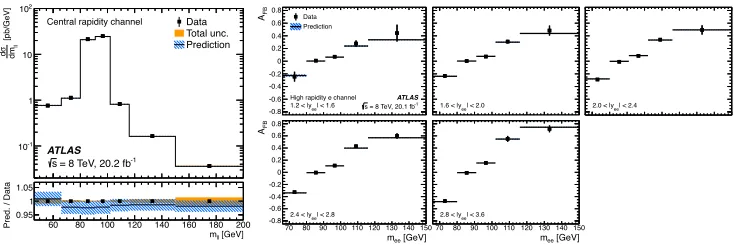
the single- and double-differential cross sectionsdσ/dm(see Figure 8, left) andd2σ/dmd|y|. The
fiducial cross sections are compared to a theoretical prediction calculated using Powheg at NLO with matched leading-logarithm parton showers. The calculation is approximately corrected for NNLO
QCD effects and for additional higher-order electroweak effects using a K-factor which is a function
of the dilepton mass. The single- and double-differential measurements are well described by the
pre-diction. Having applied corrections to the scattering amplitude coefficients in Powheg, the prediction
also provides a good description of the triple-differential measurements. Specifically in theZ pole
region, the measurements achieve a high precision (below the percent level excluding the uncertainty in the integrated luminosity) and are in agreement with predictions.
The triple differential cross section is also used to determine theZboson forward-backward
asym-metry,AFB, as a function of the dilepton mass and rapidity; it is evident from Figure 7 that the cross
section difference∆σat symmetric cosθbins around cosθ=0 flips sign when moving from below
1 10 102 103
[pb / GeV] d0
d σ d 4 − 10 3 − 10 2 − 10 1 − 10 1 10 2 10 -1 , 20.2 fb = 8 TeV s
, R = 0.4 -e + e → Z ATLAS Data (2012) MEPS@NLO NNLOPS [GeV] 0 d
1 10 102 103
Data
Prediction 1
1.5
2 1 10
[pb / GeV] d7
d σ d 3 − 10 2 − 10 1 − 10 1 10 2 10 -1
, 20.2 fb = 8 TeV s
, R = 0.4 -e + e → Z ATLAS Data (2012) MEPS@NLO NNLOPS [GeV] 7 d 1 10 Data Prediction 1 2 3
Figure 6: Charged-only distributions for two splitting scales (√d0 on the left, and√d7 on the right)
in the electron channel using the jet-radius parameterR=0.4. The size of the error bars reflects the
statistical uncertainty, while the combined statistical and systematic uncertainty is indicated by the grey band. Theoretical predictions from Sherpa with NLO multijet merging ("MEPS@NLO") and
from Powheg+Pythia 8 with NNLO matching ("NNLOPS") are displayed including error bands for
the generator uncertainties [6].
low-order splitting scale √d0. Such comparisons indicate that the data can provide new input for the
tuning of the event generators.
6 Triple differential cross section for
Z
→
+−
production
This measurement [7] reports the triple-differential cross section for the Drell–Yan processZ/γ →
+−, whereis an electron or a muon. The measurement is performed for invariant masses of the
lepton pairs,m, between 46 and 200 GeV using a sample of 20.2 fb−1 of ppcollisions at 8 TeV
collected by ATLAS in 2012. The data are presented in bins of the dilepton invariant mass, absolute
dilepton rapidity,|y|, and the angular variable cosθbetween the outgoing lepton and the incoming
quark in the Collins–Soper frame. The measurements are performed in the range|y| <2.4 in the
muon channel, and extended to|y|<3.6 in the electron channel.
Figure 7 shows examples of plots representing the triple differential cross section
d3σ/dm
d|y|dcosθ. Each plot gives the differential cross section as a function of |y|, for six
bins in cosθand for a specificm
range. The combined cross sections are also integrated to produce
the single- and double-differential cross sectionsdσ/dm(see Figure 8, left) andd2σ/dmd|y|. The
fiducial cross sections are compared to a theoretical prediction calculated using Powheg at NLO with matched leading-logarithm parton showers. The calculation is approximately corrected for NNLO
QCD effects and for additional higher-order electroweak effects using a K-factor which is a function
of the dilepton mass. The single- and double-differential measurements are well described by the
pre-diction. Having applied corrections to the scattering amplitude coefficients in Powheg, the prediction
also provides a good description of the triple-differential measurements. Specifically in theZ pole
region, the measurements achieve a high precision (below the percent level excluding the uncertainty in the integrated luminosity) and are in agreement with predictions.
The triple differential cross section is also used to determine theZboson forward-backward
asym-metry,AFB, as a function of the dilepton mass and rapidity; it is evident from Figure 7 that the cross
section difference∆σat symmetric cosθbins around cosθ=0 flips sign when moving from below
to above theZpole mass. AFBis defined as the difference over the sum of the cross sections between
[pb/GeV] *θ
|dcosll d|yll dm σ 3d 0.05 0.1 0.15 0.2 0.25 0.3 ATLAS
< 80 GeV
ll
66 < m
-1
= 8 TeV, 20.2 fb s Data 1.0] ± → 0.7 ± *[ θ Prediction cos σ ∆ 0.7] ± → 0.4 ± *[ θ Prediction cos σ ∆ 0.4] ± → 0.0 ± *[ θ Prediction cos σ ∆
0 0.2 0.4 0.6 0.8 1 1.2 1.4 1.6 1.8 2 2.2 2.4
Pred./Data 0.8
1
1.2 Data Pred. [-1.0<cosθ*<-0.7]
0 0.2 0.4 0.6 0.8 1 1.2 1.4 1.6 1.8 2 2.2 2.4
Pred./Data 0.8
1
1.2 Data Pred. [-0.7<cosθ*<-0.4]
0 0.2 0.4 0.6 0.8 1 1.2 1.4 1.6 1.8 2 2.2 2.4
Pred./Data 0.9
1
1.1 Data Pred. [-0.4<cosθ*<0.0]
Pred./Data 0.9
1
1.1 Data Pred. [0.0<cosθ*<0.4]
0 0.2 0.4 0.6 0.8 1 1.2 1.4 1.6 1.8 2 2.2 2.4
Pred./Data 0.8
1
1.2 Data Pred. [0.4<cosθ*<0.7]
0 0.2 0.4 0.6 0.8 1 1.2 1.4 1.6 1.8 2 2.2 2.4
Pred./Data 0.8
1
1.2 Data Pred. [0.7<cosθ*<1.0]
|
ll
|y 0 0.2 0.4 0.6 0.8 1 1.2 1.4 1.6 1.8 2 2.2 2.4
[pb/GeV] *θ
|dcosll d|yll dm σ 3d 0.02 0.04 0.06 0.08 0.1 0.12 0.14 0.16 0.18 0.2 ATLAS
< 116 GeV
ll
102 < m
-1
= 8 TeV, 20.2 fb s Data 1.0] ± → 0.7 ± *[ θ Prediction cos σ ∆ 0.7] ± → 0.4 ± *[ θ Prediction cos σ ∆ 0.4] ± → 0.0 ± *[ θ Prediction cos σ ∆
0 0.2 0.4 0.6 0.8 1 1.2 1.4 1.6 1.8 2 2.2 2.4
Pred./Data 0.8
1
1.2 Data Pred. [-1.0<cosθ*<-0.7]
0 0.2 0.4 0.6 0.8 1 1.2 1.4 1.6 1.8 2 2.2 2.4
Pred./Data 0.8
1
1.2 Data Pred. [-0.7<cosθ*<-0.4]
0 0.2 0.4 0.6 0.8 1 1.2 1.4 1.6 1.8 2 2.2 2.4
Pred./Data 0.9
1
1.1 Data Pred. [-0.4<cosθ*<0.0]
Pred./Data 0.9
1
1.1 Data Pred. [0.0<cosθ*<0.4]
0 0.2 0.4 0.6 0.8 1 1.2 1.4 1.6 1.8 2 2.2 2.4
Pred./Data 0.8
1
1.2 Data Pred. [0.4<cosθ*<0.7]
0 0.2 0.4 0.6 0.8 1 1.2 1.4 1.6 1.8 2 2.2 2.4
Pred./Data 0.8
1
1.2 Data Pred. [0.7<cosθ*<1.0]
|
ll
|y 0 0.2 0.4 0.6 0.8 1 1.2 1.4 1.6 1.8 2 2.2 2.4
Figure 7: Each plot shows the combined Born-level fiducial cross sections as a function of the dilepton
rapidity,|y|, for six cosθbins, and for a specific dilepton mass bin; the left plot is below theZpole,
at 66< m < 80 GeV, and the right plot is above, at 102 < m < 116 GeV. The data are shown
as solid (cosθ < 0) and open (cosθ > 0) markers and the prediction from Powheg including
NNLO QCD and NLO EW K-factors is shown as the solid line. The difference,∆σ, between the
predicted cross sections in the two measurement bins at equal|cosθ|symmetric around cosθ =0
is represented by the hatched shading. In each plot, the lower panel shows the ratio of prediction to
measurement in each cosθbin. The inner error bars represent the statistical uncertainty of the data
and the solid band shows the total experimental uncertainty. The contribution to the uncertainty from the luminosity measurement is excluded. The crosshatched band represents the statistical and PDF uncertainties in the prediction [7].
the full forward (cosθ > 0) and backward (cosθ < 0) regions. In Figure 8, right,A
FB is shown
forZ/γ → e+e−events in the forward rapidity region (1.2 <|y
|<3.6). The Powheg predictions
enhanced with NNLO QCD and NLO EW K-factors describe the observed behaviour ofAFBwell in
all rapidity regions, forming a solid base for a future measurement of the electroweak mixing angle.
7 Conclusions
A collection of recent ATLAS results involvingW andZbosons are presented: a precise
measure-ment of theW mass, matching the single best measurement to-date; inclusive W andZ production
measurements; properties of events with jets produced in association with aZ boson; and the triple
[GeV]
ll
m
[pb/GeV] ll
dm
σ
d
-1
10 1 10
2
10
Data Total unc. Prediction
ATLAS
-1
= 8 TeV, 20.2 fb s
Central rapidity channel
[GeV]
ll
m 60 80 100 120 140 160 180 200
Pred. / Data
0.95 1 1.05
FB
A
-0.8 -0.6 -0.4 -0.2 0 0.2 0.4 0.6
0.8 Data
Prediction
| < 1.6 ee
1.2 < |y s = 8 TeV, 20.1 fbATLAS-1 High rapidity e channel
| < 2.0 ee
1.6 < |y 2.0 < |yee| < 2.4
[GeV]
ee
m
70 80 90 100 110 120 130 140 150
FB
A
-0.8 -0.6 -0.4 -0.2 0 0.2 0.4 0.6 0.8
| < 2.8 ee 2.4 < |y
[GeV]
ee
m
70 80 90 100 110 120 130 140 150
| < 3.6 ee 2.8 < |y
Figure 8:Left:Integrated Born-level fiducial cross sectiondσ/dm.Right:Forward-backward
asym-metry,AFB, determined from the combined Born-level fiducial cross section ofZ/γ→e+e−
produc-tion in the forward rapidity region (the kinematic region is labeled in each plot). The data are shown as solid markers and the error bars represent the total experimental uncertainty. The prediction from Powheg including NNLO QCD and NLO EW K-factors is shown as the solid line and the hatched band represents the statistical and PDF uncertainties in the prediction [7].
which forms the base for a future measurement of the electroweak mixing angle. In all cases unprece-dented precision is obtained, not only in electroweak parameters, but also in testing perturbative QCD and placing strong constrains in PDFs.
References
[1] ATLAS Collaboration, JINST3(2008) S08003.
[2] ATLAS Collaboration,arXiv:1701.07240 [hep-ex], submitted for publication to Eur. Phys.
J.C(2017).
[3] CDF Collaboration, T. Affolder et al., Phys. Rev.D 64(2001) 052001,arXiv:hep-ex/0007044.
[4] ATLAS Collaboration, Eur. Phys. J.C 77(2017) 367,arXiv:1612.03016 [hep-ex].
[5] ATLAS Collaboration, Eur. Phys. J.C 77(2017) 361,arXiv:1702.05725 [hep-ex].
[6] The ATLAS collaboration, J. High Energ. Phys.08(2017) 026,arXiv:1704.01530 [hep-ex].
[7] ATLAS Collaboration,arXiv:1710.05167 [hep-ex], accepted for publication in J. High
En-erg. Phys. (2017)
[8] Particle Data Group, Chin. Phys.C, 40, 100001 (2016).
[9] M. Baaket al., Eur. Phys. J.C 74(2014) 3046,arXiv:1407.3792 [hep-ph].
[10] J. de Blaset al., J. High Energ. Phys.12(2016) 135.arXiv:1608.01509 [hep-ph].
[11] The ALEPH, DELPHI, L3, OPAL, SLD Collaborations, the LEP Electroweak Working
Group, the SLD Electroweak and Heavy Flavour Groups, Phys. Rept. 427 (2006) 257,
arXiv:hep-ex/0509008.
[12] CMS Collaboration, Phys. Rev. Lett.109(2012) 111806,arXiv:1206.2598 [hep-ex], and
Phys. Rev. D90(2014) 032004,arXiv:1312.6283 [hep-ex].