FLOOD MODELLING OF MANGALAM RIVER
USING GIS AND HEC-RAS
Sunilkumar P.
1, Vargheese K. O.
21M.TECH Scholar,2 Proffessor,
Department of Civil Engineering, Government Engineering College Thrissur, (India)
ABSTRACT
The occurrence of high intensity rainfall for some continuous days results in flooding in most parts of Kerala..
The area under study is the Mangalam River Basin, experiences intense flash floods during heavy rainfall. The
various changes preferably responsible for the floods are identified as release of water from Mangalam dam
during monsoon season, encroachment of banks of river, improper planning and construction of hydraulic
structures, change in land use.In this study the Flood hydrograph of the catchment was developed using time
distribution coefficient method Hydrologic Engineering Centre's Hydrologic Modelling System (HEC-HMS).
The flood inundated area was modelled in Hydrologic Engineering Centre's River Analysis System (HEC-RAS)
software and inundation maps were developed in GIS.
Keywords: Flood, GIS, HEC-HMS, HEC-RAS
I. INTRODUCTION
Flood is an unusual high stage of a river overflowing its bank and inundating the marginal lands .This is due to
severe storm of unusual meteorological combination sometimes combined with melting of snow on the
catchment. This may also due to shifting of the course of the river, earth quake causing bank erosion, or
blocking of river, or breaching of the river flood banks. Flooding is one of the serious natural hazards in the
world. The damages caused by flooding include loss of life and property, displacement of people, disruption of
socio-economic activities and loss of valuable agricultural lands
Floods have swept vast regions in India, particularly in the regions of rivers Kosi, Brahmaputra, Godavari,
Narmada and Tapti. Floods cause much loss of life and property, disruption of communication, damage to crops,
famine, epidemic diseases and other indirect losses.
Design flood magnitude of floods are needed for the design of spillways, reservoirs, bridges openings, drainage
of cities and air ports, and construction of flood walls and levees (flood banks). The damages due to the
devastating floods can be minimised by various flood control measures.
Flood forecast information in a graphical format (flood inundation map) enables emergency managers and
disaster relief officials, to better prepare for potential flood conditions. So it is important to provide easy to read
graphical information related to flood hazard to the public, city planners and emergency managers. Flood
inundation mapping is the process of defining the area covered by water, a map during a flood event. It can be
done by integrating Geographic information system with hydrologic and hydraulic models[1].
1.1 Flood Inundation Mapping
Cook A. and Merwade V., (2009) has conducted a study to address the effect of cross section configuration
using HEC RAS in one dimensional models by comparing newly developed flood inundation maps from
LIDAR data to maps that were developed using different topography, geometric description and modelling
approach[2].
Papakos T. P. And Root K., (2010) has conducted a comprehensive hydrologic and hydraulic modelling of Sana’a basin, the capital of Yemen to support the flood hazard analysis that quantifies the extent and the depth
of the flooding throughout the flood prone areas for a range of flood frequency events. The hydraulic analysis
was performed to create water surface profiles and develop flood plains for extreme events within the city of Sana’a. HEC RAS was used to model the hydraulic response of the stream network to frequency flows. The
HEC Geo RAS tool was used to expedite parameter input and mapping processes[3].
Sudha Y. (2012) has done a hybrid approach of integrating HEC RAS and GIS towards the identification and
assessment of flood risk vulnerability in the city of Jackson, MS. This GIS based approach allows visualizing
and quantifying the results in a spatial format. Flood risk assessed by simulating higher magnitude flood events
using this approach magnifies the vulnerability of the region and reinforces that any land use planning decisions
in floodplains should make informed choices by incorporating derived information in their decision making
process[4].
Galoie et. al. (2014) has done a study to evaluate the influence of an existing retention dam on flood control in
Schoeckelbach basin in Austria. In this research flood inundation areas were investigated using HEC RAS and in order to model the outflow hydrograph of the dam, the modified Pul’s method was used[5].
Khan Mujiburrehman (2015) conducted a study on the 'Preparation of Flood Inundation Map in Ganga River at
Farakka Bridge, Malda, and West Bengal, India'. In this study, the flood inundation maps for maximum monthly
flood magnitude were prepared using the HEC-RAS and Google earth online tool. For this study, 21 years of
flow data was analysed to find the best fit distribution. Log Pearson type III was used to obtain the flood values
for different return periods. Analysis showed that the bridge area is prone to flooding and also found that the
area left of the river is more susceptible to flooding than the area on the right side of the river. Flood inundation
maps were also prepared corresponding to the flood values. The study concluded by suggesting the construction
of floodwalls along the floodplains in order to reduce the effect of flood[6].
Mandviwala et al.,(2015) conducted a study, 'Flood Vulnerable Mapping In Lower Tapi River Basin, Gujarat,
India Using Remote Sensing and GIS'. This area being the downstream of the Ukai Dam is subjected to frequent
floods during the rainy season and the authors selected this region for their study. The major factors that were
considered in this study include the average annual rainfall, soil map, land use map, micro watershed size,
drainage density etc. All these thematic maps were then rasterised in ArcGIS and ranking sum method was used
to evaluate the flood vulnerable areas[7].
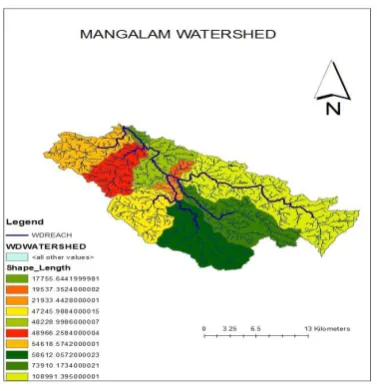
II. STUDY AREA
Mangalam River is taken as the study area. Mangalam river is around 30 km long in length, with its source
from Nelliyampathi forests, and passing through Vadakkencherry, Kannambra, Puthucode, Padur, etc. and
The Mangalam watershed lies between 100 40'39.55 N to 100 30'51.16 N latitudes and 760 33'2.97”E to 760 20'52.06” E longitudes. It is spread over the district of Palakkad of Kerala State. The Mangalam River
Basin is bounded by Chittoor Taluk of Palakkad district in the North, Thalappilly Taluk of Thrissur
districts in the South, Tamil Nadu in the East and Ottappalam taluk in the West. Every year Mangalam
river faces problems of floods and damages during monsoon.These problems are due to the release of water
from Mangalam dam located in the upstream of the river. To facilitate the appropriate measures for effective
flood mitigation, there is a need to model the flood plain. Flood plain modelling using HEC RAS is an effective
tool for hydraulic study
Figure 1. Study area
III. METHODOLOGY
The current chapter describes the various methodologies and the theoretical background that are required for the
analysis within this study. They include estimation of peak flood discharge, flood analysis using HEC RAS, and
the flood inundation mapping using GIS.
3.1 Estimation of Flood
Mangalam dam is located at the upstream of the river, which is classified as intermediate dam as per IS
11223-1985 and hence uses Standard Project Flood as design flood. It is the flood that may be expected from the most
severe combination of hydrological and meteorological factors that are considered reasonably characteristic of
the region and is computed by using the Standard Project Flood .
Conversion of Standard Project Storm(SPS) value into Hourly rainfall
Point rainfall in to Areal rain fall –Apply areal distribution factor-24 hour rainfall
Apply clock hour correction
Apply conversion ratio -12 hour rainfall
Apply time distribution coefficients
Find cumulative rainfall of each hours
Generate flood hydrograph Ordinates using SCS Curve method by HEC-HMS Software.
-HMS computes runoff volume by computing the volume of water that is intercepted, stored, evaporated or
transpired and substracting it from precipitation .Interception and storage are intended to represent the surface
storage of water by trees or grass, local depressions in the ground surface, cracks and crevices in parking lots or
roofs, or a surface area where water is not free to move as overland flow. Infiltration represents the movement of
water to areas beneath the land surface. Interception, infiltration, storage, evaporation and transpiration
collectively referred as losses in HEC HMS.
program considers that all land and water in a watershed can be categorized as either : Directly connected
impervious surface or pervious surface. Directly connected impervious surface in a watershed is that portion of
the watershed for which all contributing precipitation runs off, with no infiltration, evaporation, or other volume
losses. Precipitation on the pervious surfaces is subject to losses.
3.2 Hydraulic Analysis
HEC-RAS and its extension HEC-GeoRAS is used to prepare the flood inundation map of the Mangalam river
River. HEC-RAS is used to compute water surface elevations from either a specified flow rate (steady flow
simulation) or from a discharge hydrograph (unsteady flow simulation). It requires two basic inputs for flow
analyses: geometric data and flow data. The geometric data file includes all the information related to
cross-sectional station and elevation data, reach lengths, bank stations, energy-loss coefficients, stream junctions, and
the geometry of hydraulic structures. The flow data requires defining boundary conditions, initial conditions
(unsteady), and either peak discharges or discharge hydrographs depending on the simulation type (steady or
unsteady, respectively).
The pre processing of the geometric data (to extract the physical characteristics of the study region) and the
post-processing of the outputs (to visualize the flooding impact) that are required by the HEC-RAS model
processes are done using HEC Geo RAS. This interface (as an extension in Arc GIS) allows the preparation of
geometric data import into HEC-RAS and processes simulation results exported from HEC-RAS in a geospatial
environment. To create the geometric file, the DEM is converted to a TIN (Triangulated Irregular Network)
format.[8]
3.3. Flood Inundation Mapping
Flood Inundation Mapping is an important tool for engineers, planners, and government agencies used for
municipal and urban growth planning, emergency action plans, flood insurance rates and ecological studies. By
understanding the extent of flooding and floodwater inundation, decision makers are able to make choices about
how to best allocate resources to prepare for emergencies and to generally improve the quality of life.
HEC-RAS and its extension HEC-GeoRAS was used to prepare the flood inundation map of the Mangalam
River. HEC-GeoRAS uses the functions associated with Spatial Analyst and 3D Analyst extensions of ArcGIS.
The only dataset required in this mapping is the terrain data (TIN or DEM). The RAS Geometry menu contains
functions for pre-processing of GIS data for input to HEC-RAS. The RAS Mapping menu contains functions for
Figure.2 HEC-GeoRAS toolbar used in ArcGIS
3.4. Pre-processing Of Data
The TIN file of the watershed was loaded in ArcMAP 10.1. The next step is to do the preprocessing of the data.
For this we have to create the geometry file using HEC-GeoRAS, click on RAS Geometry ->Create RAS layers.
Selected attributes were Stream centreline, Banklines, Flowpath Centrelines, XS Cutlines in the study. A
geodatabase was created by HEC-GeoRAS in the same folder where the arcmap document was saved. The river
centre line was then used to establish the river network for the HEC-RAS. The river centreline was created using
start editing attribute in the editor toolbar in arcmap. The river feature was selected in the create features
window and line for the construction tools. The river was digitised starting from the upper reach till the outlet.
The lower reach was started digitising where there came a change in the elevation of contour. After the
digitisation process the document was completed, the reaces were then named as the upper reach and lower
reach using the feature Assign River Code/ Reach code.The figure shows the DEM of the study area, with the
river digitised. The black line denotes the upper reach and the red line denotes the lower reach of the river in Fig
4.5 Similarly using the editing option, River Banks, Flowpaths were also digitised. The next step is the creation
of cross-sections as they are the main input to HEC-RAS. It is used to extract the elevation data so as to create
the ground profile across the channel. Cross sections were digitised by slecting the XS cutlines and selecting
line segment in the create feature window .Cutlines were digitised by drawing line perpendicular to the
streamflow, spanning over the entire flood extent and digitised from left to right [9].
The final step before exporting the GIS data to HEC-RAS is to assign the Manning's n values. The single manning’s value “n” used in this study was n = 0.05. This value was assigned by clicking on RAS Geometry ->
Manning's n Values -> Extract N values. Constant value was assigned to each cross section using Table Of
Manning Values.
In the next step the GIS data was imported, by clicking on RAS Geometry -> Export RASData, as shown in Fig
4.8. During exporting, series of messages were displayed. After completion of export, the window was closed.
By exporting data, two files were created GIS2RAS.xml and GIS2RAS.RASImport.sdf. The pre-processing
3.5. Model Execution
HEC-RAS was launched and the new project was saved in the name Mangalam.prj in the D folder. GIS data was
imported into HEC-RAS by clicking on Edit -> Geometric Data.
In the geometric data editor, select File -> Import Geometry Data -> GIS Format. GIS2RAS.RASImport. sdf file
which was created in GIS was selected and OK was clicked. Confirmation was made while importing the river
reach, bank lines, cross section lines. Finally Finished Import Data was clicked to import the Data to HEC-RAS
.Flows were defined at the upstream location and the flow to be simulated is known as profile. Unsteady flow
analysis was performed in this study. To perform the analysis, click on Edit -> Unsteady flow data in HEC-RAS
main window. Downstream Boundary conditions were also defined by clicking Reach boundary Conditions.
Downstream was selected, normal depth was entered as 0.001. The file was saved with the name v2. Finally the
Unsteady flow analysis was done in HEC-RAS, by clicking Run -> Unsteady Flow Analysis in the main
window. The execution was performed.The simulated data was exported to ArcGIS, by clicking on File ->
Export GIS Data in the main HEC-RAS window. Clicking on Export Data button, an sdf file was created. The
project was saved and exited.
3.6. Post processing of data
In ArcGIS, clicking on Import RAS to SDF file button, the sdf file can be converted to xml file. In the coming
window , Mangalamriver.RASexport.sdf was browsed and OK was clicked.The process is complete when a
dialogue box appears stating the conversion is done.The layer setup for floodplain mapping was done by
selecting RAS Mapping -> Layer Setup. In the layer setup, New Analysis option was selected and named as
Steady flow. Single terrain type was selected and browsed to tin. Working folder D:/ was browsed for output
directory. OK was clicked. .In the next step, Click on RAS Mapping -> Import RAS Data. During Importing of
the data, a series of execution messages will be seen. After execution of this a bounding polygon is developed
which defines the analysis extent for inundation mapping, obtained by connecting the end points of XS cut lines.
After defining the analysis extent, the inundation extent can be mapped. Here the inundation extent was mapped
with maximum water surface. Click on RAS Mapping -> Inundation Mapping -> Water Surface Generation.
Select max WS and click OK. Then Click on RAS Mapping-> Inundation Mapping -> Floodplain Delineation
using Raters. Select max WS (profile with highest flow), and click OK. A series of execution messages will be
shown and the flood inundation extent is displayed .
VI. MATERIALS AND SOFTWARES
The following materials and software's were used to do the study of my project.
4.1 Materials used
Rainfall details from Mangalam Dam
SOI toposheet
ASTER DEM 30m resolution from USGS
Stage and discharge data of Mangalam river.
4.2 Software's used
The various software's are:
ArcGIS 10.1 version
Arc SWAT
HCE-HMS
HEC-RAS 5.0.1 and HEC-GeoRAS
Microsoft Excel
V. RESULTS AND DISCUSSIONS
5.1 Development of flood hydrograph
The steps described in the methodology was followed and the following results were obtained.
Catchment area of Mangalam dam 47.60 Km2
SPS Value 51.6 cm
Areal distribution coeff 0.9762 (To convert point rain fall into areal rain fall)
1 day areal rainfall 50.37 cm
Add Clock hour correction 50 mm
24 HRS rain fall 55.37 cm
Convertion ratio : 78 %
12 HRS rain fall 43.19 cm
[10]
Hrs Time distribution coeffients Cumulative Rainfall in cms Incremental rainfall
0 0 0 0
1 0.24 10.37 10.37
2 0.39 16.84 6.48
3 0.51 22.03 5.18
4 0.62 26.78 4.75
5 0.7 30.23 3.46
6 0.77 33.26 3.02
7 0.82 35.42 2.16
9 0.91 39.30 1.73
10 0.95 41.03 1.73
11 0.98 42.33 1.30
12 100 43.19 0.86
[11]
Figure.3 Time series table[12]
0 5 10 15 20 25 30 0 20 40 60 80
MANGALAM Plan: MANGALAM2 4/27/2017
Main Channel Distance (km)
E le v a ti o n ( m ) Legend
WS Max WS Ground
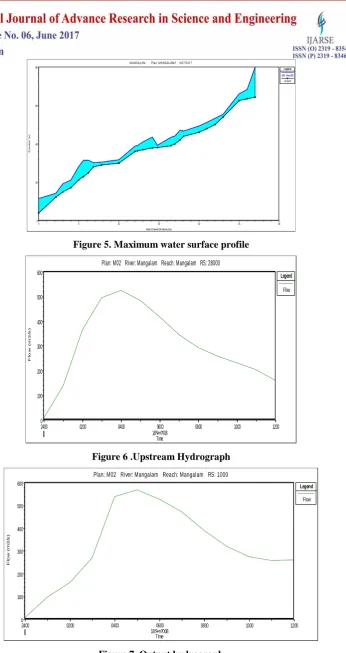
Figure 5. Maximum water surface profile
2400 0200 0400 0600 0800 1000 1200
18Sep2008 0 100 200 300 400 500 600
Plan: M02 River: Mangalam Reach: Mangalam RS: 28000
Time F lo w ( m 3 /s ) Legend Flow
Figure 6 .Upstream Hydrograph
2400 0200 0400 0600 0800 1000 1200
18Sep2008 0 100 200 300 400 500 600
Plan: M02 River: Mangalam Reach: Mangalam RS: 1000
Time F lo w ( m 3 /s ) Legend Flow
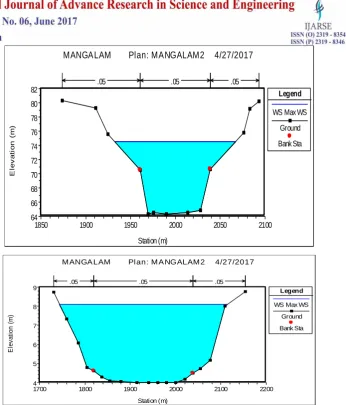
1850 1900 1950 2000 2050 2100 64 66 68 70 72 74 76 78 80 82
MANGALAM Plan: MANGALAM2 4/27/2017
Station (m) E le v a ti o n ( m ) Legend
WS Max WS
Ground
Bank Sta
.05 .05 .05
1700 1800 1900 2000 2100 2200
4 5 6 7 8 9
M ANGA LAM Pl an: M A NGALAM 2 4/27/2017
Station (m) E le v a ti o n ( m ) Legend
WS Max WS
Ground
Bank Sta
.05 .05 .05
Figure 8. Upstream and downstream sections
VI. SUMMARY AND CONCLUSIONS
The flood inundation map was prepared in ArcGIS by modeling the unsteady flow analysis in HEC-RAS and
then exporting the result back in GIS using the extension HEC-GeoRAS. Combination of the above results can
aid in the flood mitigation plans, especially because the study area is often experiencing flash floods. The
Probable Maximum Flood occurring in the study area was also found out using the Time distribution coefficient
method. The above obtained values can be of great use in the review of hydrology of dam located at the
upstream reach , designing of new hydraulic structures in the study area and planning proper mitigation
strategy.
One of the objective of the present study was to estimate the probable maximum flood occurring in the study
area. The highest value of discharge observed with in the basin was 524.1 m3 /s. Estimation of this value helps
in the designing work of a civil structure in the study area,The flood hydrograph was developed, which was
further utilized in the flood plain mapping in HEC-RAS. By doing this analysis it was possible to get an idea
about how much flood can occur in the study area.
Another objective was to create the flood inundation map in a GIS platform.Floodplain was also obtained by
maximum both at the upstream reach and the lower reach of the Mangalam river compared to the midland
region. This is in concurrence with the flood inundation map prepared in the GIS.
Since, no historical flood map was available, the model results were validated using the crossection data taken
from the field. Hence, Arc-GIS along with HEC-RAS and its GIS extension HEC-GeoRAS can aid in the
development of flood inundation maps. Flood mitigation measures were incorporated with the analysis which
gives a significant reduction in the flood inundation area of the river.
The results in the study can serve as an information guide for various activities like flood mitigation etc.
The spatial resolution of the DEM in the study area was not adequate, because of which the tributaries of the
river could not be considered in developing the flood inundation map.Study can be extended upto the sea where
the entire effect of flood will be neutralized..
REFERENCES
[1]. Water Resources of Kerala , (Kerala, Irrigation department ,1974) .
[2]. Cook A. And Merwade V., Effect of topgraphic data, geometric configuration and modelling approach on
flood inundation mapping,Journal of Hydrology , 377.pp. 131-142,2009,
[3]. Papakos T. H.and Root K., Hydraulic modelling of flash floods in Sana’a , World Environmental and water
resources Congress, pp.1524-1533,2010.
[4]. Sudha Y., A hybrid approach of integrating HEC RAS and GIS towards the identification and assessment of
flood risk vulnerability in the city of Jackson,MS, American journal of Geographic information system,
1(1), pp.7-16, 2012.
[5]. Galoie M., Eslamian S. and Motamedi A., An investigation of the influence of a retention dam on flood
control in a small catchment area in Austria, Journal of flood engineering, Vol. 5(1-2).pp. 1-15, 2014.
[6]. Khan Mujiburrehman , Preparation of Flood Inundation Map in Ganga River at Farakka Bridge, Malda,
West Bengal, India, International Journal of Research in Geography (IJRG),Vol.1, Issue 1, , pp. 1-7, June
2015
[7]. D Mandviwala, GS Joshi, Indra Prakash, Flood Vulnerable Mapping In Lower Tapi River Basin, Gujarat,
India Using Remote Sensing and GIS, International Journal of Advance Engineering and Research
Developemnt, Vol 2, Issue 7, July-2015
[8]. HEC-RAS user’s manual, 2016.
[9]. HEC-GeoRAS user’s manual, 2009.
[10]. CWC-PMP Atlas for west flowing rivers of Western Ghats, Final report Volume 1, Main report(2015)
[11]. CWC Flood estimation report for west coast region,Konkan and Malabar coasts sub zones 5a and 5b (1992).