Western University Western University
Scholarship@Western
Scholarship@Western
Electronic Thesis and Dissertation Repository
11-21-2014 12:00 AM
Exploring Relationships Between Resume Fraud and Individual
Exploring Relationships Between Resume Fraud and Individual
Differences
Differences
Kateryna Synyak
The University of Western Ontario
Supervisor Joan Finegan
The University of Western Ontario Graduate Program in Psychology
A thesis submitted in partial fulfillment of the requirements for the degree in Master of Science © Kateryna Synyak 2014
Follow this and additional works at: https://ir.lib.uwo.ca/etd
Part of the Social and Behavioral Sciences Commons
Recommended Citation Recommended Citation
Synyak, Kateryna, "Exploring Relationships Between Resume Fraud and Individual Differences" (2014). Electronic Thesis and Dissertation Repository. 2546.
Exploring Relationships Between Resume Fraud and Individual Differences
By
Kateryna Synyak
Graduate Program in Industrial/Organizational Psychology
A thesis submitted in partial fulfillment
of the requirements for the degree
Master of Science
The School of Graduate and Postdoctoral Studies
The University of Western Ontario
Abstract
Existing research on resume fraud highlights the commonality and consequences of resume
misrepresentations, yet almost no research exists aiming to explain the occurrence of this
intentional behaviour. The goal of this study was to explore the relationships between personality
traits previously linked to deception (conscientiousness and honesty/humility), resume
misrepresentations and acceptance of these misrepresentations. An online survey method of data
collection was used during which participants constructed a resume and filled out various
measures pertaining to individual difference and resume misrepresentation. The results of this
study provide an initial understanding of the existing categories of resume misrepresentations
and the extent to which participants misrepresent. Findings indicate interconnected relationships
between acceptability of resume misrepresentations, actual resume misrepresentations,
conscientiousness and honesty/humility. Potential implications of findings and study limitations
Acknowledgements
I would like to express my appreciation and thanks to Dr. Joan Finegan, who was not
only a wonderful supervisor but also an encouraging mentor during my time at Western
University. Dr. Finegan’s ongoing guidance and support from beginning to the very end of this
project made this thesis possible. I appreciate all of Dr. Finegan’s patience and encouragement as
we spent what feels like countless hours putting together and editing each part of this thesis. I am
very grateful that I was given a chance to choose a topic I am sincerely interested in. Since
resume misrepresentations have not yet been extensively researched, I learned a lot not only
about the topic itself but also about the research process in general.
I would also like to thank the members of my thesis advisory committee: Dr. Natalie
Allen, Dr. Joshua Bourdage, Dr. Richard Goffin and Dr. Lyn Purdy. I am grateful that you
shared your honest views and opinions relating to this project. Your feedback and advice has
helped me improve my work and achieve this goal. In addition, I would like to thank Dr. Robert
Gardner for sharing his statistical expertise with me and assisting me in choosing the best
methods to analyze and report my data.
A special thank you to my mom, whose love, wisdom and courage has always inspired
me to never give up and always stay positive while working towards my goals. Words cannot
express how lucky and grateful I am to have you as a mother and friend. Thank you to my
brother for all your help and support, no matter how busy you are you always make time to be
there for me. And finally, thank you to all my friends for incenting me to work towards my goals
Table of Contents
Abstract ... ii.
Acknoledgements ... iii.
Table of Contents ... iv.
List of Tables ... v.
List of Appendices ... vi.
Introduction ... 1.
Misrepresentations in Applicant Selection ... 3.
Conceptualizing Misrepresentation ... 6.
Acceptability of Misrepresentation ... 9.
Individual Differeces and Faking... 10.
Honesty/Humility ... 10.
Conscientiousness ... 11.
Methods... 12.
Participants ... 12.
Procedure ... 12.
Measures ... 14.
Personality Assessment ... 14.
Conscientiousness ... 14.
Honesty/Humility ... 14.
Careless Responding ... 15.
Job Desirability ... 15.
Resume Accuracy Measure... 15.
Acceptability of Resume Misrepresentations ... 16.
Analytical Techniques ... 16.
Assumption Testing and Principal Componanets Analysis ... 16.
Correlational Analysis ... 17.
Post-hoc and Reliability Analysis ... 17.
Results ... 18.
Principal Components Analysis ... 18.
Principal Components, Item Loadings and Factor Labels ... 19.
Acceptability of Misrepresentation Variables ... 21.
Occurence of Misrepresentations ... 21.
Acceptability of Misrepresentations ... 22.
Correlational Analysis ... 22.
Post-hoc Analyses ... 24.
Discussion ... 26.
Fabrications, Omissions and Accuracy ... 26.
Occurrence of Misrepresentations ... 27.
Acceptability of Misrepresentations ... 28.
Correlations Between Acceptance and Misrepresentations ... 28.
Personality... 28.
Implications... 29.
List of Tables
Table 1: Factor loadings for Principal Component Analysis with Oblique direct oblimin rotation ……….of Resume Accuracy measure ... 19.
Table 2: Items which comprise the scales of Acceptance of Misrepresentation ... 21.
Table 3: Means and standard deviations of factors of misrepresentation and cmposite scores of ……….acceptance of misrepresentations ... 22.
List of Appendices
Appendix A: Letter of Information ... 39.
Appendix B: HEXACO-PI 60 Item Scale ... 40.
Appendix C: Study Job Advertisement... 43.
Appendix D: Resume Accuracy Measure ... 44.
Appendix E: Acceptability of Misrepresentations Measure ... 45.
Appendix F: Debriefing Letter... 47.
Appendix G:Post-hoc Analyses ... 49.
Individual Differences and Resume Misrepresentations
Industrial and organizational psychology explains and predicts human behaviour in the
context of the workplace. Personnel selection is one of the major areas of this science. The goal
of researchers in this area is often to predict the future success of an applicant. Making
judgements about the potential performance of an applicant based only on the information
provided on a resume and then comparing this individual to all other applicants is a difficult task.
A greater challenge is introduced once deceptive behaviour is brought into the equation.
Although many studies have been directed at predicting and detecting faking of bio-data and
personality tests when selecting employees, almost no academic research studies have
specifically addressed the issue of resume fraud to date (an exception to this: Guillory &
Hancock, 2012). Yet, resume misrepresentation appears to be common (Koeppel, 2006). Media
investigations and background checks by human-resource departments have found evidence to
suggest that many resumes contain misrepresentations. In 2004, Reuters’ News Agency reported
that half of applications contained resume misrepresentations. In April 2006, a New York Times
article reported that recruiters found that generally about half of applications contained
inaccurate information (Koeppel, 2006). In 2007, ADP Screening and Selection Services
reported that 41% of applications included misrepresented information (Levashina & Campion,
2006). Another study found that a staggering 90% of individuals admitted to lying on a
resume-like scholarship application (George, Marrett & Tilley, 2004).
Resume fraud is viewed as a serious issue by organizations (Babcock, 2003; Tuna &
Winstein, 2008). A study done by Haefner (2007) revealed that 43% of organizations reported an
employee would be immediately dismissed if any type of resume fraud was detected, no matter
organization and the applicant (Wood, Schmidtke, & Decker, 2007). Choosing an applicant who
was untruthful on his or her resume could result in the company overlooking other applicants
who were honest and potentially more qualified for the position (Engleman & Kleiner, 1998). If
the deception is detected after an untruthful applicant has been hired, terminating the current
unqualified employee, recruiting new applicants, then hiring and training them would entail
considerable time and costs for the organization (Grover, 1993; Engleman & Kleiner, 1998).
Conducting audits make it possible for organizations to verify information provided on
applications. Even though background and reference checks are possible, misrepresentations may
still occur (Burke, 2005). The little research that has been done on the topic has mostly been
conducted by practitioners within organizations and mostly focusing on either the number of
occurrences reported or the consequences of misrepresenting (Babcock, 2003). More research
needs to be directed at understanding and explaining the faking behaviour (Griffith & Peterson,
2011).
The most relevant research relating to resume misrepresentations in I/O Psychology
relates to applicant faking, which is defined by McFarland and Ryan (2000) as “intentional
distortion on the part of the applicants” as an attempt to increase the chances of attaining a job
position (p. 812). One of the issues pointed out by Griffith and Peterson is that researchers have
failed to generate theory-based research which would be practical to organizations.
Organizations would benefit from understanding “how” and “why” applicants misrepresent
information, as opposed to knowing more about the consequences of it. Griffith and Peterson
also state that to have a better understanding of why people fake it is essential to consider
study is to explore the relation between dispositional factors and tendency to intentionally
provide inaccurate information on resumes.
I was interested in exploring why some individuals still choose to misrepresent
information on their resume even though they are aware that it may be verified. To be more
specific, I was interested in categorizing the types of intentional resume misrepresentations and
investigating their relationship with individual differences. In particular I examined whether
one’s conscientiousness or honesty was related to the degree to which individuals exaggerated,
invented or omitted information on their resume. In this online study, participants were asked to
create a resume for a specific job posting, and then were questioned about whether or not they
had intentionally misrepresented information. Respondents were also asked about how
acceptable they thought it was to misrepresent themselves on their resume.
Misrepresentations in Applicant Selection
Applicants may misrepresent themselves in a variety of ways throughout the selection
process. Some may misrepresent themselves because of a misunderstanding whereas others
might intentionally misrepresent themselves. According to McFarland and Ryan (2000),
individuals who intentionally distort application information such as biodata, integrity tests,
personality tests and information, are able to do so because they understand what is expected and
manipulate information to create the desired impression. A study conducted by Anderson,
Warner and Spencer (1984) asked participants to rate the extent of their training and experience
with real and fake job-related tasks. The real tasks were derived from a job analysis and the fake
tasks were made up by the researchers to superficially resemble job-related tasks. The results of
were not real, indicating that applicants deceitfully misrepresented information on their
application. Results of studies focusing on applicant deception during interviews indicate that in
general interviewers trust that applicants are honest when answering questions (Reinhard,
Scharmach & Muller, 2013). Unfortunately, research has also shown that many interviewees
misrepresent information when answering questions during an interview (Barrick & Mount,
1996; McFarland & Ryan, 2000; Reinhard et al., 2013).
According to diary studies, people admit to lying on average one to two times a day –
showing that lying is common (DePaulo, Kashy, Kirkendol, Wyer & Epstein, 1996). Deception
is a goal-directed act (Mitchell & Daniels, 2002) used to manipulate a target into believing
something untrue, usually for the purpose of attaining some sort of reward (Kim, 2006).
Applicants may be motivated to misrepresent information when there is a discrepancy between
an ideal applicant (described in the job advertisement) and their current state, and this
discrepancy could prevent them from receiving the desired reward – the job (Leary & Kowalski,
1990). Furthermore, motivation to lie is stronger when people feel the need to present themselves
positively (Jones & Pittman, 1982) as a way of impressing the evaluator (Kuhn, Johnson &
Miller, 2013). According to DePaulo et al. (1996) the three main reasons which led individuals to
lie are the desire to conform to other people’s opinion of themselves, to attain some type of
benefit or reward and to self-promote in an attempt to impress a particular audience. All these
reasons could explain why someone would choose to misrepresent information on their resume,
whether they are attempting to look as best as possible in the eyes of the evaluator or trying to
fill the gap between their own qualifications and the required qualifications (Grover, 1993).
providing an inflated self-report of themselves and misrepresenting unintentionally, whereas
impression management refers to individuals who are consciously distorting the information they
provide in order to create a desired impression (Griffith & Peterson, 2011; Hays & Dunnings,
1997; Paulhus, 1998). The focus of this study is on conscious deception, meaning that the
deception was used with intent and on purpose.
DePaulo (1992) concluded that generally people are capable of, and are good at, faking
behaviours during applicant screening. Impression management is defined as an individual’s
attempt to portray him or herself in a positive light in front of someone else (Leary & Kowalski,
1990). When applicants appropriately use impression management as a tactic during an
interview, their chances of attaining the job are increased (Levashina & Campion, 2006).
Although most often applicants will base their claims on the truth, both truth and lies can be
effective at impressing the hiring manager assuming he or she believes the information is true
(Leary & Kowalski, 1990). For this reason, impression management is of significant concern to
both personnel-selection researchers and practitioners (Burns & Christiansen, 2006; Paulhus,
2003). Furthermore, some researchers directly refer to deceptive impression management as
faking, and define it as “intentional distortion of responses on selection measures in order to
create an overly positive impression that deviates from one’s true standing on a trait” (Komar,
Brown, Komar & Robie, 2008, p. 141). Therefore, while some applicants may use impression
management to simply highlight their best side, others may maliciously do so to gain an unfair
advantage over other applicants (Griffith & Peterson, 2011).
Since lying is a socially undesirable action, one potential concern for this study is
whether people will admit to deception. In a study conducted by Weiss and Feldman (2006),
to fill out an application, and then to answer interview questions relating to their traits and
qualifications for the position. The participants were then debriefed and told that they were
actually participating in a research study. They were then asked to fill out the same application
form again and answer questions about their honesty during the interview. The results of this
study indicated that participants told an average of 1.75 lies in 10 minutes. The authors of this
study suggested that this occurred because participants felt pressure to appear competent and
some felt the need to be liked by the interviewer; these familiar pressures are likely to be
experienced by a job applicant when writing a resume or undergoing an interview. In a study by
Donovan, Dwight and Hurtz (2003) participants were directly asked to admit if they have been
dishonest in their last job interview. When asked whether participants engaged in deceptive tasks
during the selection process, 30% of participants admitted to applicant faking. However, when
participants were asked more specific questions relating to misrepresentation, 50% admitted to
exaggerating their own positive qualities (i.e. stating that they were more reliable or punctual
than they were in reality) and about 60% of participants admitted to deemphasizing their
negative qualities, such as a lack of interpersonal skills or not being conscientious. To increase
the willingness of participants to admit to faking behaviours, this study used a
randomized-response technique which assured the protection of anonymity among respondents. These results
suggest that if participants are given anonymity, are aware that no actual job exists and knows
there are no consequences for misrepresenting, then they are less likely to conceal their
misrepresentations from the researcher.
Conceptualizing Misrepresentation
common misrepresentations on a resume are educational credentials and employment dates
(Burke, 2005; Haefner, 2007; Winstein, 2008). Therefore, it is evident that different ways of
misrepresenting information on a resume exist, but it is currently unclear how to categorize them.
Guillory and Hancock (2012) conducted a study to assess if there is a difference in the
amount of resume misrepresentations on traditional offline resumes, private Linkedin resumes
and public Linkedin resumes. They hypothesized that online resumes would contain the least
amount of deception since they are most accessible to public verification. To do this, they
classified the type of information on a resume into four categories: responsibility, abilities,
involvement and interests. They found that although there were no differences in the amount of
deception used, there were differences in the type of information that was most likely to be
misrepresented, depending on the medium used. For example, there were fewer
misrepresentations about previous work experience and responsibilities on the resumes posted on
Linkedin in comparison to traditional resumes, whereas information pertaining to interests and
hobbies was more likely to be misrepresented on resumes posted on Linkedin. These findings
reveal the importance of categorizing the different types of information when focusing on
resume misrepresentations.
To assess resume misrepresentations it was necessary to first conceptualize the different
types of misrepresentations possible (Kaplan & Fisher, 2009). Currently, except for the
understanding that resume fraud entails misrepresenting information on a resume, no clear
typology of the different types of misrepresentation exists. One should keep in mind that that for
misrepresentation to occur, it is not necessary for false information to be delivered (Hopper and
Bell, 1984). In other words, omitting relevant information may also create a factual distortion. In
misrepresentations: “omissive” in the case that information is withheld from the target and
“active” in the case false information is given. The active misrepresentations can be either in the
form of a lie or an exaggeration (Buller & Burgoon, 1994; Lee, 2004). Active and omissive acts
may be used simultaneously or separately for deception to occur (Griffith & Peterson, 2011).
In 2007, Levashina and Campion constructed and validated a measure which assessed the
extent to which participants admitted to misrepresenting information in a job interview. The aim
of their study was to explore the deceptive methods used during the screening process. The study
used a similar paradigm as Weiss and Feldman’s (2006) study in which participants thought that
they were being interviewed for a real position and then afterwards were asked about the degree
to which they had misrepresented themselves. Weiss and Feldman argued that interviewees may
use slight image creation, extensive image creation, image protection and ingratiation when
misrepresenting information. Slight image creation pertains to responses based on factual
information, whereas extensive image creation pertains to information that is fictional. The
results indicated that although over 90% of participants admitted to being deceptive during the
application process, 85% misrepresented “slightly”, while 65% admitted to using extensive
image creation at some point during the interview. In my study, in light of conclusions reached
by Levashina and Campion, slight resume misrepresentations were assessed by items of
exaggeration and extensive resume misrepresentations were assessed by items of invention.
Based on the findings mentioned above, this study focused on three types of
misrepresentations: exaggerations, inventions and omissions. Furthermore, since it is possible
that applicants distort resume information in other ways, aside from exaggerations, inventions
In my study, respondents were provided with a template of resume categories that are
commonly used in constructing resumes (e.g., Education, work experience) and asked to provide
the information they would include for each section if they were applying for a job. These
sections are also closely related to the way Guillory and Hancock categorized information for
their study. Respondents then rated the degree to which they exaggerated, invented or omitted
material in each section
Hypothesis 1. Responses to the questions about three different types of misrepresentation should
factor into three components representing exaggerations, inventions and omissions.
Acceptability of Misrepresentations
Based on social norms, individuals rate lying as generally unacceptable and hold negative
attitudes towards lying (McLeod & Genereux, 2008). However, individuals rate some types of
lies as more acceptable than others (McLeod & Genereux, 2008). Furthermore, individuals who
find lying acceptable are more likely to lie themselves (Hopper & Bell 1984). An individual’s
perspective on the acceptability of deception will impact their decision to misrepresent when
presented with an opportunity to deceive. If an applicant has the intention to misrepresent and
feels it is acceptable to do so, then he or she is more likely to misrepresent, especially if they
think the information will be assumed to be true. In this way, acceptability of deception in
specific situations seems to be central to the decision of whether or not an applicant will choose
to misrepresent (Hopper & Bell 1984).
Hypothesis 2. There will be a significant positive relationship between misrepresentations
(exaggerations, inventions and omissions) and the degree to which respondents believe it is
Individual Differences and Faking
Research suggests that there are individual differences in the likelihood that applicants
would misrepresent information (McFarland and Ryan, 2000). As outlined below, there is
evidence to suggest that the personality traits of conscientiousness and honesty/humility are
related to resume misrepresentation.
Honesty/Humility.
The Five Factor Model argues that there are five basic dimensions of personality:
extraversion, conscientiousness, neuroticism, openness to experience and agreeableness (Costa &
McCrae, 1985; Goldberg, 1990). Recently, Ashton et al. (2004) have argued that
honesty/humility should be added to the list. Honesty/humility refers to the extent an individual
manipulates others for personal gain, feels temptation to break rules or feels entitled to social
status. It predicts risk-taking behaviour and is negatively correlated with personality constructs
such as entitlement, exploitation (Lee & Ashton, 2005) and Machiavellianism (Christie & Geis,
1970). Honesty/Humility has been found to be negatively correlated with counterproductive
work behaviour (Lee & Ashton 2005; Lee, Ashton & Shin, 2005). One would expect that honest
individuals are less likely to be deceptive and misrepresent information. A study conducted by
McLeod and Genereux (2008) assessed personality differences and how they related to different
types of lies. The researchers found that those who were less honest participated in more
deceptive behaviours, no matter the type. Acceptability of lying behaviours has been shown to
be closely related to how much individuals value honesty and in general how honest they are
themselves (Lippard, 1988). Furthermore, those who value honesty were not only less likely to
Hypothesis 3. Honesty/humility will be negatively related to the degree to which responses are
exaggerated, invented or omitted.
Hypothesis 4. Honesty humility will be negatively related to the degree to which exaggerations,
inventions and omissions are thought to be acceptable
Conscientiousness.
An individual who is conscientious would be described as someone who is thorough,
reliable, organized, cautious and attentive (Costa & McCrae, 1985). Conscientiousness has been
shown to be the best single predictor of work performance and is therefore considered an
important trait that employers should look for in applicants (Schmidt & Hunter, 1998).
Individuals who are conscientious are less likely to lie than those who are low on
conscientiousness, especially if the lies are more self-serving (Kashy & DePaulo, 1996), such as
in a situation where one would misrepresent information on their resume. In 2000, McFarland
and Ryan published a study which examined the relationship between dispositional
characteristics and three different types of personnel assessments (biodata, personality measure,
integrity measure). They found that conscientiousness was consistently and significantly
negatively related to the amount of misrepresentation.
Hypothesis 5. Conscientiousness will be negatively related to the degree to which responses are
exaggerated, invented or omitted.
Hypothesis 6. Conscientiousness will be negatively related to the degree to which exaggerations,
Methods
Participants
Initially, 236 individuals took part in this online study. Thirty-six participants were
removed from the study due to excessive missing data or careless responding. For the purpose of
data analysis, 200 participants remained, 48% of whom were female. Although the study was
open to participants residing in United States and Canada, all participants who successfully
completed the study were residents of United States. The age of participants ranged from 18 to
68, average age being 31.7 (SD = 9.85) years old. All participants have had some type of
post-secondary education, and 29 participants indicated that they were currently enrolled as a student
at a college or university. In regards to employment, 73% of the sample were employed, 15.5%
were self-employed, and 7.5% were not employed. (Of this later group nine listed themselves as
homemakers, two as retired and 4 were unable to work)
Procedure
Individuals from Canada and the US were invited to participate in an online study using
Amazon Mechanical Turk (MTurk). This website allows for participants who have an account
with Amazon.com to complete “HITS”, known as Human Intelligence Tasks, in exchange for
monetary compensation. To minimize careless responding, only participants who had completed
at least 100 HITS and who had achieved an approval rate of 90% or more on previously
completed MTurk tasks were able to see the posting advertising this study. Interested individuals
Interested individuals were then given details about the study and informed that their
completion of this online survey implied their voluntary consent to participate (see the informed
consent form in Appendix A)
Participants first completed the HEXACO measure (see Appendix B), and then were
presented with a job advertisement for a Research Analyst (see Appendix C). They were asked to
construct a resume for this job but were assured that this was not a real advertisement and there
was no job.
Participants were asked to think of the job description and then to complete a job resume.
To do this, they were presented with five categories typically found on resumes and asked to
populate each with their own information. The job advertisement was displayed on every page in
case the participant needed to refer to it. The five sections, in order, were: Education, Work
Experience, Training and Development, License and Certificates, and About Yourself.
Once participants filled in the five sections, they were presented with all the information
they had provided in previous sections and were given the opportunity to make changes. They
were informed that this would be their last opportunity to change the constructed resume.
In the next part of the survey, participants were asked to rate the information they
provided in each section of the resume in terms of the degree to which they had exaggerated,
invented or omitted material. They were also asked to rate the information they provided in
terms of accuracy. (An example of the questions can be found in Appendix D.) Each section was
shown in order and filled out separately.
The participants were then presented with questions regarding how acceptable it was to
At the completion of the study, participants were directed to a debriefing letter (see
Appendix F). Participants were compensated monetarily by the researcher through the MTurk
money transfer system. Participants were compensated $3.00 for successful completion after data
was screened by the researcher to check for careless responding or missing data. All data entered
was treated as anonymous and confidential. Responses collected are stored online and on the
Western University network database, both protected by a secure password.
Measures
Personality assessment.
Personality was measured using the HEXACO Personality Inventory (Lee & Ashton,
2004). Participants were asked whether they agree or disagree with 60 statements using a scale
from 1“Strongly disagree” to 5 “Strongly agree”. The scale is presented in Appendix B. Though
respondents completed the entire scale, only the conscientiousness and honesty/humility scales
were used in this study
Conscientiousness. Ten items were used to assess conscientiousness. A sample item is:
“I plan ahead and organize things, to avoid scrambling at the last minute”. The reliability of this
scale is typically .76 and was .81 in this study. This measure has been found to correlate with
other conscientiousness scales, such as the NEO-FFI (Lee & Ashton, 2009).
Honesty/Humility. Ten items were used to assess honesty/humility. A sample item is:
“If I knew that I could never get caught, I would be willing to steal a million dollars”. The
Careless responding.
Also included with this scale were items to check for careless responding. Amidst the
HEXACO-PI were three control items which instructed respondents to “select the neutral
option”, “select the strongly agree option” and “select the disagree option”, respectively. Out of
the total 36 respondents removed from analysis, 14 of them were removed because they selected
a different option for one or more of these items, whereas the rest of the participants were
removed because they did not complete all the scales.
Job desirability.
After being shown the job advertisement, respondents were asked to respond to three
items that measured how desirable they found the job. The items are “I find this job very
desirable”, “I would apply for this job if I were on the job market” and “I would very much like
to get this job”. All items were rated on a 7-point scale with higher scores indicating greater
desirability.
Resume Accuracy Measure.
Each of the five resume sections (education, work experience, training and development,
license and certificates and about you) contained three misrepresentation items which asked the
participant about the degree to which they exaggerated, invented or omitted information in that
section. Specifically they were asked: Did you exaggerate any information you provided; did
you omit any information; or did you invent any information. Each item was answered on a
7-point scale ranging from 1 “Not at all” to 7 “To a great extent”. In addition, respondents also
rated their perception of the overall accuracy of each section of the resume using the same scale
Respondents were given the opportunity to elaborate on where they misrepresented and
to explain why they did it. Specifically they were told, “If you provided
any inaccurate information on your resume, could you provide specific examples and explain
why you chose to do so?”. This data was not analyzed and instead kept for purposes of extended
research.
Acceptability of resume misrepresentations.
For every type of misrepresentation (exaggeration, invention, omission), respondents
were asked to indicate how acceptable that behaviour was on a scale from 1 “totally
unacceptable” to 7 “perfectly acceptable”. Respondents did this for each resume section and for
the overall resume. So in total 18 items (three items for each of the five sections of the resume
and three for the overall resume) assessed how acceptable respondents thought it was to
misrepresent information on resumes.
Analytical Techniques
Assumption testing and Principal Component Analysis.
A Principal Components Analysis (PCA) was used to determine the categorization of
resume misrepresentations. Since PCA relies on a correlation matrix of the variables involved, it
requires a substantial sample size for the correlations to stabilize. According to Comrey and Lee
(1992) a sample of 200 participants is considered “fair”, whereas a 100 participants would be
poor and 300 participants would be good. To avoid computational difficulties and to ensure an
adequate sample size, they also suggest having at least 10 observations per variable. In the case
PCA was used as a method of data reduction. PCA is a variable reduction technique
which is used when variables are highly correlated and reduces the number of variables to a
smaller number of components that account for majority of the variance of the observed
variables. (To deal with missing data, missing variables were replaced with mean scores using
SPSS.)
Correlational analysis.
To assess the direction and strength of the relationship between two variables, Pearson
product-moment correlation was used.
Post-hoc and reliability analyses.
Independent t-tests were conducted to assess whether gender (male or female) or being a
student (student versus non-student) influenced results. To see whether age affected results, I
looked at correlations between age and components and items of misrepresentation. To assess
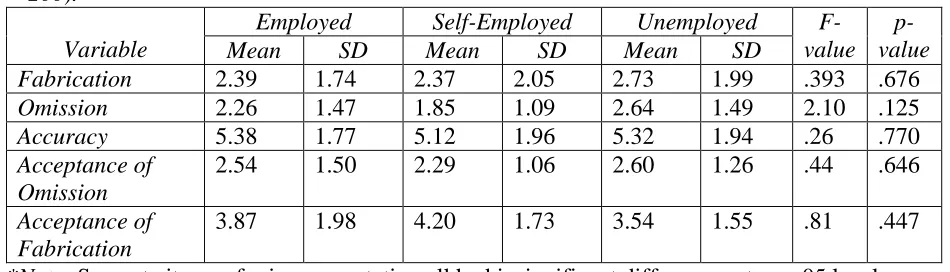
whether employment status impacted on results, I grouped responses into three groups
(employed, self-employed and unemployed/unpaid) and conducted an analysis of variance to
determine if statistically significant differences were evident between employment status and
misrepresentations. The variable means were then assessed using a t-test to analyze any
significant differences. Cronbach’s alpha was analyzed to assess the internal consistency among
personality scales and composite variables of misrepresentations and acceptance of
Results
Principal Components Analysis
The Kaiser-Meyer-Olkin (KMO) measure of sampling adequacy was .895 indicating the
data were sufficient for PCA, well above the minimum value of .6. To test the null hypothesis
that the correlation matrix can be used as an identity matrix for the analysis, Bartlett’s test of
sphericity was examined. The Bartlett’s test of sphericity was significant 2 (190) = 4591.250, p
= 0.00, indicating that there were patterned relationships between the items. Both of these tests
together suggest that it was appropriate to analyze the data using PCA.
The communalities of the misrepresentation variables are all above .6 (except for
omission and accuracy in “about you” section, which were above .5) confirming that each item
shares common variance with other items As an indicator of the amount of variance explained
by each component, an eigenvalue cut-off of 1 was first used. The initial eigenvalues showed
that the first factor explained 55% of the variance, the second factor 12% of the variance, a third
factor 7% of the variance, and a fourth factor 5% of the variance. The fourth factor was dropped
from the analysis for a number of reasons. It accounted for a trivial amount of variance and did
not emerge as a strong factor based on the analysis of the scree plot. Moreover, only the item of
“Accuracy in the About You section” loaded on the fourth factor.
The date was reanalyzed forcing a three-factor solution. The three-factor solution
Table 1
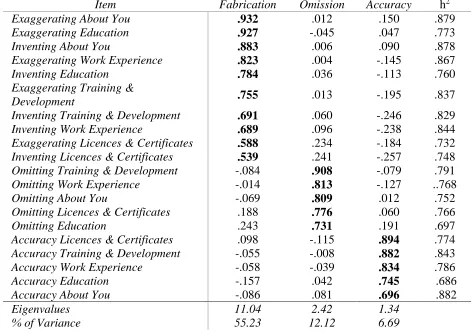
Factor loadings for Principal Component Analysis with Oblique direct oblimin rotation of Resume Accuracy measure (N = 200).
Item Fabrication Omission Accuracy h2
Exaggerating About You .932 .012 .150 .879
Exaggerating Education .927 -.045 .047 .773
Inventing About You .883 .006 .090 .878
Exaggerating Work Experience .823 .004 -.145 .867
Inventing Education .784 .036 -.113 .760
Exaggerating Training &
Development .755 .013 -.195 .837
Inventing Training & Development .691 .060 -.246 .829
Inventing Work Experience .689 .096 -.238 .844
Exaggerating Licences & Certificates .588 .234 -.184 .732
Inventing Licences & Certificates .539
-.084
.241
.908
-.257 .748
Omitting Training & Development -.079 .791
Omitting Work Experience -.014 .813 -.127 ..768
Omitting About You -.069 .809 .012 .752
Omitting Licences & Certificates .188 .776 .060 .766
Omitting Education .243 .731
-.115
.191
.894
.697
Accuracy Licences & Certificates .098 .774
Accuracy Training & Development -.055 -.008 .882 .843
Accuracy Work Experience -.058 -.039 .834 .786
Accuracy Education Accuracy About You
-.157 -.086 .042 .081 .745 .696 .686 .882
Eigenvalues 11.04 2.42 1.34
% of Variance 55.23 12.12 6.69
Note: Oblique direct oblimin rotation, item loadings above .5 are in boldface. h2 refers to item communality.
Principal components, item loadings and factor labels
Table 1 also shows the factor loadings after rotation. All variables were kept because
none of the variables loaded highly onto more than one factor and all variables loaded onto one
of the three factors. The 20 variables comprised a total of 3 components. An examination of the
items suggests that these components can be labelled ‘Fabrications”, “Omissions” and
“Accuracy” respectively. The Fabrications component was comprised of 10 items and included
training and development, licences and certificates, and about you). The second component,
labelled Omissions, was comprised of five items. These items were the omission item for each
of the five sections. Finally the five items that comprised the accuracy component included the
accuracy item from each of the five sections.
Looking at Table 1 we can see the correlations between the variable and the component
and can analyze how each item loads onto each component to confirm the data reduction
decision. Communalities, which explain the proportion of each variable’s variance that can be
explained by the principal components, are also included in the table.
I had hypothesized that there would be three categories of misrepresentations:
exaggerations, inventions and omissions. PCA indicated that there were only two categories of
misrepresentations: fabrications (exaggerations and inventions grouped together) and omissions.
Thus, only two scales were created, one representing fabrications, and the other omissions.
Composite scores were created for each of the three factors, based on the mean of the items
which had their primary loadings on each factor. Internal consistency for each of the scales was
assessed using Cronbach’s alpha. The alphas were high: .96 for Fabrications (10 items), .89 for
Acceptability of misrepresentation variables
Given the PCA suggested that exaggerations and inventions were one factor (called
fabrications) and omissions another, I created two acceptance scales corresponding to these two
factors. The items which make up these scales can be seen in Table 2.
Table 2
Items which comprise the scales of Acceptance of Misrepresentation
Acceptance of Fabrication Scale Items
Acceptance of Omission Scale Items
1. Exaggerating in the Education Section 2. Inventing in the Education Section 3. Exaggerating in the Work Experience
Section
4. Inventing in the Work Experience Section 5. Exaggerating in the Training and
Development Section
6. Inventing in the Training and Development Section
7. Exaggerating in the Licenses and Certificates Section
8. Inventing in the Licenses and Certificates Section
9. Exaggerating in the About You Section 10. Inventing in the About You Section
1. Omitting in the Education Section
2. Omitting in the Work Experience Section 3. Omitting in the Training and Development
Section
4. Omitting in the Licenses and Certificates Section
5. Omitting in the About You Section
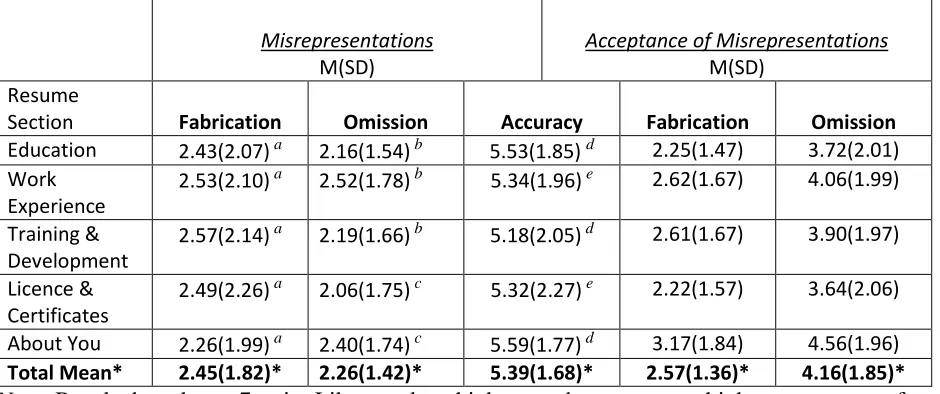
Occurrence of misrepresentations
To see whether people were more accurate in some sections rather than others, a repeated
measures analysis of variance was done on the five resume categories and showed a main effect
for section, as shown in Table 3. Paired t-tests indicated no significant differences between
highest and lowest reported fabrications and omissions. Overall accuracy was highest in About
Table 3
Means and standard deviations of factors of misrepresentation and composite scores of acceptance of misrepresentations (N = 200).
Misrepresentations
M(SD)
Acceptance of Misrepresentations
M(SD) Resume
Section Fabrication Omission Accuracy Fabrication Omission
Education 2.43(2.07) a 2.16(1.54) b 5.53(1.85) d 2.25(1.47) 3.72(2.01)
Work Experience
2.53(2.10) a 2.52(1.78) b 5.34(1.96) e 2.62(1.67) 4.06(1.99)
Training & Development
2.57(2.14) a 2.19(1.66) b 5.18(2.05) d 2.61(1.67) 3.90(1.97)
Licence & Certificates
2.49(2.26) a 2.06(1.75) c 5.32(2.27) e 2.22(1.57) 3.64(2.06)
About You 2.26(1.99) a 2.40(1.74) c 5.59(1.77) d 3.17(1.84) 4.56(1.96)
Total Mean* 2.45(1.82)* 2.26(1.42)* 5.39(1.68)* 2.57(1.36)* 4.16(1.85)*
Note: Results based on a 7-point Likert scale, a higher number represents higher occurrence of Fabrication and Omission, as well as higher Accuracy. In terms of acceptability, the higher the number the greater the acceptance of misrepresentation.
*All misrepresentation and acceptability of misrepresentation component total means differ significantly at p < .05 level. Subscriptions are used to indicate which section means are significantly different.
Acceptability of misrepresentations
Tables 3 also shows the acceptability of misrepresentation means categorized by factors
of fabrication and omission. Paired t-test analysis showed a significant difference between
acceptance of fabrications (M=2.57, SD=1.36) and acceptance of omissions (M=4.16, SD=1.85),
t(198)=11.84, p= .00. However, there were no significant differences between sections of
acceptance of misrepresentations.
Correlations analysis
fabrications and acceptability of fabrications was found to be statistically significant, r = .39, p <
.001. The correlation between omissions and acceptability of omissions was also found to be
statistically significant, r = .24, p < .001.
To examine the role of personality in resume misrepresentation, correlations were
computed among the conscientiousness and honesty/humility scales, the three Misrepresentation
scales (fabrications, omissions, accuracy) and the two composite acceptability of
misrepresentation (acceptability of fabrication, acceptability of omission) scales. The results of
this analysis can be found in Table 4.
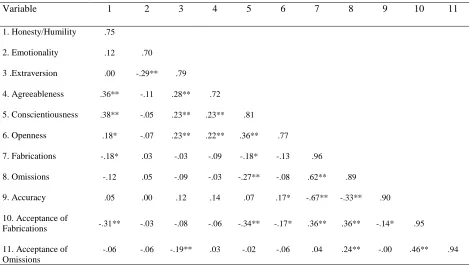
Honesty/humility was significantly negatively correlated with fabrications r = -.180, p =
.01, but not significantly correlated with omissions r = -.121, or accuracy r = .052.
Honesty/humility was significantly negatively correlated with acceptance of fabrications r =
-.313, p < .001, but not acceptance of omissions r = -.055.
Conscientiousness was negatively correlated with fabrications r = -.177, p = .01, and
omissions r = -.272, p < .001, but it did not correlate significantly with accuracy r = .066.
Conscientiousness was negatively correlated with acceptance of fabrications r = -.340, p < .001,
Table 4
Correlations among HEXACO and Misrepresentation/Acceptance of Misrepresentation variables
Variable 1 2 3 4 5 6 7 8 9 10 11
1. Honesty/Humility .75
2. Emotionality .12 .70
3 .Extraversion .00 -.29** .79
4. Agreeableness .36** -.11 .28** .72
5. Conscientiousness .38** -.05 .23** .23** .81
6. Openness .18* -.07 .23** .22** .36** .77
7. Fabrications -.18* .03 -.03 -.09 -.18* -.13 .96
8. Omissions -.12 .05 -.09 -.03 -.27** -.08 .62** .89
9. Accuracy .05 .00 .12 .14 .07 .17* -.67** -.33** .90
10. Acceptance of
Fabrications -.31** -.03 -.08 -.06 -.34** -.17* .36** .36** -.14* .95
11. Acceptance of Omissions
-.06 -.06 -.19** .03 -.02 -.06 .04 .24** -.00 .46** .94
Note: *p < .05, **p < .01. Scale reliability indicated in diagonal, (N=200).
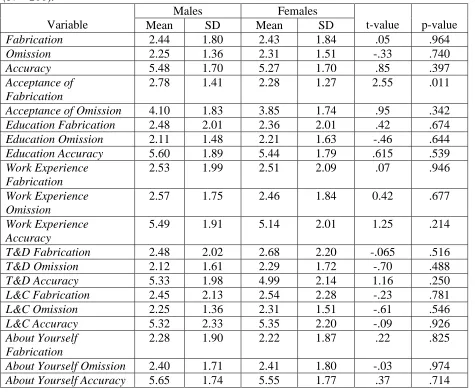
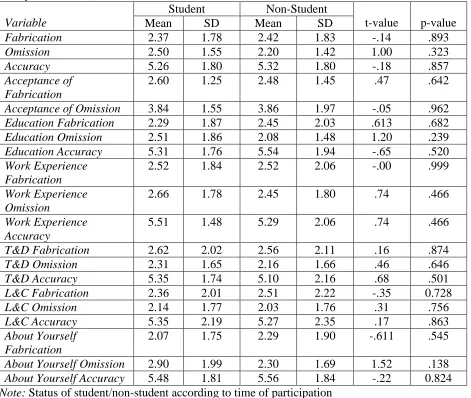
Post-hoc analyses
hoc tests were conducted on the data and results are presented in Appendix G.
Post-hoc tests revealed that responses to any of the measures did not differ as a result of gender and
student-status (student/non student at time of participation) differences in the data. The only
significant difference was found when looking at gender differences in how acceptable it was to
fabricate, indicating that men, found it more acceptable (M=2.78, SD= 1.41) to fabricate than
women 2.28, SD= 2.55), t(198)=2.55, p= .011. However, given the number of comparisons
finding one comparison significant is not surprising and thus gender was not included as a factor
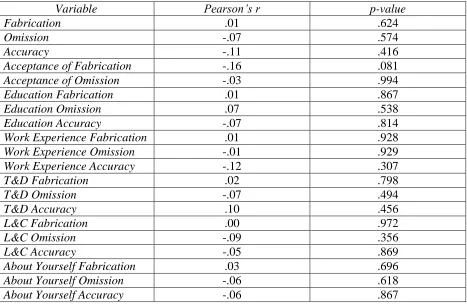
components of misrepresentation and acceptance of misrepresentation. A correlational analysis
indicated no significant correlations between age and any of the components or items of
misrepresentation, suggesting that age did not play a role in influencing the extent to which
participants misrepresented. Furthermore, job desirability did not significantly correlate with any
analyzed variables, except for acceptance of fabrication, r= -.16, p=.022. Since this correlation is
the only significant one out of many, as well as very small, job desirability is therefore
considered to not play a role in influencing the data results. Participants provided an overall job
desirability rating average of 5.38 (SD=1.82) on a 7-point scale with higher scores indicating
greater desirability. The item “I would apply for this job if I were on the job market” was rated
an average of 5.15 (SD=2.16) and “I would very much like to get this job” was given an average
rating of 5.16 (SD=2.05). Overall, these ratings indicate that generally participants had an
Discussion
Knowing the potential negative consequences of detected resume fraud, I was interested
in exploring factors that contribute to individuals engaging in resume misrepresentations. More
specifically, the goal of this study was to explore the relationships between personality traits
previously linked to deception (conscientiousness and honesty/humility), resume
misrepresentations and acceptance of these misrepresentations. Since resume fraud is not well
defined in the psychological literature, it was important to first categorize the different types of
misrepresentations. Therefore, the results of this study also contribute to our understanding of the
possible types of resume misrepresentations and the extent to which participants misrepresented.
As I will outline below, my findings indicate interconnected relationships between acceptability
of resume misrepresentations, actual resume misrepresentations, conscientiousness and
honesty/humility.
Fabrications, omissions and accuracy
Consistent with previous literature on applicant faking (Koeppel, 2006; George et al.,
2004; Guillory & Hancock, 2012), participants admitted to misrepresenting information on the
resume they constructed. Although I hypothesized that there would be three categories of
misrepresentations, my analysis revealed two categories of resume misrepresentations:
fabrications (exaggerations and inventions) and omissions. What I didn’t find was that
participants could distinguish between inventions and exaggerations, suggesting that
exaggerations and inventions are a part of the same construct. This can be explained by the idea
that any deviation from completely factual information creates a distortion in the way applicants
likely to omit negative information which may, if revealed to the evaluator, present a completely
different perspective of the applicant.
Accuracy was a component of resume misrepresentation separate from both fabrications
and omissions. My data indicates that accuracy was closely and negatively related to overall
fabrications, and to omissions but less so. It is also possible that other forms of intentional
misrepresentations were used by participants and impacted accuracy. For example, participants
may have phrased information pertaining to previous work experience ambiguously or they may
have described themselves with terms that could be interpreted subjectively, by means of using
terms such as “hard worker” or “very social personality”. It is also possible that individuals may
have unintentionally misrepresented themselves because they couldn’t recall the information
accurately. However, it is important to consider that accuracy may or may not be a
representation of intentional misrepresentation since it is mainly a summary of what the
participant thinks of the information being factual and not necessarily how much they
misrepresented.
Occurrence of misrepresentations
The data in my study supports the findings of Griffith and Peterson (2011) who found
that omissive and active misrepresentations can be used simultaneously. When looking at the
overall resume, Table 3 shows that individuals fabricated slightly less than they omitted. This is
consistent with Donovan et al. (2003), who also found in their research that individuals
misrepresented by omission the most and lied the least. There were no significant differences in
Acceptability of misrepresentations
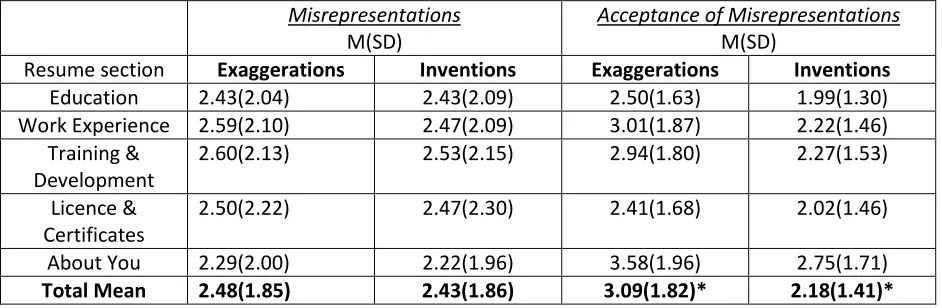
When categorizing the acceptability of misrepresentations by items of exaggerations,
inventions, omissions, individuals found it overall slightly more acceptable to exaggerate
information than invent, whereas omissions were found to be the most acceptable form of
misrepresentation on a resume.
However, our analysis revealed that exaggerations and inventions fall under one
component of fabrications, revealing an inconsistency between how people perceive
misrepresentations and how these misrepresentations actually relate to overall resume accuracy.
Correlations between acceptance and misrepresentations
The findings of previous literature, which showed that individuals who find deception
acceptable are also more likely to use deception (Lippard, 1988; McLeod & Genereux, 2008),
were consistent with our findings. As Hopper and Bell (1984) suggested, we assessed
acceptability of misrepresentations specifically to type of misrepresentation (fabrication and
omission), and found evidence that, as predicted, people were more likely to fabricate or omit
information if they thought the behaviour was acceptable.
Personality
Like the work of McFarland and Ryan (2000), and McLeod and Genereux (2008), we
found evidence that individual differences play a role in applicants’ tendency to misrepresent
information. Individuals who are more honest/humble or conscientious were less likely to
fabricate information on their resume, or find this behaviour acceptable.
omissions, conscientious individuals were the only ones to significantly omit less information,
even if they believed that it was acceptable to do so.
Implications
From findings of this study we can see that acceptance of misrepresentations is one of the
factors that determines whether an individual will misrepresent on their resume. It is also
interesting that individuals who fabricated information were also more likely to omit
information, showing a pattern of behaviour among individuals who misrepresented.
Personality is another factor that can predict who will misrepresent on a resume.
Although individuals who are honest are less likely to fabricate information, it was conscientious
individuals who were the least likely to misrepresent overall, whether it be in the form of
fabrication or omission. This can be relatable to the finding that conscientiousness is a single best
predictor of work performance (Kashy & DePaulo, 1996). Organizations may utilize this
information by adding a test of conscientiousness to their battery of tests when screening
applicants. Since conscientiousness is susceptible to faking, objective and indirect measures of
conscientiousness may be useful.
Individuals perceived omission to be the most acceptable form of misrepresentation.
Previous literature measuring the extent to which participants judged the acceptability of active
lying (fabricating) and lying by omission revealed that individuals rated outright lying as worse
than omitting (Haidt & Baron, 1996). However, there is evidence in our findings that both
omissions and fabrications decrease the accuracy of a resume and create a distortion in
Although accuracy was related to fabrications and omissions, it was not related to
personality. If individuals gave lower ratings of accuracy due to lack of memory, it would make
sense why personality did not relate to accuracy. More specific probes of misrepresentation
ratings are suggested below.
Limitations and Future research suggestions
A suggestion for future research would be to explore the categorization of
misrepresentations further to understand why the accuracy component did not correlate with
either honesty or conscientiousness, although it is clear that there are connections between
individual differences and fabrications and omissions, which relate to resume accuracy. One way
to do so would be to be more specific when assessing when and how individuals misrepresent
information on their resume. This could be done in a qualitative study, for example by pointing
to specific sentences or bits of information participants provide in their resume, and asking about
the extent of accuracy of each piece of information. This would also address the issues of
potential misrepresentations by means of ambiguous statements, since this way participants can
be directly asked about the intention of the information provided.
Griffith and Peterson (2011) suggested focusing on “how” and “why” participants
misrepresent, and even though this study begins to explore the answers to these questions, much
more research is needed using both qualitative and quantitative approaches to data collection.
Researchers interested in exploring this topic may find qualitative studies useful. Participants
could be given a chance to explain how and why they may have misrepresented and researchers
could probe further and receive answers which are richer in detail and description. Future studies
Although the findings of this research have led to some interesting conclusions, this study
is not without limitations. One shortcoming of this study is that it only looked at
misrepresentations that were intentional. It is also possible that participants misrepresented
themselves but they were unaware that they were in fact distorting the information. Another
limitation is that participants may not have applied for a job for a long time and may not
remember their information accurately. In future research, it might be prudent to ask respondents
when they last updated their resume or looked at it. Common method variance may also be an
issue since all information is collected using an online based survey method. Also, respondents
may have different interpretations of the labels on the Likert scales which ask to rate the extent
of misrepresentations, which would potentially create a measurement issue. To solve this,
researchers may find it useful to rate misrepresentations in terms of percentage of accuracy,
100% being completely accurate and 0% being completely inaccurate. Furthermore, since being
dishonest is considered to be a socially undesirable activity, although data was collected
anonymously and for research purposes, it is possible that some participants may still not have
fully admitted the extent to which they misrepresented. Since participants were aware that they
were not applying for an actual job, it is possible that they may not have taken the task of resume
construction as seriously as if they were applying for a real job. Furthermore, it may have been
useful to include questions to test the knowledge of the content provided in the job description as
a way to check that individuals actually read the job advertisement before proceeding to
construct the resume. Another possible limitation is that participants were asked to provide
acceptability of resume misrepresentation ratings right after they were asked to what extent they
misrepresented. Since there was no time separation between the two tasks, participants may have
Despite these limitations, this study is one of the first attempts in scientific research to
categorize resume misrepresentations and connect them to individual differences. Based on our
findings, it is evident that a relationship exists between individual differences, acceptance of
resume misrepresentations and the extent to which individuals misrepresent information on their
References
Anderson, C. D., Warner, J. L., & Spencer, C. C. (1984). Inflation bias in self-assessment
examinations: Implications for valid employee selection. Journal of Applied
Psychology, 69(4), 574.
Ashton, M.., Lee, K, Perugini, M., Szarota, P., de Vries, R., Di Blas, L.(2004). A six-factor
structure of personality-descriptive adjectives: Solutions from psycholexical studies in
seven languages. Journal of Personality and Social Psychology, 86, 356–366.
Ashton, M.., Lee, K. (2009). The HEXACO-60: A short measure of the major dimensions of
personality. Journal of Personality Assessment, 91, 350-52.
Babcock, P. (2003). Spotting lies. HR Magazine, 48, 46–52.
Barrick, M.R. and Mount, M.K. (1996) Effects of impression management and self-deception on
the predictive validity of personality constructs. Journal of Applied Psychology, 81, 261–
272.
Buller, D. B., & Burgoon, J. K. (1996). Interpersonal deception theory. Communication
theory, 6(3), 203-242.
Burke, M. E. (2005). 2004 reference and background checking survey report. Alexandria, VA:
Society for Human ResourceManagement.
Burns, G. N., & Christiansen, N. D. (2006). Sensitive or senseless: On the use of social
desirability measures in selection and assessment. In R. L. Griffith & M. H. Peterson
(Eds.), A closer examination of applicant faking behavior (pp. 115–150). Greenwich, CT:
Costa, P. T., Jr., & McCrae, R. R. (1985).The NEO Personality Inventory manual. Psychological
Assessment Resources: Odessa, FL.
Comrey, A. L., & Lee, H. B. (2013). A first course in factor analysis. Psychology Press.
DePaulo, B. M., Deborah A. Kashy, Susan E. Kirkendol, Melissa M. Wyer, and Jennifer A.
Epstein. 1996. Lying in everyday life. Journal of personality and social psychology 70,
(5): 979-995
DePaulo, B.M., and Robert Rosenthal. 1979. Telling lies. Journal of personality and social
psychology 37, (10): 1713-1722.
DePaulo, B. M. (1992). Nonverbal behavior and self-presentation. Psychological
bulletin, 111(2), 203.
Donovan, J. J., Dwight, S. A., & Hurtz, G. M. (2003). An assessment of the prevalence, severity,
and verifiability of entrylevel applicant faking using the randomized response technique.
Human Performance, 16, 81–106.
Engleman, Doreena, and Brian H. Kleiner. 1998. Effective employment screening practices. The
Career Development International 3, (4): 164-168.
Exline, R., Thibaut, J., Hickey, C., & Gumpert, P. Visual interaction in relation to
Machiavellianism and an unethical act. In R. Christie and F. Geis (Eds.), Studies in
machiavellianism. New York: Academic Press, 1970.
on System Sciences.
Goldberg, L. R. (1990). An alternative description of personality: The Big-Five factor structure.
Journal of Personality and Social Psychology, 59, 1216–1229.
Grover, Steven L. 1993. Lying, deceit, and subterfuge: A model of dishonesty in the
workplace. Organization Science 4, (3): 478-495.
Grover, Steven L. 1993. Why professionals lie: The impact of professional role conflict on
reporting accuracy. Organizational behavior and human decision processes 55, (2):
251-272.
Griffith, R. L., & Peterson, M. H. (2011). One piece at a time: the puzzle of applicant faking and
a call for theory. Human Performance, 24(4), 291-301.
Guadagnoli, E., & Velicer, W. F. (1988). Relation to sample size to the stability of component
patterns. Psychological bulletin, 103(2), 265.
Guillory, J., & Hancock, J. T. (2012). The effect of LinkedIn on deception in
resumes. Cyberpsychology, Behavior, and Social Networking, 15(3), 135-140.
Haefner, R. (2007). Résumé lies you can’t get away with. CNN/Careerbuilder.Com. Available at
http://edition.cnn.com/2007/US/Careers/01/19/cb.lies/ (accessed, January 19, 2007)
Haidt, J., & Baron, J. (1996). Social roles and the moral judgement of acts and omissions.
European Journal of Social Psychology, 26(2), 201-218.
Hays, A. F., & Dunning, D. (1997). Construal processes and trait ambiguity: Implications for
Hopper, R., & Bell, R. A. (1984). Broadening the deception construct. Quarterly Journal of
Speech, 70(3), 288-302.
Jones, E. E., & Pittman, T. S. (1982). Toward a general theory of strategic self-presentation. In J.
Suls (Ed.), Psychological perspectives on the self (Vol. 1, pp. 231–262). Hillsdale, NJ:
Lawrence Erlbaum Associates Inc.
Kaplan, David M., and James E. Fisher. 2009. A rose by any other name: Identity and impression
management in résumés. Employee Responsibilities and Rights Journal 21, (4): 319-332.
Kashy, D. A., & DePaulo, B. 1996. Who lies? Journal of personality and social psychology 70,
(5): 1037-1051.
Kim B. H. (2006). Building a theory of strategic deception. Unpublished doctoral dissertation,
East Lansing, Michigan State University.
Koeppel, D. (2006). Fudging the facts on a résumé is common, and also a big risk. New York
Times, April 23, 2006.
Komar, S., Brown, D. J., Komar, J. A., & Robie, C. (2008). Faking and the validity of
conscientiousness:A Monte Carlo investigation. Journal of Applied Psychology, 93, 140–
154.
Kuhn, Kristine M., Timothy R. Johnson, and Douglas Miller. 2013. Applicant desirability
influences reactions to discovered résumé embellishments. International Journal of
and two-component model. Psychological Bulletin, 107, 34-47.
Lee, S. T. (2004). Lying to tell the truth: Journalists and the social context of deception. Mass
Communication and Society, 7, 97-120.
Lee, K., Ogunfowora, B., & Ashton, M. C. (2005). Personality traits beyond the Big Five: Are
they within the HEXACO space? Journal of Personality, 73, 1437–1463.
Lee, K., Ashton, M. C., & Shin, K. H. (2005). Personality Correlates of Workplace Anti‐Social
Behavior. Applied Psychology, 54(1), 81-98.
Levashina, J., & Campion, M. A. (2006). A model of faking likelihood in the employment
interview. International Journal ofSelection and Assessment, 14, 299–316.
Lippard, P. V. (1988). “Ask me no questions, I'll tell you no lies”: Situational exigencies for
interpersonal deception. Western Journal of Communication (includes Communication
Reports), 52(1), 91-103.
McFarland, L. A., & Ryan, A. M. (2000). Variance in faking across noncognitive measures.
Journal of Applied Psychology, 85, 812– 821.
McLeod, B. A., & Genereux, R. L. (2008). Predicting the acceptability and likelihood of lying:
The interaction of personality with type of lie. Personality and individual
differences, 45(7), 591-596.
Mitchell, T.R. & Daniels, D. (2002). Motivation. In W. C. Borman, D. R. Ilgen, & R. J. Klimoski
(Eds.) Comprehensive Handbook of Psychology, Volume Twelve:Industrial and
Organizational Psychology. New York: John Wiley.
Paulhus, D. L. (1998). Interpersonal and intrapsychic adaptiveness of trait self-enhancement: A