DOI: 10.1534/genetics.105.052019
Evolution of the Human Immunodeficiency Virus Envelope Gene
Is Dominated by Purifying Selection
C. T. T. Edwards,*
,1E. C. Holmes,
†O. G. Pybus,
‡D. J. Wilson,
§R. P. Viscidi,**
E. J. Abrams,
††R. E. Phillips* and A. J. Drummond
‡,2*Nuffield Department of Clinical Medicine and§Department of Statistics, University of Oxford, Oxford OX1 3SY, United Kingdom, †Center for Infectious Disease Dynamics, Department of Biology, Pennsylvania State University, University Park,
Pennsylvania 16802,‡Department of Zoology, University of Oxford, Oxford OX1 3PS, United Kingdom, **Department of Pediatrics, The Johns Hopkins Hospital, Baltimore, Maryland 21287 and
††Department of Pediatrics, Columbia University College of Physicians and Surgeons and Harlem Hospital Center, New York, New York 10032
Manuscript received October 7, 2005 Accepted for publication August 17, 2006
ABSTRACT
The evolution of the human immunodeficiency virus (HIV-1) during chronic infection involves the rapid, continuous turnover of genetic diversity. However, the role of natural selection, relative to random genetic drift, in governing this process is unclear. We tested a stochastic model of genetic drift using partial envelope sequences sampled longitudinally in 28 infected children. In each case the Bayesian posterior (empirical) distribution of coalescent genealogies was estimated using Markov chain Monte Carlo methods. Posterior predictive simulation was then used to generate a null distribution of genealogies assuming neutrality, with the null and empirical distributions compared using four genealogy-based summary statistics sensitive to nonneutral evolution. Because both null and empirical distributions were generated within a coalescent framework, we were able to explicitly account for the confounding influence of demography. From the distribution of corrected P-values across patients, we conclude that empirical genealogies are more asymmetric than expected if evolution is driven by mutation and genetic drift only, with an excess of low-frequency polymorphisms in the population. This indicates that although drift may still play an important role, natural selection has a strong influence on the evolution of HIV-1 envelope. A negative relationship between effective population size and substitution rate indicates that as the efficacy of selection increases, a smaller proportion of mutations approach fixation in the population. This suggests the presence of deleterious mutations. We therefore conclude that intrahost HIV-1 evolution in envelope is dominated by purifying selection against low-frequency deleterious mutations that do not reach fixation.
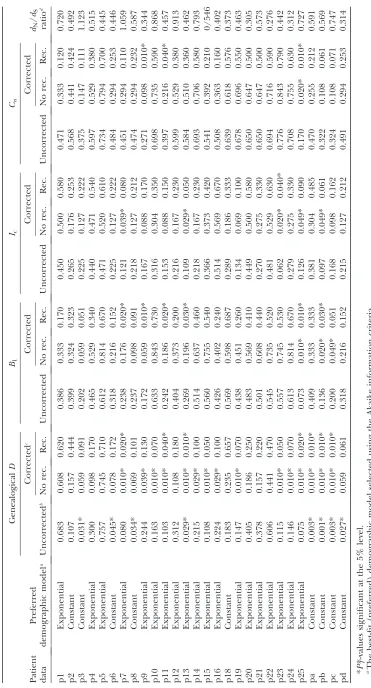
D
URING chronic human immunodeficiency virus (HIV-1) infection the turnover of virions is rapid (Hoet al.1995; Weiet al.1995), the mutation rate high(Mansky and Temin 1995), and the population size
large (Haase 1999). Consequently a huge amount of diversity accumulates (Wain-Hobson1993), so that viral genomes within an individual can differ by between 3 and 5% in their envelope regions (Balfe et al. 1990; Wolfs et al. 1990; Lamers et al. 1993). This variation has important consequences, allowing HIV-1 to infect different cell types (Groeninket al.1992; Chavdaet al. 1994), evade the immune system (Burns et al. 1993; Priceet al.1997; Weiet al.2003), and acquire resistance to antiviral drugs (Fitzgibbonet al.1993; Condraet al.
1996;deJonget al.1996). During chronic intrahost in-fection, the HIV-1 envelope gene diverges from the found-ing population at a rate of 1%/year (Shankarappa et al.1999). Revealing the processes that govern this di-versification, and the properties of mutations that con-tribute to increasing levels of diversity, is therefore central to our understanding of HIV-1 evolution.
The trajectory of emergent mutations in the popula-tion is potentially influenced by both random genetic drift and natural selection. If selection played no role then evolution would proceed according to a stochastic model of genetic drift. With increasing selection, the accumulation of polymorphisms becomes more predic-table. When selection is strong and the effect of drift negligible, evolution can be considered deterministic. In between the extremes of deterministic and purely stochastic evolution, it is possible for drift, selection, and mutation to all have interacting and important influen-ces on population evolution (Rouzineet al.2001).
The degree of evolutionary stochasticity to which a population is subjected is critically influenced by the number of replicating virionsN. If the population were
Sequence data from this article have been deposited with the EMBL/ GenBank Data Libraries under accession nos. AY823998–AY824946.
1Corresponding author: Department of Maths and Applied Maths,
University of Cape Town, Rondebosch, Cape Town 7701, Republic of South Africa. E-mail: [email protected]
2Present address: Department of Computer Science, University of
Auckland, Private Bag 92019, Auckland, New Zealand.
ideal (all changes are neutral, with discrete generations and no population subdivision) then stochasticity could be predicted byN, with largeN(Nm?1; wheremis the mutation rate) associated with a deterministic outcome. Because real populations are not ideal, stochasticity is instead represented by the effective population sizeNe, which is the expected value ofNunder ideal conditions, given the stochasticity observed (Wright 1931). In HIV-1,Neis typically estimated to be103–104(Leigh Brown1997; Seoet al.2002; Achazet al.2004; Shriner et al.2004). These smallNevalues (Nem>1) have been interpreted as evidence for stochastic evolution (Leigh Brown 1997; Shriner et al. 2004). However, in each caseNewas obtained under the assumption of neutral-ity, despite the potential influence that selection may have on its estimation. Because selection is confounded withNe, Nedoes not provide an accurate predictor of stochastic evolution. Instead, it should be regarded sim-ply as a measure of sequence diversity in the population u, weighted by 1/2m (i.e., Ne ¼ u/2m in a haploid population). Hence, because diversity can be reduced by selection, a low estimatedNecould also be a sign of deterministic evolution in the form of a mutation– selection balance. Arguments have been forwarded that a neutral model of evolution is indeed valid (Leigh Brown 1997; Shriner et al. 2004), so that a low Ne provides an indication of stochasticity. However, by con-sidering individual time points from a single population separately, these have suffered from a lack of statistical power to reject neutrality and nonindependence.
Here we test directly for a stochastic model of evolution in which the fate of emergent mutations is dictated only by genetic drift. Rejecting this model, we infer it to be an inadequate representation of HIV-1 envelope evolution and conclude an important role for natural selection.
We apply our test to envelope sequences from a co-hort of HIV-1-infected children, sampled longitudinally from birth. The external envelope protein is a likely site of selection, being targeted by the patient’s antibody response (Mooreet al. 1994), and responsible for re-ceptor binding and entry into host cells (Wyattand Sodroski 1998), and therefore constitutes an ideal region with which to investigate the evolutionary pro-cesses acting on HIV-1.
MATERIALS AND METHODS
Background:Currently the best evidence of a role for nat-ural selection in HIV-1 evolution is provided by estimates of the ratio of nonsynonymous to synonymous changes per site (dN/dS), with dN/dS ¼ 1 being the expectation under neutrality. Codon-based estimates of thedN/dSratio in HIV-1 envelope sequences have consistently shown a preponderance of constrained sites (dN/dS , 1), punctuated by relatively frequent positive selection (dN/dS.1) (Nielsenand Yang
1998; Rossand Rodrigo2002; Guindonet al.2004). These
techniques are sensitive to recombination, which leads to an overestimation of the number of positively selected sites (Anisimova et al. 2003; Shriner et al. 2003). Recently a
coalescent approximation has been proposed to overcome this problem (Wilsonand McVean2006). However, whether
all synonymous changes in HIV-1 are selectively neutral is still uncertain.
Another approach is provided by population genetic argu-ments based on the frequency distribution of polymorphic sites. The most popular of these tests are Tajima’sD(Tajima
1989), and Fu and Li’sD(Fuand Li1993). These compare
the contributions of low- and high-frequency polymorphisms to population diversity, representing recent and established substitutions, respectively. The frequency distribution of non-neutral segregating sites will be influenced by selection. Puri-fying and directional positive selection will lead, on average, to an excess of low-frequency polymorphisms in the contempo-rary population. However, this pattern of polymorphism can also be produced by demographic change, most notably exponential growth, necessitating the careful application of these statistics.
Because of its sensitivity to selection, we focus on Fu and Li’s Das a test statistic, adopting a genealogy-based approach to its estimation. We call this thegenealogical D, estimated using a version of coalescent theory (Kingman1982a,b) that can
con-sider sequences obtained from multiple time points simulta-neously (Rodrigoand Felsenstein1999). This increases the
power of our test and removes the problem of nonindepen-dence of samples obtained sequentially from a single individual. In addition to the genealogicalDwe include measures of tree symmetry. Selection is likely to leave its mark on the ge-nealogy by biasing the extinction and branching rates of different lineages (Grenfellet al. 2004). This will lead to
imbalance, or asymmetry, in the phylogeny (Kirkpatrickand
Slatkin1993), so that the use of measures of tree asymmetry
in this study is justified.
Estimates of each test statistic involve sampling a large number of genealogies within a Bayesian framework. Hence, uncertainties in parameters of the evolutionary model and the ancestral genealogy are explicitly acknowledged. For each test of neutrality, a distribution of coalescent genealogies was pro-duced from the empirical data and compared to a simulated null distribution using a goodness-of-fit test.
Testing a model of genetic drift: Generating the null and posterior genealogical distributions:For each set of longitudinally sampled patient sequences the posterior distributions of genealogies were generated using the BEASTsoftware package (Drummondand Rambaut 2004). This selects genealogies
according to their posterior probability within a Bayesian framework using Markov chain Monte Carlo (MCMC), as described previously (Drummond et al. 2002). The HKY85
model of nucleotide substitution (Hasegawaet al.1985), with
a four-category discrete approximation to a gamma distribu-tion of rate heterogeneity across sites (Yang1994), was
imple-mented. All substitution model parameters, includingk, the shape parametera, and substitution ratemin changes per site per day, were estimated from the data using MCMC along with demographic model parameters (shaded area in Figure 1). Both a constant population size and exponential growth were assumed. Using the serial sampled coalescent, population size is considered as the product of the effective population size and generation length in daysNet(Rodrigoand Felsenstein
1999). HIV-1 is known to follow a reproducible pattern of in-creasing diversity during the course of infection (Shankarappa
et al.1999), making the exponential model appropriate. It was compared to the constant alternative according to the Akaike information criteria (AIC) (Akaike1973), with the model with
the lowest AIC score considered to be the best representation of the data.
demographic model parameter values that can be used to predict future iterations of the evolutionary process. This is known as posterior predictive simulation (Rubin 1984),
per-formed here using the COALGEN program (Rambautand
Drummond2004). It proceeds by simulating new coalescent
genealogies using the posterior distribution of demographic parameter values generated from the data, with one simulated tree for each step in the MCMC chain (see Bollback2002).
This generates an appropriate null distribution to test if the assumptions made by the coalescent are accurate, because under this condition the posterior and null distributions are expected to be identical in the long run.
The neutral coalescent proceeds according to a stochastic model that represents an evolutionary process dominated by genetic drift. We are interested in departures from this assump-tion that are attributable to natural selecassump-tion. We therefore compared the null and posterior distributions in goodness-of-fit tests using genealogy-based statistics sensitive to nonneutral evolution. One of these statistics, the genealogicalD, is also sensitive to demography. In particular, exponential growth is known to lead to more negative values, so that if the null distribution was generated under the incorrect assumption of
a constant population size, it would yield a large discrepancy between the posterior and null distribution of values even for a population not influenced by selection. An advantage of pos-terior predictive simulation is that it can incorporate the assumption of exponential growth so that its potentially con-founding influence is explicitly accounted for.
Comparing the null and posterior genealogical distributions:The observed and predicted genealogical distributions were com-pared using four summary statistics (Table 1). The genealog-icalD-statistic is a corrected comparison of the total length of the rooted tree to that expected from the length of the tips under neutral genetic drift (seeappendix), and assuming that
all sequences were sampled simultaneously (i.e., the neutral expectation for synchronous sequences is 0). When longitu-dinal samples are considered, the genealogicalDis usually,0, even for a neutral population, because the length of internal branches is shortened relative to that predicted from the tips. If slightly deleterious mutations are abundant in the popula-tion and selected against, then they will on average be at lower frequency than other mutations (Nielsen and Weinreich
1999) and segregate near to the tips of the genealogy (Williamsonand Orive2002). Simulation studies, in which
Figure1.—Illustrative summary of methods. The procedure outlined was repeated for both constant and exponential
singleton mutations were randomly allocated to sequences generated under a neutral model of evolution, showed that the presence of low-frequency mutations leads to more nega-tiveD-values (data not shown). Positive selection on the other hand is more likely to lead to the fixation of changes between time points (Williamson2003) and less negative estimates of
D. As noted above, the genealogicalDis sensitive to exponen-tial growth, which was factored out of the analysis when evidence for exponential growth was detected in the empirical data (i.e., when the exponential demographic model was found to have the lowest AIC score).
In addition, three measures of tree symmetry were used:B1 (Kirkpatrickand Slatkin1993), Colless tree imbalance (Ic)
(Colless1982), and cherry count (Cn) (McKenzieand Steel
2000). The response of each of these statistics to increasing asymmetry is listed in Table 1, with mathematical definitions given in theappendix.
Testing for significance: To test for a statistically significant difference between the null and posterior genealogical distributions (Figure 1), we first calculated the proportion of times that the simulated genealogy yielded a summary statistic (T) value greater (forIc) or less (forD,B1, andCn) than the genealogy estimated from the empirical data. This provided the posterior predictiveP-valuePT*(seeappendix). In the case of the genealogicalD, this specifically tests the significance of more negative values, which would indicate an excess of low-frequency polymorphisms and be consistent with the action of purifying selection.
By considering the entire distributions of T-values in our estimation ofPT*, we account for the considerable uncertainty inherent in estimates of the true genealogy. However, poste-rior predictiveP-values are known to be conservative (Meng
1994), in that they do not reveal the full discrepancy between the model being tested and the empirical data. Statistically, there are fewer extreme values than would be expected ifPT* followed a uniform reference distribution between 0 and 1. To overcome this problem we simulated multiple sequence data sets under a neutral coalescent model of evolution. By esti-matingPT*for each, we obtained the expected reference distri-bution ofPT*-values. This allowed us to apply the appropriate correction toPT*-values obtained from the empirical data (see
appendix), ensuring that the expected distribution of
cor-rectedPT*-values was uniform. We thus not only increased the sensitivity of our test, but also were able to combine corrected PT*-values across patients so that a more powerful inference could be made.
Because we have prior knowledge of the effect of selection on each of the statistics, a one-tailed test was applied to each correctedPT*-value, withPT*,0.05 considered significant.
Patient data: Envelope sequences were obtained from 28 HIV-1-positive children infected at birth. The majority of these sequences have been published previously (Edwards
et al.2006) and detailed descriptions of the cohort (Thomas
et al.1994; Abrams et al.1995) and sequencing techniques
(Strunnikovaet al.1995) are given elsewhere.
The sequences analyzed were derived from a heteroduplex mobility assay (HMA), which screens the sample to isolate dis-tinct clones. They were therefore more divergent than would be expected from a random sample. Because closely related sister taxa were underrepresented, the sampled distribution of coalescent times may have been slightly biased toward the past, in comparison to that expected from a random sample. This will have had an effect on estimates of population demogra-phy, contributing to the appearance of an expanding or logis-tically growing population. However, it is unlikely to have affected our test for selection, since the distribution of node heights is accounted for by the demographic correction implemented.
Sequences were360 bp in length, spanning the highly variable envelope V3 region. Multiple clones were available from serial time points postinfection (supplemental Table 1 at http://www.genetics.org/supplemental/) with the majority during the chronic stages of disease (supplemental Table 2 at http://www.genetics.org/supplemental/). All sequences (excepting those from pa, pb, pc, and pd) were derived from viral RNA. These sequences are available from GenBank under accession nos. AY823998–AY824946.
RESULTS
Application of test statistics to patient data: We tested for departures from a model of genetic drift through the application of each test statistic to envelope sequences from 28 infected children, sampled longitu-dinally from birth. In the majority of cases (19/28) evi-dence for exponential growth of the viral population was detected (Table 2). Notable exceptions were the patients for which only proviral DNA was available. Se-quences derived from this source will represent virus that may have been active some time in the past. How-ever, the serial sampled coalescent will treat each se-quence as a member of the temporal population from which it was sampled. Therefore, because the popula-tion may have remained apparently unchanged, it could appear to follow a constant demographic. This suggests that caution should be exercised in interpreting the results from these patients, because unaccounted for exponential growth may have taken place.
The distributions of uncorrected PT*-values across patients, assuming both a constant and an exponential demographic, are shown in Figure 2. Also shown are the reference distributions of P*T-values obtained from sequences simulated under a neutral coalescent model (seeappendix). These are typicallyS-shaped, rather than lying on the diagonal, consistent with the conservative
TABLE 1
Summary statistics used to test for selection
Summary statistic Expectation under selection Reference
GenealogicalD More negative values indicate purifying selection. —
Less negative values indicate positive directional selection.
B1 Value will decrease as asymmetry increases. Kirkpatrickand Slatkin(1993)
Colless tree imbalanceIc Increases from 0 to 1 as asymmetry increases. Colless(1982)
nature of posterior predictive P-values (i.e., there is a lower frequency of extreme values than would be expected from a uniform distribution). After correcting P*T-values with the simulated reference distributions, and assuming the best-fit (preferred) demographic model, we obtained significant results using both the genealogicalDand measures of tree asymmetry (Table 2). The genealogicalDgave the strongest evidence for selection, with 15 of the patients tested giving significant correctedPT*-values (Table 2).
Accounting for recombination: The posterior distri-butions of genealogies were generated assuming no recombination. If recombination is not accounted for, the resultant homoplasious changes will lead to a length-ening of the tips of the genealogy relative to the internal branches, in a manner similar to exponential growth (Schierupand Hein2000). It also has the potential to affect tree asymmetry. Because recombination in HIV-1 is frequent ( Junget al.2002; Zhuanget al.2002), it may therefore have influenced our estimation of each test statistic. In particular, our estimate of the genealogicalD will be biased toward more negative values if sequences
were obtained from a recombining population. To account for the potential influence of recombination on our estimates ofDand tree asymmetry, we simulated reference distributions under this assumption and used them to correct ourPT*-values.
For each patient we first estimated the per site rate of recombination using the LDhat software package (McVean et al. 2002). Because of the short sequence length, we assumed a linear model of recombination. The significance of each result was tested using theLkmax
test, which randomly permutes segregating sites along the sequence and tests whether the maximum compos-ite likelihood obtained from the real data differs from this null distribution. The average ratio of the recom-bination to mutation rate (r/m) was found to be 0.44 (range 0.0–3.3) (supplemental Table 3 at http://www. genetics.org/supplemental/). Sequences were then gen-erated as before assuming both a constant population size and exponential growth, with anr/m ratio of 0.5 (approximately equal to the mean across data sets).
If the reference distributions of P*T-values obtained with and without recombination are different, this Figure2.—Distribution of uncorrectedPT*-values for each test statistic, calculated using the observed data. Also shown are the
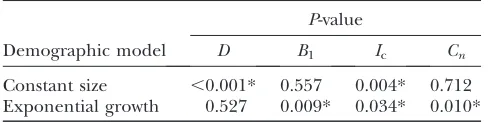
indicates that recombination may have confounded interpretation of our significant results. Using the Kolmogorov–Smirnov test we found significant differ-ences in the reference distributions ofPT*-values for all statistics (Figure 2 and Table 3). This indicated that our original correction to empiricalPT*-values may not have been robust to the effect of recombination. In the case of the genealogical D, recombination leads to more negative values, so that the significance ofPT*-values will have been increased (see reference distributions in Figure 2). Interestingly, this bias was much greater when a constant population size was assumed. In the case of tree asymmetry, the effect of recombination was also dependent on the demographic model assumed (Table 3). The reasons for this are unclear, since recombina-tion is likely to have broad and unpredictable effects on the inferred genealogy. Nevertheless, we consider there to be sufficient evidence to necessitate a correction for its effect. We therefore applied a new correction based on reference distributions constructed under the as-sumption of recombination. This ensured that recom-bination was taken into account when interpreting the significance of our results.
For the genealogicalD, we found a notable reduction in the significance of our results under the preferred demographic model (Table 2). This indicated that significant departures from a simple stochastic model of evolution could have been induced by an empirically relevant rate of recombination. Furthermore, in four of the seven patients for which significant results were still observed (p11, p13, pa, and pb) r/m ratios .0.5 were estimated (supplemental Table 3 at http://www. genetics.org/supplemental/). For these patients cor-rection for the effects of recombination may have been inadequate.
The effect of recombination on measures of tree asymmetry was more complex. For Ic the number of significant results was also reduced, again indicating that recombination can inflate the significance of depar-tures from the expectation under drift, in this case by increasing levels of asymmetry. The correction ap-plied lowered the significance of observedIc-values to take this effect of recombination into account. In contrast, forB1andCnthe number of significant results was increased. This can be explained if recombination
lowered the degree of asymmetry recorded by these measures, so that the significance of observed values of B1andCnwas increased when recombination was taken into account.
Even after correction for recombination a number of significant results remained (Table 2). Because the statis-tics applied were specifically designed to detect nonneu-tral evolution, and because their significance cannot be accounted for by demography, we interpreted this as evidence for selection.
Distribution ofP*T-values across patients:To improve the sensitivity of our analysis we next examined the distribution of corrected PT*-values across patient data sets for evidence of a role for natural selection in HIV-1 evolution. Departures from the expected uniform dis-tribution were assessed using a one-tailed x2-test (see
appendix).
We found our results to be highly significant. Figure 3 shows the distribution of corrected PT*-values across patients, with corrections applied using a reference distribution with and without recombination. For pur-poses of illustration, onlyPT*-values obtained assuming the preferred demographic model for each patient are shown. The significance of departures from the expected uniform distribution is listed in Table 4. Assuming re-combination, and under the preferred demographic model, all statistics yielded a significant result.
The presence of slightly deleterious mutations:More negative genealogicalD-values, compared to the expec-tation under neutral genetic drift, indicate an excess of low-frequency polymorphisms in the population. Be-cause positive selection is likely to fix changes between time points, leading to a deficiency of low-frequency polymorphisms, this result suggests that these represent transient, slightly deleterious mutations that are re-moved from the population by purifying selection before they increase in frequency.
To gain further insight into the nature of the selec-tive forces operating we estimated the overall dN/dS ratio across the region using a codon-based method (Goldmanand Yang1994). This provides an appropri-ate comparison to the results presented here. In line with previous work on HIV-1 envelope (Nielsen and Yang1998), the overalldN/dSratio is,1 for all patients (except p3 and p7). These results do not in themselves provide a robust test of selection, but nevertheless indi-cate that if selection is acting, as we have argued here, its primary role is in lowering the rate of nonsynonymous substitution.
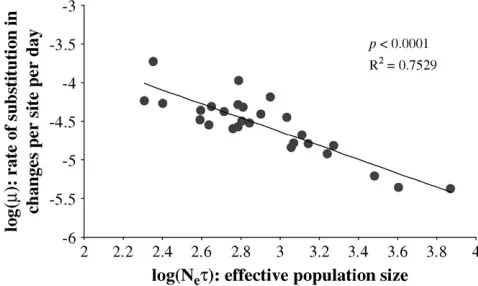
If the majority of mutations are slightly deleterious, then purifying selection will lower their contribution to the substitutions that occur between time points. There-fore the stronger the selection, the lower the rate of fixation (Kimura1962). To investigate the relationship between the strength of selection and rate of sub-stitution we plotted magainst the effective population sizeNet, both estimated using BEAST. Because estimates
TABLE 3
Kolmogorov–Smirnov tests for equivalence of reference distributions in presencevs.absence of recombination
P-value
Demographic model D B1 Ic Cn
Constant size ,0.001* 0.557 0.004* 0.712 Exponential growth 0.527 0.009* 0.034* 0.010*
of Net will be influenced by selection (as discussed above), it was obtained using the third codon site only. The majority (70%) of changes at this position are synonymous, so that diversity is more likely to reflect the strength of selection acting on the population.
Under a strictly neutral model of sequence evolution the rate of substitution is dependent only on the under-lying mutation rate and is therefore independent of the population size. In contrast to this expectation, we found a strong negative correlation betweenmandNet (P , 0.0001; Figure 4). This result is consistent with theoretical predictions (Ohta 1987) and suggests the action of purifying selection in removing slightly dele-terious mutations from the population before they increase in frequency.
DISCUSSION
We have tested for a stochastic model of evolution in which mutations arise randomly and in proportion to the length of each branch in the coalescent genealogy.
This represents evolution driven by mutation and random genetic drift only. Our analysis shows that the empirical data do not fit this model. Because the genea-logical statistics used to test model fit were designed specifically to detect nonneutral evolution, we interpret this as evidence for natural selection acting on the population.
Population genetics theory states that genetic drift will dominate evolution when the product of the effective population size and selection coefficient is much less than one (Nes>1). Because the HIV-1 genome is not strictly neutral (s 6¼ 0), this would be interpreted as evidence for a lowNe. We have shown that this is not the case, so that selection is important in shaping the evolution of HIV-1 envelope sequences. This conclusion does not imply that evolution is deterministic with natural selection the only important component. Ge-netic drift is likely to play a substantial role, particularly at sites where the selection coefficient is small. In the case of purifying selection, evolution may still be con-sidered stochastic but with an increased bias toward the loss (rather than fixation) of emergent mutations. Figure3.—Distribution of correctedP*
Our analyses focused on the frequency distribution of polymorphic sites in the population and tree asymme-try, both estimated from the coalescent genealogy. By simulating a null distribution of genealogies under a stochastic model of genetic drift, we could test directly whether the observed frequency distribution differed significantly from this expectation. The approach adopted incorporates a number of improvements on previous tests that have applied similar goodness-of-fit tests (LeighBrown1997; Shrineret al.2004). Multiple time points were considered simultaneously, improving the power of each test and removing nonindependence from the analysis. Furthermore, the use of posterior predictive simulation to generate the null distribution of genealogies eliminated the confounding influence of demographic change. Further improvements to the sensitivity of our test could be made by estimating de-mography using synonymous sites only. Assuming that synonymous and nonsynonymous sites evolve indepen-dently, this would allow posterior predictive simulation
under conditions that more closely reflect the actual demography of the viral population. Although these techniques are currently unavailable within the imple-mented framework, they could provide a fruitful avenue for future research (see Hahnet al.2002).
In addition to higher than expected levels of tree asymmetry, we found that the frequency distribution of polymorphic sites (summarized by the genealogicalD) was significantly different from the expectation under drift, with a clear excess of low-frequency mutations. This suggests that purifying selection acts to remove slightly deleterious mutations before they increase in frequency, an interpretation consistent with codon-based estimates of thedN/dSratio, both here and in pre-vious work (Nielsenand Yang1998; Rossand Rodrigo 2002), that show the rate of nonsynonymous substitu-tion is generally low. To further investigate this hypoth-esis, we plotted the relationship between the rate of substitution m and effective population size Net. We found a strong negative correlation betweenmandNet, as expected if the majority of mutations are removed from the population and therefore make a decreasing contribution to the overall rate of change as the efficacy of selection increases (Ohta1987). BecauseNetwill be influenced by selection, we considered diversity only at third codon positions, which is largely synonymous. Nevertheless, synonymous diversity may still be reduced through linkage to sites that are under directional positive selection (MaynardSmithand Haigh1974). Thus, although it would predict a deficiency in the proportion of low-frequency mutations and therefore be incompatible with our previous observations, an alterna-tive explanation of this relationship is that the strength of positive directional selection differs between patients, being strongest at low levels of associated diversity.
A role for frequency-dependent selection is also plausible, so that the fitness advantage of a particular mutation is lost as it increases in frequency, impeding its eventual fixation. The negative relationship could then be explained if strong frequency-dependent selection imposed by the immune response simultaneously in-creased diversity and lowered the rate of substitution. This, however, would contradict what is known from empirical studies, which show that antibody escape mu-tations in envelope reach high frequencies before their selective advantage is lost (Weiet al.2003). Frequency-dependent selection is therefore unlikely to be strong enough to influence our estimates of the substitution rate. Furthermore, there does not appear to be any correlation between vigor of the antibody response and plasma viral loads (Richmanet al.2003; Schmitzet al. 2003), making it unlikely that the strength of frequency-dependent selection will correlate consistently with diversity across patients. On the basis of these argu-ments we conclude that frequency-dependent selection is an improbable explanation for the negative relation observed betweenmandNet.
Figure 4.—Regression analysis showing a negative
correla-tion between the substitucorrela-tion ratemand effective population size Net, estimated using the third codon position only. The rate of substitution could not be reliably estimated from one patient.
TABLE 4
Tests for selection using the distribution of corrected
PT*-values across patients P-value
Reference distribution D B1 Ic Cn
No recombination
Constant size ,0.001* 0.015* ,0.001* 0.350 Exponential growth ,0.001* 0.422 0.011* 0.786 Preferred model ,0.001* 0.053* ,0.001* 0.442
Recombination
Constant size ,0.001* 0.010* 0.015* 0.097 Exponential growth ,0.001* ,0.001* 0.146 0.020* Preferred model ,0.001* ,0.001* 0.035* 0.014*
P-values indicate the significance of departure from the uniform expectation and were calculated as outlined in the
Our results suggest that HIV-1 carries a mutational load of low frequency, deleterious mutations, which represent a substantial contribution to the total genetic diversity of the viral population. A burden of deleterious mutations is a probable consequence of the high rate at which genetic errors are introduced during replica-tion (Manskyand Temin1995), necessitating a short, compact genome to maintain evolutionary consistency (Overbaughand Bangham2001; Holmes2003). Even in the envelope gene, the most highly variable region of the genome, a degree of constraint is required for operational viability. This is not surprising, given its essential role in receptor binding and cell entry (Wyatt and Sodroski1998) and the need to maintain extensive glycosylation on its surface to avoid antibody neutrali-zation (Reitteret al.1998).
The BEAST analysis software was developed by Alexei Drummond and Andrew Rambaut and contributed to by Roald Forsberg, Oliver Pybus, and Korbinian Strimmer. We gratefully acknowledge the contri-bution of the New York City Maternal Infant HIV Transmission Study, funded by the Centers for Disease Control and Prevention. This work was supported by the Wellcome Trust (C.E., A.D., R.P., and E.H.) and the Biotechnology and Biological Sciences Research Council (D.W.).
LITERATURE CITED
Abrams, E. J., P. B. Matheson, P. A. Thomas, D. M. Thea, K. Krasinski
et al., 1995 Neonatal predictors of infection status and early death
among 332 infants at risk of HIV-1 infection monitored prospec-tively from birth. New York City Perinatal HIV Transmission Collab-orative Study Group. Pediatrics96:451–458.
Achaz, J., S. Palmer, M. Kearney, F. Maldarelli, J. W. Mellors
et al., 2004 A robust measure of HIV-1 population turnover
within chronically infected individuals. Mol. Biol. Evol. 21:
1902–1912.
Akaike, H., 1973 Information theory as an extension of the maxi-mum likelihood principle, pp. 267–281 in Second International
Symposium on Information Theory, edited by B. N. Petrov and
F. Csaki. Akademiai Kiado, Budapest.
Anisimova, M., R. Nielsenand Z. Yang, 2003 Effect of recombina-tion on the accuracy of the likelihood method for detecting pos-itive selection at amino acid sites. Genetics164:1229–1236. Balfe, P., P. Simmonds, C. A. Ludlam, J. O. Bishopand A. J. Leigh
Brown, 1990 Concurrent evolution of human immunodefi-ciency virus type 1 in patients infected from the same source: rate of sequence change and low frequency of inactivating mutations. J. Virol.64:6221–6233.
Bollback, J. P., 2002 Bayesian model choice and adequacy in phy-logenetics. Mol. Biol. Evol.19:1171–1180.
Burns, D. P., C. Collignonand R. C. Desrosiers, 1993 Simian im-munodeficiency virus mutants resistant to serum neutralization arise during persistent infection of rhesus monkeys. J. Virol.
67:4104–4113.
Chavda, S. C., P. Griffin, Z. Han-Liu, B. Keys, M. A. Vekonyet al., 1994 Molecular determinants of the V3 loop of human immu-nodeficiency virus type 1 glycoprotein gp120 responsible for con-trolling cell tropism. J. Gen. Virol.75(11): 3249–3253. Colless, D. H., 1982 Phylogenetics: the theory and practice of
phy-logenetic systematics. Syst. Zool.31:100–104.
Condra, J. H., D. J. Holder, W. A. Schleif, O. M. Blahy, R. M. Danovichet al., 1996 Genetic correlates of in vivo viral resis-tance to indinavir, a human immunodeficiency virus type 1 pro-tease inhibitor. J. Virol.70:8270–8276.
deJong, M. D., J. Veenstra, N. I. Stilianakis, R. Schuurman, J. M.
Lange et al., 1996 Host-parasite dynamics and outgrowth of
virus containing a single K70R amino acid change in reverse tran-scriptase are responsible for the loss of human immunodefi-ciency virus type 1 RNA load suppression by zidovudine. Proc. Natl. Acad. Sci. USA93:5501–5506.
Drummond, A., and A. Rambaut, 2004 BEAST. Bayesian Evolutionary
Analysis Sampling Trees v1.1.(http://evolve.zoo.ox.ac.uk/software.
html).
Drummond, A. J., G. K. Nicholls, A. G. Rodrigoand W. Solomon, 2002 Estimating mutation parameters, population history and genealogy simultaneously from temporally spaced sequence data. Genetics161:1307–1320.
Edwards, C. T. T., E. C. Holmes, D. J. Wilson, R. P. Viscidi, E. J. Abramset al., 2006 Population genetic estimation of the loss of genetic diversity during horizontal transmission of HIV-1. BMC Evol. Biol.6:28.
Fitzgibbon, J. E., A. E. Farnham, S. J. Sperber, H. Kimand D. T. Dubin, 1993 Human immunodeficiency virus type 1 pol gene mutations in an AIDS patient treated with multiple antiretroviral drugs. J. Virol.67:7271–7275.
Fu, Y. X., and W. H. Li, 1993 Statistical tests of neutrality of muta-tions. Genetics133:693–709.
Goldman, N., and Z. Yang, 1994 A codon-based model of nucleo-tide substitution for protein-coding DNA sequences. Mol. Biol. Evol.11:725–736.
Grenfell, B. T., O. G. Pybus, J. R. Gog, J. L. Wood, J. M. Dalyet al., 2004 Unifying the epidemiological and evolutionary dynamics of pathogens. Science303:327–332.
Groenink, M., A. C. Andeweg, R. A. Fouchier, S. Broersen, R. C.van derJagtet al., 1992 Phenotype-associated env gene variation among eight related human immunodeficiency virus type 1 clones: evidence for in vivo recombination and determi-nants of cytotropism outside the V3 domain. J. Virol.66:6175– 6180.
Guindon, S., A. G. Rodrigo, K. A. Dyer and J. P. Huelsenbeck, 2004 Modeling the site-specific variation of selection patterns along lineages. Proc. Natl. Acad. Sci. USA101:12957–12962. Haase, A. T., 1999 Population biology of HIV-1 infection: viral and
CD41T cell demographics and dynamics in lymphatic tissues. Annu. Rev. Immunol.17:625–656.
Hahn, M. W., M. D. Rausherand C. W. Cunningham, 2002 Dis-tinguishing between selection and population expansion in an ex-perimental lineage of bacteriophage T7. Genetics161:11–20. Hasegawa, M., H. Kishinoand T. Yano, 1985 Dating of the
human-ape splitting by a molecular clock of mitochondrial DNA. J. Mol. Evol.22:160–174.
Ho, D. D., A. U. Neumann, A. S. Perelson, W. Chen, J. M. Leonard
et al., 1995 Rapid turnover of plasma virions and CD4
lympho-cytes in HIV-1 infection. Nature373:123–126.
Holmes, E. C., 2003 Error thresholds and the constraints to RNA virus evolution. Trends Microbiol.11:543–546.
Jung, A., R. Maier, J. P. Vartanian, G. Bocharov, V. Junget al., 2002 Recombination: multiply infected spleen cells in HIV pa-tients. Nature418:144.
Kimura, M., 1962 On the probability of fixation of mutant genes in a population. Genetics47:713–719.
Kingman, M., 1982a The coalescent. Stoch. Proc. Appl.13:235–248. Kingman, M., 1982b On the genealogy of large populations. J. Appl.
Probab.19A:27–43.
Kirkpatrick, M., and M. Slatkin, 1993 Searching for evolutionary patterns in the shape of a phylogenetic tree. Evolution47:1171– 1181.
Lamers, S. L., J. W. Sleasman, J. X. She, K. A. Barrie, S. M. Pomeroy
et al., 1993 Independent variation and positive selection in env
V1 and V2 domains within maternal-infant strains of human im-munodeficiency virus type 1 in vivo. J. Virol.67:3951–3960. LeighBrown, A. J., 1997 Analysis of HIV-1 env gene sequences
re-veals evidence for a low effective number in the viral population. Proc. Natl. Acad. Sci. USA94:1862–1865.
Mansky, L. M., and H. M. Temin, 1995 Lower in vivo mutation rate of human immunodeficiency virus type 1 than that predicted from the fidelity of purified reverse transcriptase. J. Virol.69:
5087–5094.
MaynardSmith, J., and J. Haigh, 1974 The hitch-hiking effect of a favourable gene. Genet. Res.23:23–35.
McKenzie, A., and M. Steel, 2000 Distributions of cherries for two models of trees. Math. Biosci.164:81–92.
Meng, X.-L., 1994 Posterior predictivep-values. Ann. Stat.22:1142– 1160.
Moore, J. P., Y. Cao, D. D. Hoand R. A. Koup, 1994 Development of the anti-gp120 antibody response during seroconversion to human immunodeficiency virus type 1. J. Virol.68:5142–5155. Nielsen, R., and D. M. Weinreich, 1999 The age of nonsynony-mous and synonynonsynony-mous mutations in animal mtDNA and implica-tions for the mildly deleterious theory. Genetics153:497–506. Nielsen, R., and Z. Yang, 1998 Likelihood models for detecting
positively selected amino acid sites and applications to the HIV-1 envelope gene. Genetics148:929–936.
Ohta, T., 1987 Very slightly deleterious mutations and the molecu-lar clock. J. Mol. Evol.26:1–6.
Overbaugh, J., and C. R. Bangham, 2001 Selection forces and con-straints on retroviral sequence variation. Science292:1106–1109. Price, D. A., P. J. Goulder, P. Klenerman, A. K. Sewell, P. J. Easterbrooket al., 1997 Positive selection of HIV-1 cytotoxic T lymphocyte escape variants during primary infection. Proc. Natl. Acad. Sci. USA94:1890–1895.
Rambaut, A., and A. Drummond, 2004 Coalescent Generator v1.0. (http://evolve.zoo.ox.ac.uk/software.html).
Reitter, J. N., R. E. Meansand R. C. Desrosiers, 1998 A role for carbohydrates in immune evasion in AIDS. Nat. Med.4:679–684. Richman, D. D., T. Wrin, S. J. Little and C. J. Petropoulos, 2003 Rapid evolution of the neutralizing antibody response to HIV type 1 infection. Proc. Natl. Acad. Sci. USA100:4144–4149. Rodrigo, A. G., and J. Felsenstein, 1999 Coalescent approaches to HIV population genetics, pp. 233–272 inThe Evolution of HIV, edi-ted by K. A. Crandall. John Hopkins University Press, Baltimore. Ross, H. A., and A. G. Rodrigo, 2002 Immune-mediated positive selection drives human immunodeficiency virus type 1 molec-ular variation and predicts disease duration. J. Virol.76:11715– 11720.
Rouzine, I. M., A. Rodrigoand J. M. Coffin, 2001 Transition be-tween stochastic evolution and deterministic evolution in the presence of selection: general theory and application to virology. Microbiol. Mol. Biol. Rev.65:151–185.
Rubin, D., 1984 Bayesianly justifiable and relevant frequency calcu-lations for the applied statistician. Ann. Stat.12:1151–1172. Schierup, M. H., and J. Hein, 2000 Consequences of
recombina-tion on tradirecombina-tional phylogenetic analysis. Genetics156:879–891. Schmitz, J. E., M. J. Kuroda, S. Santra, M. A. Simon, M. A. Lifton
et al., 2003 Effect of humoral immune responses on controlling
viremia during primary infection of rhesus monkeys with simian immunodeficiency virus. J. Virol.77:2165–2173.
Seo, T. K., J. L. Thorne, M. Hasegawa and H. Kishino, 2002 Estimation of effective population size of HIV-1 within a host: a pseudomaximum-likelihood approach. Genetics 160:
1283–1293.
Shankarappa, R., J. B. Margolick, S. J. Gange, A. G. Rodrigo, D. Upchurchet al., 1999 Consistent viral evolutionary changes associated with the progression of human immunodeficiency virus type 1 infection. J. Virol.73:10489–10502.
Shriner, D., D. C. Nickle, M. A. Jensen and J. I. Mullins, 2003 Potential impact of recombination on sitewise approaches for detecting positive natural selection. Genet. Res.81:115–121. Shriner, D., R. Shankarappa, M. A. Jensen, D. C. Nickle, J. E. Mittleret al., 2004 Influence of random genetic drift on hu-man immunodeficiency virus type 1envevolution during chronic infection. Genetics166:1155–1164.
Strunnikova, N., S. C. Ray, R. A. Livingston, E. Rubalcabaand R. P. Viscidi, 1995 Convergent evolution within the V3 loop do-main of human immunodeficiency virus type 1 in association with disease progression. J. Virol.69:7548–7558.
Tajima, F., 1989 Statistical method for testing the neutral mutation hypothesis by DNA polymorphism. Genetics123:585–595. Thomas, P. A., J. Weedon, K. Krasinski, E. Abrams, N. Shafferet al.,
1994 Maternal predictors of perinatal human immunodeficiency virus transmission. The New York City Perinatal HIV Transmission Collaborative Study Group. Pediatr. Infect. Dis. J.13:489–495. Wain-Hobson, S., 1993 The fastest genome evolution ever
de-scribed: HIV variation in situ. Curr. Opin. Genet. Dev.3:878–883. Wei, X., S. K. Ghosh, M. E. Taylor, V. A. Johnson, E. A. Eminiet al., 1995 Viral dynamics in human immunodeficiency virus type 1 infection. Nature373:117–122.
Wei, X., J. M. Decker, S. Wang, H. Hui, J. C. Kappes et al., 2003 Antibody neutralization and escape by HIV-1. Nature
422:307–312.
Williamson, S., 2003 Adaptation in the env gene of HIV-1 and evo-lutionary theories of disease progression. Mol. Biol. Evol. 20:
1318–1325.
Williamson, S., and M. E. Orive, 2002 The genealogy of a se-quence subject to purifying selection at multiple sites. Mol. Biol. Evol.19:1376–1384.
Wilson, D. J., and G. McVean, 2006 Estimating diversifying selec-tion and funcselec-tional constraint in the presence of recombinaselec-tion. Genetics172:1411–1425.
Wolfs, T. F., J. J.deJong, H. Van denBerg, J. M. Tijnagel, W. J.
Kroneet al., 1990 Evolution of sequences encoding the
princi-pal neutralization epitope of human immunodeficiency virus 1 is host dependent, rapid, and continuous. Proc. Natl. Acad. Sci. USA87:9938–9942.
Wright, S., 1931 Evolution in Mendelian populations. Genetics16: 97–159.
Wyatt, R., and J. Sodroski, 1998 The HIV-1 envelope glycopro-teins: fusogens, antigens, and immunogens. Science280:1884– 1888.
Yang, Z., 1994 Maximum likelihood phylogenetic estimation from DNA sequences with variable rates over sites: approximate meth-ods. J. Mol. Evol.39:306–314.
Zhuang, J., A. E. Jetzt, G. Sun, H. Yu, G. Klarmann et al., 2002 Human immunodeficiency virus type 1 recombination: rate, fidelity, and putative hot spots. J. Virol.76:11273–11282.
Communicating editor: M. Nordborg
APPENDIX
Mathematical definitions of genealogy-based statis-tics for testing nonneutral evolution: Genealogical D: Given the number of sequencesn, the total length of the genealogy T, and the total length of the external branchesTe, the genealogicalDis defined as
D¼ ffiffiffiffiffiffiffiffiffiffiffiffiffiffiffiffiffiffiffiffiffiffiffiffiffiffiT anTe
uDT1yDT2
p
yD¼11 an2
bn1a2n cn n11 n1
uD¼an1yD
an¼X
n1
k¼1
1 k
bn¼
Xn1
k¼1
1 k2 cn¼2
nan2ðn1Þ ðn1Þðn2Þ:
The definitions ofyD,uD,an,bn, andcnare reproduced directly from Fuand Li(1993).
B1: Each interior node in a bifurcating genealogy is considered as the root of a subgenealogy.Mis the maxi-mum number of interior nodes between each rootiand the terminal branches. This is summed over all interior nodes, excluding the root for the entire genealogy:
B1¼
Xn2
i¼1
Colless tree imbalance Ic: For each of n 1 internal nodes in a bifurcating genealogy, sequences are parti-tioned into two groups of sizesriandsi, withri$si. Icis based on the differences betweenriandsisummed over all internal nodes:
Ic¼ 2 nðn3Þ12
Xn1
i¼1
ðrisiÞ:
Cherry count Cn:Acherryis defined simply as a pair of sequences adjacent to a single common ancestor node on the genealogy. The number of cherries gives the cherry countCn.
Testing for neutrality in serially sampled genetic sequences from a single viral population:Estimation of genealogy and demographic parameters:Two demographic models, namely constant population size and exponen-tial growth, were fitted to sequences from each patient using the BEAST program (Drummondand Rambaut 2004). This applies a Bayesian coalescent framework using MCMC, with all substitution and demographic parameters estimated from the data and values repre-sented by their marginal posterior probability distribu-tions. All priors were assumed to be uniform on a natural scale. In this way a distribution of genealogies was generated around the posterior expectation, with each genealogy associated with a vector of mutational and demographic model parameters (Drummondet al. 2002). This is referred to in the text as the ‘‘empirical’’ posterior distribution.
Model fit:The relative fit of each demographic model to the data was assessed using the AIC (Akaike 1973). The AIC of a given model is twice its marginal log likelihood plus the number of parameters specified (AIC¼2 lnLk12p). The model with the lowest AIC was selected as the best representation of the data.
Simulation of the null distribution: The posterior dis-tributions of demographic model parameters, namely the product of effective population size and generation length in days (Net) (see Rodrigo and Felsenstein 1999) and growth rater, were then used to simulate new genealogies in a neutral coalescent process. One new genealogy was produced for each genealogy in the empirical posterior distribution. This is known as pos-terior predictive simulation (Rubin 1984) and effec-tively produces a null distribution of genealogies under the coalescent model that can be compared to the em-pirical distribution in a goodness-of-fit test. This tests for violations of the assumptions made by the coalescent.
Comparison of null and empirical distributions:To test for departures from the neutral coalescent model we com-pared the ‘‘empirical’’ posterior distribution and ‘‘null’’ predicted distribution of genealogies in a goodness-of-fit test using descriptive statistics (referred to here asT). The posterior predictiveP-value is
PT ¼Pr½TðGPÞ#TðGEÞ; ðA1Þ
where T(GP) is the value of T given by a predicted
genealogy andT(GE) is that by an empirical genealogy.
PTcan be obtained using a consistent estimator as the proportion of times that the predicted genealogy yields a value ofTless than the genealogy estimated from the real data,
PT*¼1 n
Xn
i¼1
I½TðGiPÞ#TðGiEÞ; ðA2Þ
where the indicator functionI(.) takes the value 1 when its argument is true and 0 otherwise. By considering the entire distribution ofT-values,PT*accounts for the con-siderable uncertainty inherent in estimates of the true genealogy. Note that the direction of the inequality is dependent on the statistic used. Equations A1 and A2 are appropriate for the genealogicalD,B1, andCn. Selec-tion leads to a reducSelec-tion in the value of these test statistics (Table 1). Significance is therefore obtained whenPT* ,0.05. The value forIc, however, is increased by selection. In this case therefore the inequality is reversed.
The need to correct PT*-values: By convention,P-values are expected to follow a uniform distribution between 0 and 1, so that the type I error rate is equal to the chosen significance level. However, posterior predictive P-values such asP*Tare known to be conservative (Meng 1994). Intuitively, this is because the same data are used both to estimate the parameter distributions and to test the goodness-of-fit. Using the uniform distribution as a reference will therefore lead to a conservative test, and it is necessary to obtain a new reference distribution. This can be used to correct our PT*-values so that their expectation is indeed uniform.
Simulating the necessary reference distributions: New reference distributions were obtained by generating sequences using a neutral coalescent simulator. The sampling structure, length of artificial sequences, and mutational and demographic parameters were selected as representative of the patient data. Both a constant population size and exponential growth were assumed. One hundred time-structured data sets were obtained with sample times at 0, 300, 600, and 900 days and 10 sequences at each time. Artificial DNA sequences were 400 bp in length and simulated down the coalescent tree under an HKY 1 continuousG model of substitution with k ¼ 8.0, a ¼0.1, and m ¼ 4.0 3 105/site/day.
Insertions and deletions were not simulated. For a constant population size,Netwas set to 1500. For data sets simulated under exponential growth,Netwas 5000 and the growth rate 2.03103.
For each artificial sequence data set produced, aPT* -value was estimated. The distribution of these -values is shown in Figure 2, which reveals that the expectedPT* is indeed not uniform, with a paucity of extreme values.
nthe number of data points in the reference distribu-tion#PT*, then
correctedPT*¼ n11
N 12: ðA3Þ
Note that each uncorrectedP*T was obtained assuming a particular demographic model and corrected using a reference distribution generated under the same de-mographic assumption.
This procedure allowed us to apply a one-tailed 5% significance test to the correctedPT*-value generated for each test with the expectation of a 5% type I error rate.
Testing for neutrality across multiple-sequence data sets: Because correctedP*T-values follow a uniform dis-tribution between 0 and 1, they can be combined across
patients, even if obtained under different demographic scenarios. Instead of relying on individual tests of neutrality, this allows for a more powerful inference.
Combining values over all 28 patients, let
C ¼X
28
i¼1
½u1ðPTi*=2Þ2;