ABDULLAH, SAIF-AL-DIN MOHD. Numerical Study of a Reactivity Controlled Compression Ignition (RCCI) Engine using iso-octane and n-heptane. (Under the direction of Dr. Tarek Echekki).
In the modern world, the higher fuel costs and strict environmental restrictions demand
cleaner and more efficient internal combustion engines. The need for higher efficiency has put
compression ignition engines ahead of spark ignition engines. But, the higher NOx and soot
emission from CI engines requires us to look at certain in cylinder solutions that might mitigate
the problem. Reactivity Controlled Compression Ignition (RCCI) is a variant of Homogeneous
Charge compression ignition (HCCI) that provides more control over the combustion process
which promises to achieve higher fuel efficiency and lower emissions. RCCI involves the
introduction of a low reactivity fuel in the cylinder to form a well formed mixture of fuel and air
and a high reactivity fuel is injected during the compression stroke to form a stratified charge. In
this numerical study, an ODT model is used to investigate the RCCI process using iso-octane and
n-heptane as port fuel and directly injected fuel respectively. For this numerical study, a
171-species PRF skeletal mechanism with 861 elementary reactions has been employed.
In the first part of the study, a single injection strategy is used to study RCCI combustion
process. The later injection timings showed more uniform heat release than the earlier injection
timings. The injection timing change showed great potential in controlling combustion phasing at
both equivalence ratios j=0.3 and j=0.5, however, ignition was delayed at the higher equivalence
ratios. The effect of premixed ratio (PR) showed that at higher ratios, the ignition delay is
significantly increased due to the higher proportion of the low reactivity fuel, iso-octane.
In the second part of the study, the direct injection of n-heptane is split into two injections
two injections is studied. The earlier timings for both first and second injection showed more
uniform heat release and pressure rise, however showed no control over ignition and combustion
phasing for a mass split of 50/50 between injections. As 75% of the n-heptane mass is injected
during the first injection, a higher cylinder pressure is observed compared to the other cases. Also
for 75/25 mass split, the ignition timings could be controlled by both first and second injection
© Copyright 2018 by Saif-al-din Mohd Abdullah
octane and n-heptane.
by
Saif-al-din Mohd Abdullah
A thesis submitted to the Graduate Faculty of North Carolina State University
in partial fulfillment of the requirements for the degree of
Master of Science
Mechanical Engineering
Raleigh, North Carolina
2018
APPROVED BY:
_______________________________ _______________________________ Dr. Tiegang Fang Dr. Alexei Saveliev
_______________________________ Dr. Tarek Echekki
ii DEDICATION
To
iii BIOGRAPHY
Saif-al-din Mohd Abdullah was born on 7 September, 1990 in Ohio, USA. Soon after that,
he moved with his family to Dhaka, Bangladesh. He completed his O level and A level certificate
examination from Sunnydale School, Dhaka in 2007 and 2009 respectively. He then went to
Bangladesh University of Engineering and Technology (BUET) for his undergraduate studies and
earned his Bachelor of Science degree in Mechanical Engineering in November, 2015.
Saif developed an interest in combustion and engines rooting from his childhood passion
for automobiles. His undergraduate project and research work regarding an experimental study of
a diesel engine concreted his interests in engine research.
In Fall 2016, Saif enrolled as a graduate student for Master of Science in Mechanical
Engineering in North Carolina State University, Raleigh, NC. His interests in modelling
combustion in engines led him to seek Dr. Tarek Echekki as his mentor, under whose supervision,
iv ACKNOWLEDGMENTS
I would like to thank my advisor and mentor, Dr. Tarek Echekki, his help and guidance
have led to the successful completion of this thesis. I am grateful to Dr. Tiegang Fang and Dr.
Alexei Saveliev for serving as members on my advisory committee and providing their valuable
insights and suggestions.
I thank my best friends Ayaan, Saurabh, Ayaz, Richi, Pinaki, Shayan and Krystal for
everything. Also, all other friends and family for all the love and support without which completing
v
TABLE OF CONTENTS
LIST OF TABLES ... vii
LIST OF FIGURES ... viii
Chapter 1: Introduction ... 1
1.1 Reactivity Controlled Compression Ignition (RCCI) Combustion ... 2
1.1.1 Advantages of RCCI operation ... 3
1.2 Review of Literature on RCCI combustion ... 4
1.3 The One-dimensional Turbulence (ODT) Model ... 11
1.4 Objective ... 12
1.5 Overview ... 13
Chapter 2: Numerical Setup ... 14
2.1 Domain Specification ... 15
2.2 Assumptions ... 16
2.3 Species Conservation ... 18
2.4 Momentum Conservation ... 18
2.5 Energy Conservation ... 18
2.6 Constitutive Relations ... 19
2.6.1 In-cylinder Pressure Model ... 19
2.6.2 Piston Speed ... 19
2.7 Summary of ODT Equations ... 21
2.8 Numerical Implementation ... 22
Chapter 3: Single Injection Strategy ... 25
3.1 Motivation ... 25
3.2 Run Conditions ... 25
3.3 Results and Discussion ... 26
3.3.1 Effects of Injection Timing ... 26
3.3.2 Effects of Equivalence Ratio ... 34
3.3.3 Effects of Premixed Ratio ... 38
3.4 Conclusion ... 43
Chapter 4: Double Injection Strategy ... 45
4.1 Motivation ... 45
4.2 Run Conditions ... 45
4.3 Results and Discussion ... 46
4.3.1 Second Injection Timing ... 46
4.3.2 First Injection Timing ... 57
4.3.3 Effect of second injection timing for different mass splits ... 62
4.3.4 Effect of first injection timing for different mass splits ... 71
vi
Chapter 5: Summary and Future Work ... 81
5.1 Summary ... 81
5.2 Future Work ... 82
vii LIST OF TABLES
Table 2.1 The ODT RCCI Engine Model ... 21
Table 2.2 List of the common parameters used in the numerical study ... 24
Table 3.1 Run conditions used for the single injection strategy ... 26
viii LIST OF FIGURES
Figure 2.1 Schematic showing 1-D spatial domain along the bore of the engine cylinder ... 16
Figure 3.1 Heat Release plots at different Injection timings ... 28
Figure 3.2 Area heat release plots for SOI-40 and SOI-120 ... 30
Figure 3.3 Pressure plots for the different injection timings ... 30
Figure 3.4 Temperature plots at different crank angles for SOI-40 ... 32
Figure 3.5 Temperature plots at different crank angles for SOI-120 ... 33
Figure 3.6 Ignition timings for different injection timings ... 34
Figure 3.7 Pressure plots for the different injection timings at j=0.5 ... 35
Figure 3.8 Maximum pressure at different injection timings for different equivalence ratios .. 36
Figure 3.9 Heat Release plots at different injection timings for j=0.5 ... 37
Figure 3.10 Ignition timings at different injection timing for j=0.5 ... 38
Figure 3.11 Pressure plots for the different premixed ratios ... 39
Figure 3.12 Heat release plots for the different premixed ratios ... 42
Figure 3.13 Ignition delay for the different premixed ratios ... 43
Figure 4.1 Heat release plots for different second injection timings ... 48
Figure 4.2 Heat release area plots for SOI-125 CA and SOI-140 CA ... 50
Figure 4.3 Pressure plots for the different second injection timings ... 52
Figure 4.4 Maximum pressure for the different second injection timings ... 52
Figure 4.5 Ignition timings for the different second injection timings ... 54
Figure 4.6 Temperature plots for different crank angles for SOI-125 CA ... 55
Figure 4.7 Temperature plots for different crank angles for SOI-130 CA ... 56
Figure 4.8 Heat release plots for different first injection timings ... 60
Figure 4.9 Pressure plots for the different first injection timings ... 61
Figure 4.10 Ignition timings for the different first injection timings ... 62
Figure 4.11 Pressure plots for different mass splits for SOI-120 CA ... 64
Figure 4.12 Pressure plots for different mass splits for SOI-125 CA ... 64
Figure 4.13 Pressure plots for different mass splits for SOI-135 CA ... 65
Figure 4.14 Maximum pressure for different n-heptane mass percentages in first injection ... 66
Figure 4.15 Heat release plots for different mass splits for SOI-120 CA ... 68
Figure 4.16 Heat release plots for different mass splits for SOI-125 CA ... 68
Figure 4.17 Heat release plots for different mass splits for SOI-135 CA ... 69
Figure 4.18 Ignition timings for the different injection timings ... 70
Figure 4.19 Pressure plots for different mass splits for SOI-40 ... 72
Figure 4.20 Pressure plots for different mass splits for SOI-60 ... 72
Figure 4.21 Pressure plots for different mass splits for SOI-80 ... 73
Figure 4.22 Maximum pressure for different first injection mass percentage ... 74
Figure 4.23 Heat release plots for different mass splits for SOI-40 ... 75
Figure 4.24 Heat release plots for different mass splits for SOI-60 ... 76
Figure 4.25 Heat release plots for different mass splits for SOI-80 ... 77
1 CHAPTER 1
INTRODUCTION
In the modern world, the higher fuel costs and strict environmental mandates demand
cleaner and more efficient internal combustion engines. The need for higher efficiency has put
compression ignition engines in the forefront ahead of spark ignition engines. Conventional diesel
engines are known for their higher thermal efficiency but their major disadvantage is the
production off high levels of NOx and soot which have adverse effect on humans and nature [1].
To combat this problem, many after treatment methods have been used [2] but it results in
significant increase in cost. The ideal solution would be to achieve high thermal efficiencies while
maintaining low emissions.
To investigate such grounds, researchers have looked into premixed low temperature
combustion (LTC) processes like Homogeneous Charge Compression Ignition (HCCI). Since they
operate with premixed mixtures, the lower temperature of combustion results in lower levels of
NOx and longer ignition delays prevent the formation of fuel rich zones thus reducing the soot
production. However, HCCI combustion has controllability issues since it is a near constant
volume process, which limits the control over combustion phasing and, thus, results in very high
pressures and heat release rates that are undesirable for an engine. This issues prompted the
researchers to look into premixed charge compression ignition (PCCI), where the fuel is injection
in the early stages of the compression stroke thus avoiding the fuel rich zones resulting in higher
efficiencies and lower emissions [3,4]. Issues with PCCI combustion included the lack of
2 Investigations concluded the need for fuel reactivity to be controlled on a per cycle basis.
Further studies were conducted on a dual fuel process called Reactivity controlled Compression
Ignition (RCCI) combustion. This dual fuel technique involves at least two fuels of different
reactivity. The purpose is to control the cycle-to-cycle mixture reactivity and to optimize
combustion phasing. The process involves early injection of the lower reactivity fuel into the
cylinder forming a premixed mixture while the high reactivity fuel is injected before the ignition
of the high reactivity fuel in single or multiple injections resulting in a variation of fuel reactivity
across the cylinder. This concept resulted in higher fuel and thermal efficiencies than HCCI and
PCCI, in certain cases reaching almost 60%, and extremely low levels of NOx and soot emissions.
1.1 Reactivity Controlled Compression Ignition (RCCI) Combustion
Reactivity Controlled Compression Ignition (RCCI) combustion technology was first
developed in the Engine Research Center, University of Wisconsin-Madison. This concept is a
variant of Homogeneous Charge Compression Ignition (HCCI) combustion process. The HCCI
technology is highly attractive thermodynamically, however, it lacked control over the combustion
phasing, operating range and the rapid rise in pressure and temperature [7].
The basic concept of RCCI combustion process is that it controls the in-cylinder mixture
reactivity by injecting at least two fuels of different reactivity. The process results in better control
of the combustion process, smoother heat release and extremely low emissions. A low reactivity
fuel is injected as port fuel forming a pre-mixed charge of fuel, air with/without EGR. A high
reactivity fuel is injected into the cylinder later in the compression stroke using single or multiple
3 RCCI process reduced the NOx production by a factor of six, soot by a factor of three and increased
the gross efficiency by 16.4%.
1.1.1 Advantages of RCCI combustion operation-
The advantages of RCCI operation has been well documented [9, 10, 11]-
1. High Efficiency: The RCCI process promises high thermal efficiency due the ability to run
on high compression ratios. This is beneficial for fuel consumption and economy.
2. Low emission: RCCI has the potential to produce extremely low NOx and soot emissions
which is a problem for conventional compression ignition engines. It complies with the
EPA 2010 emissions guidelines without the need for after treatment.
3. Combustion phasing control: Controlling the overall reactivity of the mixture by the
injection timing, amount of each fuel, type of fuel, the combustion phasing can be
controlled.
4. Flexibility of fuel: Investigations can be made with a lot of different combinations of fuel
that would help increase the operational range and provide more control over the
4 1.2 Review of Literature on RCCI combustion
A concept called Premixed Compression Ignition (PCI) was investigated by Inagaki et al.
[12] to achieve extremely low NOx and smoke emissions, also reported by authors [3,4].
Iso-octane was injected as the port fuel while diesel was used as the high cetane fuel to trigger the
combustion process. The results showed that the ignition timings could be controlled by varying
the ratios of the two fuels. It can be inferred from the work that different fuel blends could be
required for different operating conditions of the engine that is running on high cetane number fuel
at low loads to lower cetane number fuel at higher loads.
In 2009, this dual fuel RCCI combustion process was suggested by Kokjohn et al. [9]. The
study investigated the potential of controlling the partial premixed charge compression ignition
method by injecting gasoline through the port while early direct injection of diesel to control the
combustion phasing. By using in cylinder fuel blending, the fuel reactivity can be varied cycle to
cycle in accordance to the engine load and speed. From the study, it was observed as the fuel
reactivity was decreased, the optimal combustion phasing was achieved with less EGR. As the
engine load was increased, a higher PRF was required to maintain appropriate phasing of
combustion. Though fuel reactivity could control the combustion phasing but a rapid pressure rise
was still observed, thus concluding that stratification fuel reactivity is required to control the heat
release. Combustion phasing can be controlled by fuel mixture stratification has also been
observed by Reitz et al. [10] and Mikulski et al. [11].
Benajes et al. [13] used a 1-D spray model, DICOM [14,15], and observed that RCCI
combustion is a staged process controlled by mixture fuel stratification also observed by authors
[16]. The first stage consists of the ignition of the high reactivity zone that is the premixed mixture
5 to multiple propagation flames. Splitter et al. [16] concluded that the gross efficiency of RCCI
combustion can be increased by optimizing in cylinder mixture stratification of two fuels of large
reactivity differences.
Referring to the need for fuel stratification in RCCI combustion by authors [9,13],
investigations were conducted to determine the effect of charge preparation, fuel stratification on
RCCI combustion. In 2013, Eguz et al. [17] investigated the effect of ignition timings and charge
composition using a multi zone approach with detailed kinetics. Experimental and numerical
studies showed that the ignition delay increases with earlier injections of the diesel fuel, this is
mainly because of the cooler lean zones create due to better mixing of air and fuel. Also, the greater
the proportion of gasoline fuel, the greater the ignition delay was as octane is more resistant to
auto ignition. Delvescovo et al. [18] also used ignition timings and injection pressure to control
the charge stratification and combustion phasing. The results were similar to the findings of [17]
showing that the combustion phasing advanced between SOI of -140 to -35 degrees but retarded
beyond that. While the peak gross efficiency was found to be between -60 to -45 degrees, the NOx
was seen to increase if the SOI was retarded beyond -40 degrees.
Contrary to the work by authors [17,18], Reitz et al. [19] split the direct injections into two
with 62% of the diesel mass in the first injection. By changing SOI-1 and SOI-2 in separate cases,
the effect on the cylinder pressure and combustion phasing was shown. As the first injection was
advanced, the combustion phasing is observed to retard, NOx and peak pressure reduced and CO
is seen to have increased. By retarding SOI-2 while keeping SOI-1 constant, the combustion
phasing and peak pressure is both seen to have advanced and the NOx and PM increases due to
the formation of richer regions due to later injection timings. Kokjohn et al. [9] investigated the
6 gasoline/diesel constant. It was observed that as the SOI-1 mass percentage was increased from
36% to 62%, the CO and HC remains same while NOx and PM seem to increase. Also, it can be
seen, with lower percentage, the heat release advances and shows two distinct heat release regions
while combustion phasing is seen to retard with higher mass percentage.
Besides the already proven advantage of RCCI with low emissions and heat losses, the
RCCI process has shown great potential in achieving high thermal efficiency as much as almost
60%. Splitter et al. [16] tried to observe the maximum practical cycle efficiency for RCCI
combustion process. A zero dimensional computational study was conducted and engine
experiments on a single cylinder heavy duty engine without piston oil gallery cooling was
conducted. The investigation at a constant engine load of 6.5 IMEP shows results that demonstrates
that the gross thermal efficiency can be increased by not cooling the piston, using high dilution
and in cylinder fuel dilution of combination of fuel of high reactivity differences. The optimum
result was nearly about 60% obtained in the study.
In compression ignition engines, natural gas as a fuel having a low carbon to hydrogen
ratio has been identified as a viable fuel source due to its cleaner combustion, low particle matter
and other emissions. Liss et al. [20] showed that natural gas has a cleaner combustion compared
to gasoline/diesel. In the past couple of years, a lot of studies has shown the usage of natural gas
as the low reactivity fuel in a RCCI engine. Numerous researchers [19, 21, 22, 23, 24] used natural
gas as the low reactivity fuel for RCCI combustion mode. Results showed clean, quiet and efficient
combustion in the testing range, the reduction in smoke and CO2 emissions while running a dual
fuel combustion system with natural gas and diesel. Reitz et al. [19] suggested that different
injector configurations could be investigated to further improve the natural gas/diesel RCCI
7 Kim et al. [25] showed the effect of natural gas composition on the combustion process in
an engine. Investigating RCCI combustion process, Kakaee et al. [26] concluded that the natural
gas composition with the higher Wobbe Number has a higher peak pressure, temperature and NOx
emission and considerably lower hydrocarbon and CO emissions.
Researchers [27, 28] compared two dual fuel systems, RCCI combustion to DPI
combustion process using natural gas and diesel. The study showed that RCCI has better fuel
efficiency, lower HC, CO, NOx emissions. Also, it was found that RCCI combustion is better
controlled by parameters like injection timing, intake temperature, intake pressure and EGR.
Other studies have been made using the RCCI concept using other promising alternate fuels
like alcohols, bio-diesel etc. Qian et al. [29] suggested that at higher loads, ethanol is a good
replacement for gasoline with a higher indicted thermal efficiency. Qian et al. [30] conducted
further RCCI combustion studies using diesel and different alcohols like ethanol, butanol and
n-amyl alcohol. The results showed that when the overall lower heating value per cycle is constant,
the NOx and soot emissions decrease with higher premixed ratio. Loaiza et al. [31] investigated
using hydrous ethanol as the lower reactivity fuel while using diesel as the high reactivity fuel both
injected directly into the combustion chamber of a rapid compression machine (RCM). RCM
allows studies to be made in different modes where the ethanol can be injected before/during/after
the diesel injections. For different loading conditions, injection timings and compression ratios of
16:1 and 20:1, it can be observed from the results that as the diesel fuel is being replaced, the
compression ratio has to be increased. Thus, for the increasing compression ratio, higher pressure
ratios have been observed.
Zerrakki et al. [33] also studied the ethanol RCCI process but for the high reactivity fuel,
8 50% biodiesel/50% diesel). The bio diesel primarily increases the reactivity of the diesel and
assists in combustion initiation. Results found from the investigation shows that the peak pressure
and the heat release rate have increased for all the test blends. The brake specific fuel consumption
(bsfc) value has shown an increase of about 30% mostly due to the higher mass fuel consumption
value for biodiesel. As for emissions, the NOx was seen to decrease considerably but a slight
increase in emissions for CO and HC was observed compared to a single fuel system. Li et al. [32]
also conducted a study where biodiesel was used instead of diesel fuel. The effects of gasoline fuel
ratio and injection timings were investigated. The results showed that the combustion
characteristics are less sensitive to a change in gasoline ratio at conventional injection timing (-7
aTDC) than in advanced timings (-35 aTDC).
Besides, having its advantages, methanol has a lower cetane number which means it is
more difficult to achieve auto ignition compared to diesel. Chao et al. [34] and Huang et al. [35]
used up to 18% of methanol by weigh which achieved a decrease in NOx but CO and HC increased
with methanol proportions. Li et al. [36] used RNG K-e turbulent model coupled with CHEMKIN
solver for methanol and diesel RCCI combustion mode. Results show that methanol mass fraction
and injection timings control the fuel reactivity distribution in the cylinder. It was concluded that
advancing SOI results in reduction in HC and soot emissions while improving fuel economy and
avoiding engine knock. Li et al. [37] studied the effects of methanol fraction, initial temperature,
initial pressure, EGR and SOI on RCCI combustion system run on methanol and diesel. The results
concluded that the initial temperature and EGR effect the overall performance and emissions of
the engine since they have a considerable impact on the temperature.
Zhou et al. [38] used KIVA-CHEMKIN code to study the RCCI combustion process using
9 in NOx emission under medium and high loads, also, soot emissions reduced with increased port
injection of methanol.
In 2017, Pan et al. [39] studied multi cylinder RCCI combustion using 2-butanal and diesel
in a turbocharged diesel engine. The investigation showed RCCI combustion had a higher heat
release rate and almost a 7% higher brake thermal efficiency compared to conventional combustion
mode. Also, lower NOx and particulate emissions can be achieved relative to conventional diesel
combustion process.
For almost a decade, the concept of RCCI has been tried out using different combinations
of fuel; however, a single fuel strategy using gasoline has been carried out by authors [19, 40, 41].
Reitz et al. [19] used gasoline as the low reactivity fuel and a combination of gasoline and DTBP
for higher reactivity. It was observed that the emission results were similar to that of
gasoline/diesel. It was also observed that a decreased low temperature heat release magnitude
reduced the need of compression work thus resulting in an approximate increase of 1% in gross
indicated thermal efficiency. Gross et al. [40] investigated the “single fuel” strategy by using
gasoline and EHN and comparing it to gasoline-diesel RCCI combustion. The results show that
the operating conditions need to be significantly altered for single fuel operation also the NOx
emissions are much higher than conventional gasoline-diesel RCCI operation.
Wang et al. [42] observed comparable results to gasoline/diesel RCCI emissions when
using iso-butanol/iso-butanol+DTBP as the low reactivity and high reactivity fuels respectively.
However, due to the lower reactivity of iso-butanol, a larger proportion of DTBP had to be added
to achieve the required reactivity for the direct injection. The simulations were extended to
compare with a model of HCCI, where HCCI demonstrated similar results in the lower and
10 conducted a similar study which found that a very high percentage of DTBP is required to be
compared to the results of gasoline.
Most of the studies on the RCCI concept revolved around the usage of different fuel
combinations and their impact on emissions and the efficiency, investigations have been also
conducted to find the effect of the geometry of different engine components on RCCI combustion.
Dempsey et al. [44] studied the effect of piston bowl geometry in a light duty single cylinder engine
using gasoline/diesel and methanol/diesel. The investigation was carried out in the operating range
of 1500 to 2300 rpm and IMEP of 3.5 to 17 bar. At first, the stock re-entrant piston bowl geometry
was studied showing low levels of NOx and PM emissions and obtaining a peak efficiency of
about 48%. However, at light load conditions both the fuels showed poorer combustion efficiency.
Previous studies showed that much piston induced mixing is not required as it causes further heat
losses. Thus, the authors [44] made further studies using a shallow, flat piston bowl with no squish
land. It showed better light load performances and a peak gross indicated efficiency of about 51%.
Li et al. [45] used KIVA4 and CHEMKIN to model the effect of different piston geometries on
the combustion process.
Salahi et al. [46] studied the natural gas/diesel RCCI combustion process to investigate the
introduction of the active fuel in a pre-chamber instead of the main chamber. This meant the
combustion would start at the pre chamber and the flame would then propagate to the main
chamber resulting in a secondary heat release. Due to the high temperatures in the pre chamber,
the NOx concentration was found to be relatively high. Also, complete combustion was only
achieved with higher equivalence ratios. But introducing the secondary fuel in the pre chamber
allowed the increase in the operating range of the engine in both low and high loads at lower intake
11 Though RCCI combustion can achieve high efficiency and low emissions over a wide
range of operating conditions, however, it is observed that as we want to extend the load range,
there is excessive pressure rise and soot emissions. For this reason, Wang et al. [47] investigated
the RCCI combustion strategy using gasoline as the low reactivity fuel and Polyoxymethylene
dimethyl ethers as the higher reactivity fuel. The experiment was conducted on a single cylinder
diesel engine using the late intake valve closing strategy and intake boosting. Results showed that
the RCCI strategy helped extend the load range to up to 23 bar IMEP while maintaining low levels
of NOx/soot emissions. Also, the stoichiometric combustion allows the use of a three-way catalytic
converter to further reduce the HC and CO emissions.
1.3 The One-dimensional Turbulence (ODT) Model
Turbulent combustion is a complex phenomenon which comprises of two distinct scenarios
occurring over the same time period, which are chemical reactions and fluid mixing. While some
of the earlier traditional models in turbulent combustion relied on the separation of scales between
mixing and chemistry, this assumption is not valid for a wide range of combustion processes [48].
Another challenges of capturing the coupling between turbulent mixing and chemistry is the
inherent multi-dimensionality of turbulent flows.
In 1991, Kerstein [49] developed the linear eddy model (LEM) which could resolve in 1D,
advection, scalar, momentum transport, chemistry in both length and time scales while
successfully predicting the coupling of turbulent mixing and chemical kinetics. A stochastic
method was used in the model to determine the turbulent advection part which meant using a
12 [50]. The model also used deterministic processes for solving the diffusive and reactive parts of
the governing equations.
Kerstein [51] extended LEM to formulate the One Dimensional Turbulence (ODT) Model.
The ODT Model is capable of solving for velocity vectors, which provides crucial details about
the shear fields which drives the turbulence. The ODT is a turbulence model which can on its own
solve for simple flow problems making it ideal for its application in problems like RCCI.
The One-dimensional Turbulence (ODT) Model is a stand-alone model which can resolve
all time and length scale in one dimension. It has been used in numerous works as a stand-alone
ODT model [52, 53, 54]. In 2012, authors [56, 57] investigated hydrogen-fueled HCCI operation
using an ODT model formulated for engine operations.
The ODT model being a stand-alone model can effectively study the turbulent flows in a
RCCI engine. This would provide us with significant insight into the turbulence-chemistry
interactions in a RCCI engine and compare the cases for different operational parameters.
1.4 Objective
A One-Dimensional Turbulence (ODT) model is used to model the turbulent-reacting
mixture in a RCCI engine using iso-octane and n-heptane as fuels. The purpose of this investigation
is to study the single and double injection strategies for the direct injection and understand how
13 1.5 Overview
This thesis is presented in five chapters. The first chapter introduces the RCCI technology
and literature review for the process, then provides a brief description of the One-Dimensional
Turbulence (ODT) model and how it is suitable for simulation of the RCCI combustion process.
The second chapter provides the mathematical model that is used to simulate the RCCI engine
operation. It also provides a description of how the model was numerically implemented for the
process. The third chapter investigates the single injection strategy for the RCCI process for the
different run conditions presenting the results, discussion and conclusions. The fourth chapter
studies the double injection strategy for the diesel fuel for the different operating conditions and
how it effects the combustion characteristics which is presented in the results and discussion. The
important conclusions from this study and the scope for future works has been presented in chapter
14 CHAPTER-2
NUMERICAL SETUP
In this chapter, the model formulated for the simulation of the one dimensional turbulence
in the engine cylinder working under the Reactivity controlled compression ignition (RCCI)
conditions is discussed. Echekki et al. [57] and Ashurst et al. [58] have provided many fundamental
formulations for the ODT model; however, for this study, to correctly account for the varying
spatial domain with time, a re-formulation is required. This is accounted for in the study of HCCI
engines by Gowda et al [55, 56]. While the ODT formulation for the turbulent-reacting flow
developed by Echekki et al. [57] was used as the standard for the model, a few variations are made
by the authors. Firstly, due to the compression and expansion of the domain, the mixture density
is allowed to change in a pseudo-steady manner. Secondly, to account for the boundary work,
another term is added to the energy equation.
In the model developed by Gowda and Echekki [55, 56] which is used as the basis for this
study, it has been assumed that the flow is a low-Mach number, variable density flow. In this
formulation, the density is allowed to vary with compression and expansion, however, the Mach
number is kept low enough to be consider the flow incompressible (i.e. not requiring a separate
continuity equation or an account for the pressure waves). Another important assumption for this
model is that there is no axial variation of the velocity, species concentrations and temperature
while attempting to capture the direction of most variations (at least statistically) for these
quantities.
The thermo-physical parameters, the density and velocity changes with the temperature,
pressure, the domain length and evolving composition as time progresses. The overall energy
15 calculate the species concentrations. The momentum equation is used to calculate the velocity. The
ideal gas equation of state and the mass conservation equation is used to update the density and
thermodynamic pressure. This chapter discusses the assumptions used for the model, the derivation
of the governing reaction-diffusion equations, the simplification of the model and finally the
implementation of the ODT model for the RCCI combustion process.
2.1 Domain Specification
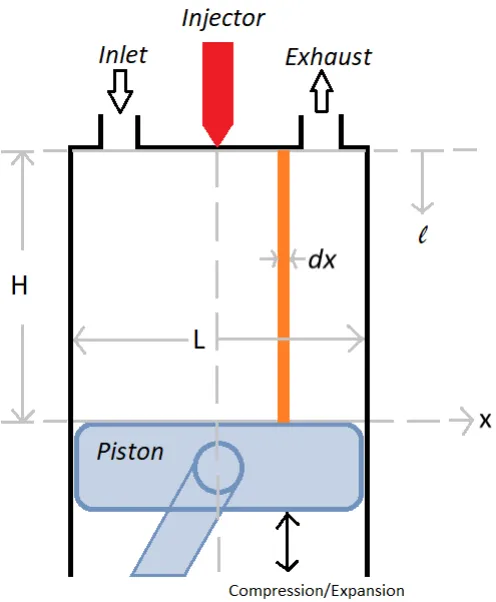
The 1-D domain as shown in Fig. 1 is chosen in the lateral direction perpendicular to the
motion of the piston. The domain is divided in to smaller differential elements dx of uniform
cross-sectional area. The length of the domain dx is kept constant for all the realizations. It is
assumed that each differential elements have uniform properties in the axial direction. For the
purpose of modelling the varying volume due to the compression and expansion stroke, a
variable l is defined in the axial direction which is updated to realize this variation. The choice
of a domain like this helps simplify the flows and a reasonably realistic method to implement the
other engine operations like injections and a moving boundary. To model the fuel injection, the
fuel composition associated with each differential element (dx) is adjusted at the position where
the injection is desired. The size of the injector nozzle is assumed to be the same size as the
length of each differential element (dx). The desired fuel to air mass ratio defines the length of
16 Figure 2.1 Schematic showing 1-D spatial domain along the bore of the engine cylinder
2.2 Assumptions
The following assumptions are made for the derivation of the governing equations:
1. The total mass remains constant for the compression and expansion strokes of the engine.
This is based on the assumption that for modelling purposes, the intake occurs before the
start of the compression stroke and the exhaust occurs after the completion of the
expansion stroke.
2. It is assumed that the cylinder charge is completely gaseous and contains no particulate
17 3. The gaseous mixture in the cylinder is assumed to be an ideal gas since the range of
pressure and volume encountered in the cylinder does not cause much deviation from the
ideal gas behavior.
4. The piston head is considered to be completely flat for all the runs.
5. The cross-sectional area for the cylinder is taken to be uniform and fixed for all the runs.
6. A variable density incompressible flow condition is assumed and no spatial pressure
gradients exists.
7. It is assumed that there is no net mass transport due to diffusion. The diffusion for each
species is such that, when summed over all the species, it is zero.
8. Since the 1-D domain is chosen in the lateral direction and perpendicular to the line of
action of gravity. And since all properties in the axial direction is considered uniform, it is
also assumed there is no effect of gravity.
9. The gas mixture is modelled as a Newtonian fluid.
10. The heat flux due to the Dufour effect is neglected.
11.It is assumed that there is no heat transfer in the axial direction through the cylinder head
and piston and are considered adiabatic. The cylinder wall is assumed to be at constant
temperatures and works as heat sinks.
12.The model has been derived from reaction and diffusion components and thus the
advection terms have been neglected. The advection terms are implemented independently
18 2.3 Species Conservation
In the mixture, for each species, the component mass balance is obtained by equating the
accumulation of species ‘k’ to the mass flow rate due to bulk flow, the mass flow rate due to
diffusion and the mass flow rate due to reaction. This is applicable to all species including
reactants, intermediates and products.
𝜕𝑌# 𝜕𝑡 = − 1 𝜌 𝜕 𝜕𝑥 𝜌𝑌#𝑉# + 1 𝜌𝜔#
2.4 Momentum Equation
The conservation of momentum is applied over each differential length (dx) to characterize
the fluid velocity. Newton’s 2nd law of motion is used to find the rate of change of momentum
represented as 𝑣. The rate of generation of momentum for each element is calculated by the forces
acting on the material in each element. The forces include local pressure forces, viscous forces and
the gravitational forces.
The simplified differential equation for the velocity field (u) for the cylinder,
𝜕𝑢 𝜕𝑡 = 1 𝜌 𝜕 𝜕𝑥(𝜇 𝜕𝑢 𝜕𝑥)
2.5 Energy Conservation
According to the 1st Law of thermodynamics, the rate of change of energy is equal to the
sum of all the factors that add or remove energy from the system. In a gaseous mixture, energy
transport occurs through heat transfer due to diffusion, conduction, chemical reaction and
boundary work due to motion of piston.
34 35 = 6 789 3 3: 𝜆 34 3: − 6 789 3
3: 𝜌#𝑉#𝐶=,#𝑇 − 6
789 ℎ#𝜔# A
#B6 A
19 Initial conditions: 𝑇 0, 𝑥 = 𝑇J 𝑥 ∀ 𝑥 ∈ [−NO,NO]
The boundary conditions are depended on the kind of walls being modelled. For a
constant temperature wall, a Dirichlet boundary conditions is used.
Dirichlet boundary conditions: 𝑇 𝑡, −NO = 𝑇PQGG 𝑎𝑛𝑑 𝑡,NO = 𝑇PQGG 𝑓𝑜𝑟 𝑡 > 0
2.6 Constitutive Relations
2.6.1 In-Cylinder Pressure Model
The cylinder pressure is characterized by the following equation,
𝑃4 = 𝜌𝑅[𝑇
𝑀 =
𝐴^_ 𝜌𝑅𝑀[𝑇 𝑑𝑥
𝑉5`5QG
As per the assumption that the overall mass of the system remains constant since the intake
happens before the compression stroke and the exhaust occurs after the expansion stroke, the
overall density of the mixture can be calculated as,
𝜌 =𝑚5`5QG 𝑉5`5QG
where 𝑚5`5QGis a function of the initial density and the initial volume.
𝑚5`5QG = 𝜌`𝑉`
2.6.2 Piston Speed
For this model, the Top Dead Center (TDC) is considered as a reference point and the
cylinder head as the origin, then the total instantaneous volume inside the cylinder is,
20 where, 𝑙c`F is the length of the connecting rod, 𝑎 is the crank radius, 𝑙dFce is the instantaneous
distance between the crank axis and the piston pin axis, 𝐴^_ is the surface area of the piston head
and 𝑉^ is the clearance volume.
If the system is considered a slider-crank mechanism, the instantaneous distance between the crank
and piston pin can be expressed as:
𝑙dFce= 𝑎 cos 𝑣𝑡 + (𝑙c`FO− 𝑎O𝑠𝑖𝑛O 𝑣𝑡 )6O
where 𝑣 is the angular speed of the crank, v=2pN (N= Engine RPS)
The piston speed can be obtained by differentiating with time,
𝑑𝑙dFce
𝑑𝑡 = −𝑎 𝑣 sin 𝑣𝑡 −
𝑎O𝑣 sin 𝑣𝑡 cos (𝑣𝑡)
(𝑙c`FO − 𝑎O𝑠𝑖𝑛O 𝑣𝑡 ) 6 O
Defining stroke length (𝐻_5c`#n), mean piston speed (𝑆=) and the ratio of connecting rod length
to the crank radius (𝑅) as:
𝐻_5c`#n = 2𝑎
𝑆= = 2𝑁𝐻_5c`#n
𝑅 =𝑙c`F 𝑎
Therefore, the piston speed as a function of time,
[𝑑𝑙
𝑑𝑡]dFce= − 𝜋
2𝑆=sin 𝑣𝑡 [1 +
cos(𝑣𝑡)
(𝑅O− 𝑠𝑖𝑛O 𝑣𝑡 )6O
The negative sign on the right hand side of the equation is there because the simulation starts
21 2.7 Summary of ODT Equations
The ODT equations used for this model has been summarized in Table 2.1. A stochastic
term (W) has been added to the equations to account for the turbulent advection which has been
further discussed in Section 2.8.
Table-2.1 The ODT RCCI Engine Model
Species 𝜕𝑌#
𝜕𝑡 = − 1 𝜌 𝜕 𝜕𝑥 𝜌𝑌#𝑉# + 1
𝜌𝜔#+W#
Momentum 𝜕𝑢
𝜕𝑡 = 1 𝜌 𝜕 𝜕𝑥 𝜇 𝜕𝑢
𝜕𝑥 +W[
Energy Initial Boundary 34 35 = 6 789 3 3: 𝜆 34 3: − 6 789 3
3: 𝜌#𝑉#𝐶=,#𝑇 − 6
789 ℎ#𝜔# A
#B6 A
#B6 −
CD 789[
FG
F5]bdry+W4
𝑇 0, 𝑥 = 𝑇J 𝑥 ∀ 𝑥 ∈ [−𝐿 2,
𝐿 2]
Dirichlet boundary conditions (constant temp.):
𝑇 𝑡, −𝐿
2 = 𝑇PQGG 𝑎𝑛𝑑 𝑡, 𝐿
2 = 𝑇PQGG ∀
𝑡 > 0
Constitutive
Relations 𝑃4=
𝜌𝑅[𝑇 𝑀 = 𝐴^_ 𝜌𝑅[𝑇 𝑀 𝑑𝑥 𝑉5`5QG [𝑑𝑙
𝑑𝑡]dFce= − 𝜋
2𝑆=sin 𝑣𝑡 [1 +
cos(𝑣𝑡)
(𝑅O− 𝑠𝑖𝑛O 𝑣𝑡 )6O
22 2.8 Numerical Implementation
The One-dimensional Turbulence (ODT) model numerically implements the governing
equations provided in Section 2.7. Solving the governing equations requires splitting them into
two parts. The temporal section requires complete separation of the diffusion and reaction. The
diffusive section is solved by using the central diffusive scheme to update the 1-D spatial domain.
First-order forward Euler method is used to advance the diffusion while the reaction source term
is directly integrated by using stiff-integrator, DVODE [59]. The CHEMKIN II suite [61] includes
the transport libraries [60] to compute the mixture-averaged transport properties for heat and mass
transfer.
A ‘triplet map’ for each stirring event is used to stochastic implementation of turbulent
advection. These ‘triplet maps’ are capable of replicating the compressive strain and rotational
folding effects which are characteristic to eddy events. The segments are randomly selected of
length 𝐥 and the left boundary at 𝐱. Therefore, in the 1-D scalar field, the triplet map is applied to
the eddy span of range ë𝐱, 𝐱 + 𝐥û.
The rearrangement of the selected 1-D profile is achieved by the replacement of the length
𝐥, with three identical copies compressed to one-third its original length. To maintain continuity of
the values in the new profile, the copy is places in the middle and inverted.
To modulate the location and frequency of stirring events, the shear rate is calculated using
the velocity component of the scalar field in the 1-D domain. An ‘eddy rate distribution’ is
calculated by assigning a time scale to every possible transport event at a given instant. This is
used to find the frequency. The model consists of two adjustable parameters A and b of order
23 On the other hand, b, forms a relationship between the eddy characteristic time to the elapsed
temporal evolution of the domain.
Blends of hydrocarbons e.g. primary reference fuel (PRF) is often used to represent
different commercial fuels. In this study, iso-octane and n-heptane has been used as surrogates for
gasoline and diesel respectively. Many numerical investigations have been conducted on RCCI
combustion process using PRF [29, 30, 70]. For this numerical study on RCCI, a 171-species PRF
skeletal mechanism with 861 elementary reactions has been employed developed by authors [62].
This skeletal mechanism was developed from a detailed Lawrence Livermore National Laboratory
(LNLL) mechanism with 874 species and 3796 elementary reactions [63, 64]. The skeletal
mechanism was developed by employing DRG with expert knowledge [67, 68] and isomer
lumping method [69]. The laminar flame speed results have been compared and validated with
24 Table-2.2 List of the common parameters used in the numerical study
Parameter Value/Range Units
Equivalence Ratio (f) 0.3-0.5 -
Compression Ratio (CR) 16 -
Engine RPM 1300 rev/min
Cylinder bore 8.2 cm
Cylinder stroke 8.2 cm
Connecting rod length/Crank Radius (R) 2 -
Manifold Pressure 1 atm
Gasoline Fuel Temperature 650 (376.85) K (°C)
Diesel Fuel Temperature 850 (576.85) K (°C)
Injection Velocity 1000 cm/s
Oxidizer Temperature 650 (376.85) K (°C)
No. of fuel injectors 1-3 -
Wall type Isothermal -
Wall temperature 350 (76.85) K (°C)
A list of the common engine operating parameters have been presented in Table 2.2. A
change in a one or a combination of the parameters effects the mixing and combustion process.
The problem setup and the run conditions for each case studied have been presented in their
respective chapters. All simulation has been conducted on Intel Core i7 CPU with @3.2 GHz
25 CHAPTER 3
SINGLE INJECTION STRATEGY 3.1 Motivation
In this study, an ODT model is used to understand the combustion process of RCCI
technology and how the combustion characteristics vary with different engine parametrical
changes using the single injection strategy. Also, comparisons are provided between the different
cases studied in this section. The major parameters that have investigated in the present study, are
the effects of change in injection timing, equivalence ratio and premixed ratio.
3.2 Run Conditions
In order to study the effects on the combustion characteristics of a RCCI engine using
iso-octane and n-heptane as the port fuel and the direct injected fuel respectively, in the first section,
the injection timings for the single injection is varied while keeping all other operating parameters
constant. In the second section, the same injection timings are used to study the effects of different
equivalence ratio. And in the final section, the premixed ratio is changed and runs are made for
the same injection timings used in the previous sections. The common run conditions have been
26 Table-3.1 Run conditions used for the single injection strategy
Parameter Value/Range Units
Equivalence Ratio (f) 0.3-0.5 -
Compression Ratio (CR) 16 -
Engine RPM 1300 rev/min
Direct Injection Timing 40-120 CA
Total injection time 5 CA
Premixed Ratio (%) 50-90
Cylinder bore 8.2 cm
Cylinder stroke 8.2 cm
Connecting rod length/Crank Radius (R) 2 -
Manifold Pressure 1 atm
Fuel (iso-octane) Temperature 650 K
Fuel (n-heptane) Temperature 850 K
Injection Velocity 1000 cm/s
Oxidizer Temperature 650 K
Wall type Isothermal -
Wall temperature 350 K
3.3 Results and Discussion 3.3.1 Effects of Injection Timing
In this section, the mixing and combustion process for a RCCI engine using single injection
strategy is studied. A single injection method is used for the directly injected fuel and a sweep of
the injection timings is made from 40 CA to 120 CA into the compression stroke, keeping other
parameters constant as presented in Table 3.1. The equivalence ratio for all the cases studied is
kept constant at j=0.3. When the n-heptane is injected into the cylinder, it vaporizes and is
entrained with the air and iso-octane. This was observed in investigations by Benajes et al. [13].
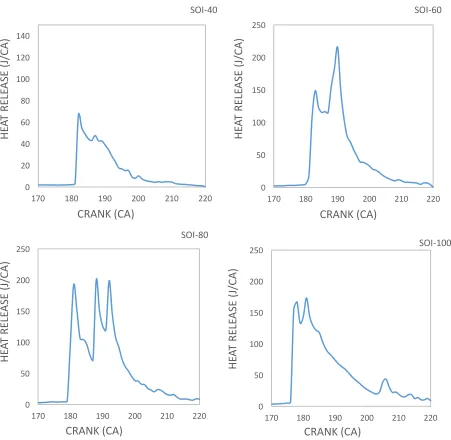
27 compression stroke [11,18]. From Fig. 3.1, it is observed that when the n-heptane is being injected
at an earlier timing i.e. 40 CA in the compression stroke, the mixing time is significantly higher
forming an almost homogeneous mixture similar to HCCI combustion with a lower equivalence
ratio than the other cases i.e. the resulting mixture is leaner and has a lower reactivity. The heat
release curve for the case shows due to the less reactive mixture, the initial heat release is much
lower. Also, the different pockets of almost homogeneous mixture ignite almost simultaneously in
peaks of similar magnitude which results in the heat release occurring in a much shorter interval
when compared to the other cases. Since, the mixture formed is near HCCI-like, the disadvantage
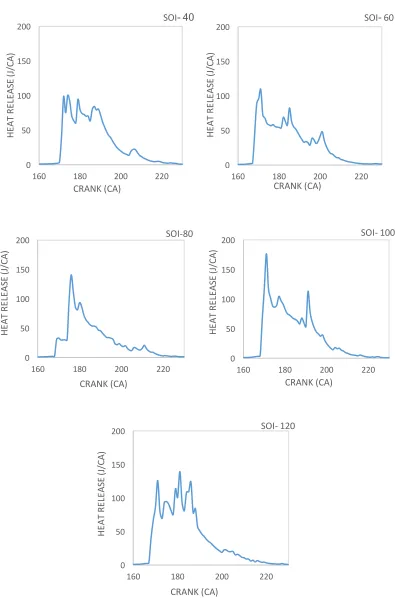
28 Figure 3.1 Heat release plots at different Injection timings
0 50 100 150 200
160 180 200 220
HE AT R EL EA SE (J /C A) CRANK (CA)
SOI- 40
0 50 100 150 200
160 180 200 220
HE AT R EL EA SE (J /C A) CRANK (CA)
SOI-60
0 50 100 150 200
160 180 200 220
HE AT R EL EA SE (J /C A) CRANK (CA) SOI-80 0 50 100 150 200
160 180 200 220
HE AT R EL EA SE (J /C A) CRANK (CA) SOI- 100 0 50 100 150 200
160 180 200 220
29 As the injection timing is delayed, a staged combustion process is evident, which is more
characteristic of a RCCI combustion process. The later injection means lower mixing time for the
n-heptane; therefore, a highly reactive zone with high local equivalence ratio is produced where
the proportion of the high reactivity fuel is much higher. Also, in the other parts of the cylinder,
zones with lower local equivalence ratios are produced with the diesel entrained in gasoline and
air. Therefore, the result is a stratified charge with varying reactivity across the cylinder. The heat
release curve for SOI-80, shows an initial peak for the combustion of the high reactivity zone with
the ignition of the diesel fuel. This ignites the leaner zones designated by the higher heat release
curve since the fuel mass is much higher. And finally, small peaks can be observed afterwards
which are results of flame propagation and the ignition of different pockets of lean zones. Similar
results were shown by Nazemi et al. [71].
However, when the injection timing is further retarded to SOI-100, a much higher initial
peak is observed. This is because the late injection timing means a small mixing time for the diesel
fuel and a higher mass of the fuel in the richer zone resulting in the higher heat release. The higher
heating value for diesel also contributes to the higher initial heat release.
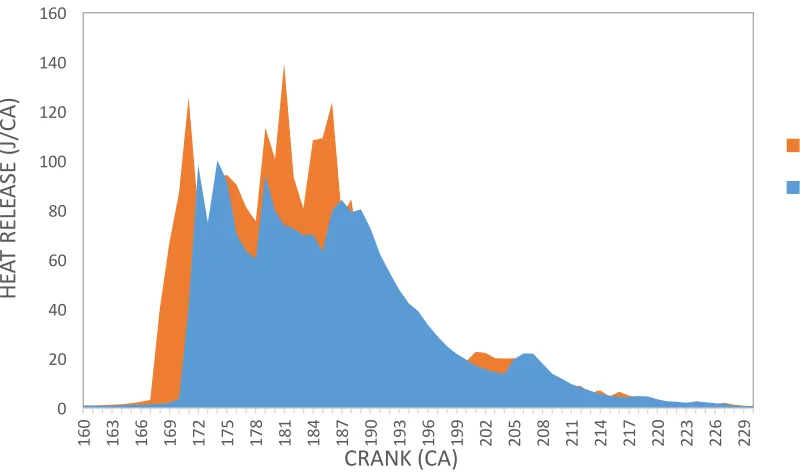
It can be concluded that as compared to rapid heat release for HCCI combustion process,
the heat release for RCCI combustion is much more uniform as it is a staged combustion process
which is beneficial for the engine. This is further observed by comparing the area curve (Figure
3.2) for the heat release for the cases of SOI-40 and SOI-120. The case for SOI-120 shows multiple
peaks for heat release over a wide range of crank angle rotations while for SOI-40 which almost
produces an almost homogeneous mixture due to the early injection timing shows that most of the
30 Figure 3.2 Area heat release plots for SOI-40 and SOI-120
Figure 3.3 Pressure plots for the different injection timings 0 20 40 60 80 100 120 140 160
160 163 166 169 172 175 178 181 184 187 190 193 196 199 202 205 208 211 214 217 220 223 226 229
H EA T RE LE AS E (J /C A) CRANK (CA) SOI-120 SOI-40 0 10 20 30 40 50 60 70 80 90
150 160 170 180 190 200 210 220 230
31 In figure 3.3, it can be observed that as the injection timing is retarded from 40 CA to 120
CA, the maximum pressure is seen to increase correspondingly. This is because, with the late
injection time, the mixing time is much lower and this results in a high reactivity mixture which
leads to rapid heat release when ignition takes place and results in the higher pressure rise. For
earlier injections, a lower equivalence ratio is achieved and the heat release is more uniformly
distributed resulting in a lower maximum pressure rise.
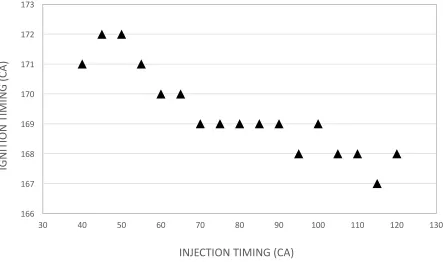
Also, the ignition timings for the different start of injection (SOI) cases can be observed
from figure 3.3. The ignition timings have been identified by the observation of the first rapid rise
in pressure in the figure. Also, the exact crank angle for the ignition can be identified by studying
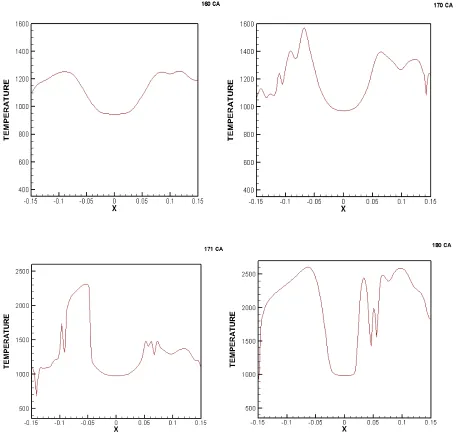
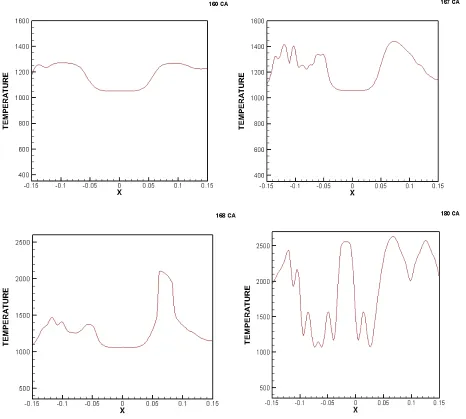
the temperature profiles at each crank angle. The cases for SOI-40 and SOI-120 has been presented
in the figures 3.4 and 3.5 where the temperature profiles have been provided for crank angles
representing before ignition, during ignition and after ignition. It can be observed from the
temperature profiles that a rapid rise in temperature occurs when ignition takes place, unlike the
uniform rise in temperature which is observed before due to compression. Further simulation runs
have been made including cases for other injection timings between 40 CA and 120 CA and an
ignition map has been presented in figure 3.6. Eguz et al. [17] found similar results when the
injection timing was delayed from 90 CA to 120 CA, the ignition timing advanced
34 Figure 3.6 Ignition timings for the different injection timings
3.3.2 Effects of equivalence Ratio
In this section, the effects of the equivalence ratio on the combustion characteristics is
presented. The two cases for equivalence ratios that are studied are j=0.3 and j=0.5. All other
engine operating parameters are kept constant as presented in Table 3.1.
Figure 3.7 shows the pressure plots for the different injection timings for an equivalence
ratio of j=0.5. It is observed that with a delay in the injection timing, the maximum cylinder
pressure rises. This is similar to the trend observed for an equivalence ratio of 0.3. With the delay
of injection, the overall reactivity of the mixture would be higher because of lower mixing time
and thus a higher pressure is achieved. However, if the pressure plots for j=0.3 in Fig. 3.3 is
compared to the pressure plots for j=0.5 in Fig. 3.7, it can be observed that the maximum pressure
is reached at a later crank angle for all the cases studied. The reason behind this is the higher 166
167 168 169 170 171 172 173
30 40 50 60 70 80 90 100 110 120 130
IG
N
IT
IO
N
T
IM
IN
G
(C
A)
35 amount of fuel for j=0.5 requires higher mixing time with air and iso-octane. Thus, the maximum
pressure achieved is at a much later timing for j=0.5.
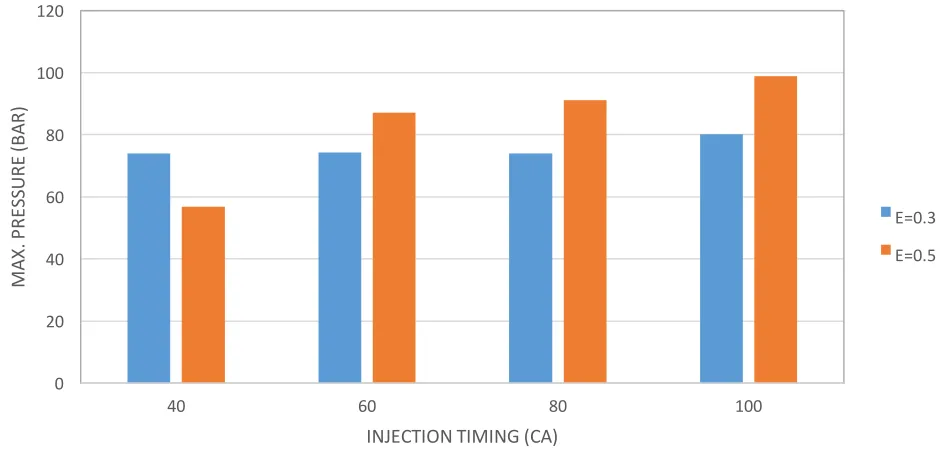
Figure 3.8 shows the sensitivity of maximum cylinder pressure to the change in injection
timing differs between the cases presented for j=0.3 and j=0.5. It can be inferred that the cylinder
pressure for the equivalence ratio of 0.5 is more sensitive. This is because, at a higher equivalence
ratio, the proportion of fuel to air is higher than the other cases presented. Therefore, a small change
in the injection timings causes a significant change in the maximum cylinder pressure achieved.
Also, in Fig. 3.8, it is observed that for the injection timings of 60 CA, 80 CA and 100 CA, the
maximum pressure for j=0.5 is much higher than j=0.3. This is the result of the higher amount
of fuel that is being injected due to the higher equivalence ratio.
Figure 3.7 Pressure plots for the different injection timings at j=0.5. 0
20 40 60 80 100 120
140 150 160 170 180 190 200 210 220
PR
ES
SU
RE
(B
AR
)
CRANK (CA)
SOI-40
SOI-60
SOI-80
36 Figure 3.8 Maximum pressure at different injection timings for different equivalence ratios
Figure 3.9 shows the heat release plots for the different injection timings for an equivalence
ratio of j=0.5. It can be observed that the initial heat release for the cases of j=0.5 has much
higher value compared to the cases for j=0.3 presented in Fig. 3.1. Also, the peaks of the heat
release are much higher for j=0.5 than for j=0.3. The reason for both of this observation is that
with a higher equivalence ratio, a larger amount of fuel is being injected. Therefore, the overall
heat release increases.
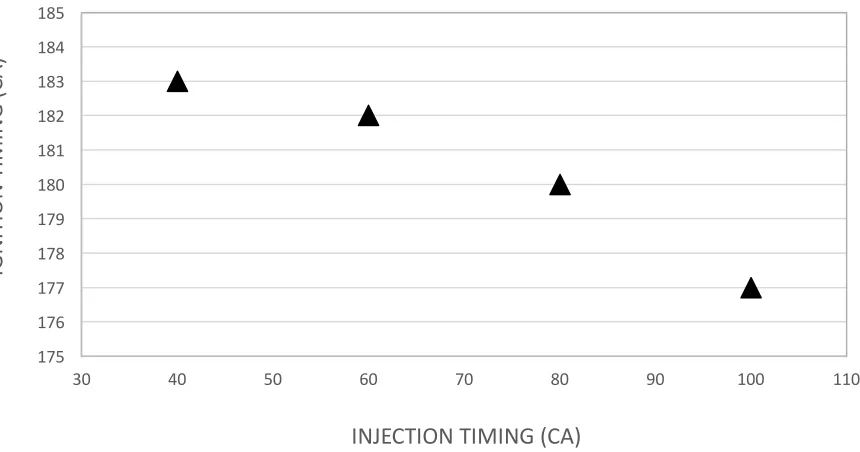
For an equivalence ratio of j=0.5, the ignition timings for the different injection timings is
presented in Fig. 3.10. The ignition timings have been identified in a similar manner as observed
in Figs. 3.4 and 3.5. It is evident from Fig. 3.10 that, with the delay of the injection timing, the
ignition timing advances. This is because with the delay in injection timing, the mixing time
decreases. Thus, the n-heptane does not get enough time to mix with the air and iso-octane. Since,
n-heptane is the higher reactivity fuel used for this study, the overall reactivity increases with lower
mixing time. Therefore, the mixture is more prone to ignition at an earlier timing with later 0
20 40 60 80 100 120
40 60 80 100
MA
X.
P
RE
SS
U
RE
(B
AR
)
INJECTION TIMING (CA)
37 injection. Similar results were observed for an equivalence ratio of j=0.3 presented in Section
3.3.1. However, compared to the case for j=0.3, the ignition seems to occur at a much later timing
for the same injection timings. This is because due to the higher proportion of fuel for j=0.5, it
takes more time for the fuel to mix with the air and ignite.
Figure 3.9 Heat Release plots at different injection timings for j=0.5. 0 20 40 60 80 100 120 140
170 180 190 200 210 220
H EA T RE LE AS E (J /C A) CRANK (CA) SOI-40 0 50 100 150 200 250
170 180 190 200 210 220
H EA T RE LE AS E (J /C A) CRANK (CA) SOI-60 0 50 100 150 200 250
170 180 190 200 210 220
H EA T RE LE AS E (J /C A) CRANK (CA) SOI-80 0 50 100 150 200 250
170 180 190 200 210 220
38 Figure 3.10 Ignition timings at different injection timing for j=0.5.
3.3.3 Effects of Premixed Ratio
In a RCCI combustion process, the iso-octane is injected as port fuel and forms a premixed
mixture with air. The n-heptane is injected through direct injection at a specified crank angle during
the compression stroke to mix with the already premixed iso-octane and air and forms a stratified
mixture [8,11]. In this section, the timing of injection for the direct injected fuel is at 80 CA and
using an equivalence ratio of j=0.3 for all the cases studied, the premixed ratio is changed and its
effect on the combustion characteristics of RCCI combustion process has been studied. Premixed
ratio can be defined as the ratio of the iso-octane in the total fuel injected both as port fuel and
directly injected. 175
176 177 178 179 180 181 182 183 184 185
30 40 50 60 70 80 90 100 110
IG
N
IT
IO
N
T
IM
IN
G
(C
A)
39 Figure 3.11 Pressure plots for the different premixed ratios
In Figure 3.11, the pressure curves for the different premixed ratios have been plotted
against the crank angle. It can be observed that as the premixed ratio is increased from 50% to
90%, the start of ignition is retarded. The start of ignition can be identified by the point of rapid
rise in pressure in the pressure curves, also by identifying the first rapid rise in heat release on the
curves presented in Fig. 3.12. To further study the case, the ignition delay for each case can be
calculated by the difference in crank angles between the injection of n-heptane which is constant
for every case at 80 CA and the point of ignition. The results are presented in Fig. 3.13 where the
ignition delay is plotted against the premixed ratio. It can be observed from the plot that as the
premixed ratio is increased, the ignition delay increases correspondingly. This is mainly because
iso-octane has a comparatively higher auto ignition temperature compared to n-heptane, so it is 0
10 20 30 40 50 60 70 80 90 100
150 160 170 180 190 200 210 220 230
PR
ES
SU
RE
(B
AR
)
CRANK (CA)
40 more resistant to ignition. Therefore, the increase in premixed ratio means that the amount of
iso-octane in the mixture compared to n-heptane is much higher. As a result, the overall mixture
becomes more resistant to ignition as the premixed ratio increases and the result is observed on the
heat release curve with the premixed ratio of 90% ignites the latest.
In Fig. 3.12, it is observed for the curve of PR-50% that the heat release starts at an earlier
timing than the other ratios, also the peaks are no that high comparatively and the heat is released
over a uniform time towards the end of the compression stroke and the start of the expansion
stroke. The early start to heat release is due to the higher percentage of n-heptane which have a
much lower auto ignition temperature thus the overall mixture has a higher reactivity. Therefore,
the mixture combusts at an earlier time. Then, a series of heat release peaks is observed which is
due to the flame propagation and the ignition of the other pockets of iso-octane, n-heptane and air.
However, for the cases of PR-60% and PR-70%, the staged combustion process is more
evident which is more typical of RCCI combustion process. A low initial heat release peak is
observed which infers the ignition of the high reactivity zone of the stratified mixture and then a
series of higher magnitude peaks is produced for the combustion of the other pockets of leaner
mixture.
The heat release curves for PR-80% and PR-90%, are unlike the other ratios as they have
a much higher initial heat release. In both the cases, the characteristic staged combustion of RCCI
combustion process is not evident. The heat release is much higher and the rate of release is
extremely high. This corresponds to the rapid rise in pressure and the higher maximum pressure
for both the case observed on the pressure plots. Also. The peaks for the maximum pressure are
reached at a later crank angle than the other ratios, this is because of the late ignition of the mixture
41 characteristic for engine knocking where pockets of fuel and air mixture explodes instead of
combustion occurring through flame propagation. So, here the low reactivity mixture produced
due to higher percentage of iso-octane resists ignition to the stage where the rise in pressure and
temperature due to compression causes the different pockets of the stratified mixture to explode.
This also explains the absence of an initial low peak for heat release due to the ignition of the fuel
air mixture. This phenomenon of knocking is undesirable for the engine as it produces unwanted
42 Figure 3.12 Heat release plots for the different premixed ratios
0 10 20 30 40 50 60 70 80
150 170 190 210 230
HE AT R EL EA SE (J /C A) CRANK (CA) PR-50% 0 20 40 60 80 100 120 140 160
150 170 190 210 230
HE AT R EL EA SE (J /C A) CRANK (CA) PR-60% 0 20 40 60 80 100 120
150 170 190 210 230
HE AT R EL EA SE (J /C A) CRANK (CA) PR-70% 0 50 100 150 200 250 300
150 170 190 210 230
HE AT R EL EA SE (J /C A) CRANK (CA) PR-80% 0 20 40 60 80 100 120 140 160 180 200
150 170 190 210 230
43 Figure 3.13 Ignition delay for the different premixed ratios
3.4 Conclusions
The following conclusions can be drawn from the study of the single injection strategy for
RCCI combustion process-
1. With the single injection strategy, a later injection timing resulted in a more uniform heat
release compared to an earlier timing. This is important in keeping the cylinder
temperatures lower which is a deterrent to NOx production.
2. Investigations into both equivalence ratios j=0.3 and j=0.5, showed that the single
injection timing is a key factor in controlling ignition timing and combustion phasing. With
a delay in the injection timing, the ignition timing significantly advances for both the cases.
3. For the different equivalence ratios j=0.3 and j=0.5, the ignition timings and maximum
pressure peak is observed to occur at a delayed timing for the higher equivalence ratio.
Also, for the case of j=0.5, a higher overall cylinder pressure is observed. It can be 84
86 88 90 92 94 96 98
45 50 55 60 65 70 75 80 85 90 95
IG
N
IT
IO
N
D
ELA
Y
(C
A)
44 concluded that equivalence ratio provides some control over the combustion phasing
besides the injection timings.
4. In the study of the effect of premixed ratio on the single injection strategy, high premixed
ratio above 80% resulted in very high heat release compared to the other cases, this may
result in high cylinder temperature and act as a precursor to NOx production.
5. Also, apart from the use of equivalence ratio and injection timing for combustion phasing
control, premixed ratio is observed to effect the ignition delay for the combustion process.