ABSTRACT
KARNATAKI, HERAMB GIRISH. Diffusion Flames. (Under the direction of Dr. Tiegang Fang).
This report details the construction of a burner that uses compressed air to combust fuel atomized by a siphon air assisted swirl nozzle. The apparatus is composed of a silica infused quartz chamber to observe the flame. The quartz window makes it possible to observe the nature of the flame under the effect of honeycomb straightened coflow and swirling coflow. Images of the flame were obtained with high frame rate and low frame rate under different inlet coflow conditions and atomization inflow settings. Long exposure images were obtained using ND-8 neutral density filter to understand the average flame structure, while optical bandpass filters were used to study CH* and HCHO variations. Spray Cone Angle was obtained by collating frames obtained using a Phantom high speed camera. A laser based Particle Size Analyzer was used to obtain droplet size distributions and Sauter Mean Diameters (SMD).
Observations of Liquid Spray Diffusion Flames by
Heramb Girish Karnataki
A thesis submitted to the Graduate Faculty of North Carolina State University
in partial fulfillment of the requirements for the degree of
Master of Science
Mechanical Engineering
Raleigh, North Carolina 2017
APPROVED BY:
_______________________________ _______________________________ Dr. Alexei Saveliev Dr. Stephen Terry
_______________________________ Dr. Tiegang Fang
DEDICATION
BIOGRAPHY
ACKNOWLEDGMENTS
The author would like to thank Dr. Tiegang Fang for his constant guidance, insight, and faith in this project. The Machine Shop staff, mainly Mr. Gary Lofton and Mr. Steve Cameron were very helpful and machined parts to perfection and deserve special thanks. The author is grateful to NC State University for providing first class research facilities, especially optical equipment lent out by NCSU Libraries. The author's fellow researchers Mr. Libing Wang and Mr. Fujun Wang provided valuable instructions and suggestions regarding the use of various optical equipment and the author is grateful to them for maintaining a highly professional work atmosphere. Mr. Pushkar Kolhatkar, a friend of the author, provided instruction in welding, a skill the author would later find extremely useful.
The author would like to thank his parents, Girish and Aditi Karnataki for their support, emotional and financial, that made higher education possible. He would like to acknowledge his dog Jack, for his unwavering love.
TABLE OF CONTENTS
List of Tables ... ... vi
List of Figures ... vii
Definitions ... x
Introduction ... 1
Literature Review ... 5
Experimental Setup ... 16
Results and Discussion ... 39
Conclusion ... 80
References ... 83
LIST OF TABLES
LIST OF FIGURES
Figure 1: Picture of a Kerosene Heater ... 1
Figure 2: Picture of a KFA 125 DGD Burner ... 2
Figure 3: Picture of Sadatomi's Patented Design ... 4
Figure 4: Sadatomi and Murai's Design with sphere ... 7
Figure 5: Sadatomi et al. and Tanno et al.'s results ... 8
Figure 6: Chen et al. studied (a) 3-D versus (b) 1-D coflow ... 10
Figure 7: (a) Droplet diameter versus axial location, (b) Droplet diameter versus time 11 Figure 8: (a) Group Combustion in air v/s (b) Droplet burning in oxygen rich oxidizer12 Figure 9: (Left) Fixed liquid flow rate, increasing gas flow rate (left to right), (Right) Fixed gas flow rate, reducing liquid flow rate (left to right) ... 13
Figure 10: Dimensionless Flame height versus overall stoichiometric air fuel ratio ... 13
Figure 11: SMD at injector of flame AHC > AHF ... 14
Figure 12: Increasing Jet Velocity (left to right) causes transition from non-premixed to premixed ... 15
Figure 13: Experimental Setups ... 16
Figure 14: Schematic Diagram of the Experimental Setup ... 17
Figure 15: Picture of the Coflow Burner ... 18
Figure 16: Quartz Cylinder ... 18
Figure 17: Picture of Operation of Siphon Air Assist Atomizer ... 20
Figure 18: Nozzle Assembly ... 20
Figure 20: Assembly Details ... 21
Figure 21: Assembly without front portion ... 22
Figure 22: Tip with helical air passages and central fuel passage ... 22
Figure 23: Metal Restrictor held using a steel strip ... 23
Figure 24: Capacitor ... 24
Figure 25: Atomizer and Spark Plug ... 25
Figure 26: PCB ... 26
Figure 27: Swirl Flow inlet tubes ... 26
Figure 28: Tube bends ... 27
Figure 29: Base Plate with welded tube fittings ... 29
Figure 30: Three sets of ball valve, rotameter, and pressure regulator ... 29
Figure 31: Quartz Pipe placed on the steel plate mount ... 30
Figure 32: DSLR Camera Setup with optical filter and holder ... 32
Figure 33: FGA 4000 XDS Gas Analyzer ... 33
Figure 34: Exhaust Gas Sampling Probe inserted in steel dome ... 34
Figure 35: Fundamentals of the operation of a Particle Size Analyzer ... 36
Figure 36: A typical light scattering pattern ... 37
Figure 42: Low exposure time biodiesel flame images with parallel coflow ... 46
Figure 43: Low exposure time biodiesel flame images with swirl coflow ... 46
Figure 44: High exposure diesel images with high atomization and parallel coflow ... 48
Figure 45: High exposure diesel images with low atomization and parallel coflow ... 48
Figure 46: High exposure diesel images with varying atomization and parallel coflow 50 Figure 47: High exposure biodiesel images with varying atomization and parallel coflow50 Figure 48: High exposure diesel images with varying atomization and swirling coflow51 Figure 49: High exposure biodiesel images with varying atomization and swirling coflow51 Figure 50: Mixed Parallel-Swirl diesel coflow with high atomization ... 52
Figure 51: Mixed Parallel-Swirl diesel coflow with low atomization ... 52
Figure 52: Mixed Parallel-Swirl biodiesel coflow with high atomization ... 53
Figure 53: Mixed Parallel-Swirl biodiesel coflow with low atomization ... 53
Figure 54: Diesel Flame with Parallel Coflow and High Atomization ... 55
Figure 55: Diesel Flame with Parallel Coflow and Low Atomization ... 55
Figure 56: Diesel Flame with Varying Atomization and Parallel Coflow ... 56
Figure 57: Biodiesel Flame with Varying Atomization and Parallel Coflow ... 56
Figure 58: Diesel Flame with Varying Atomization and Swirl Coflow ... 57
Figure 59: Biodiesel Flame with Varying Atomization and Swirl Coflow ... 57
Figure 60: Mixed Parallel-Swirl diesel coflow with high atomization ... 58
Figure 61: Mixed Parallel-Swirl diesel coflow with low atomization ... 58
Figure 62: Mixed Parallel-Swirl biodiesel coflow with high atomization ... 59
Figure 64: Diesel Flame with Parallel Coflow and High Atomization ... 62
Figure 65: Diesel Flame with Parallel Coflow and Low Atomization ... 62
Figure 66: Diesel Flame with Varying Atomization and Parallel Coflow. ... 63
Figure 67: Biodiesel Flame with Varying Atomization and Parallel Coflow ... 63
Figure 68: Diesel Flame with Varying Atomization and Swirl Coflow ... 64
Figure 69: Biodiesel Flame with Varying Atomization and Swirl Coflow. ... 64
Figure 70: Mixed Parallel-Swirl diesel coflow with high atomization ... 65
Figure 71: Mixed Parallel-Swirl diesel coflow with low atomization ... 65
Figure 72: Mixed Parallel-Swirl biodiesel coflow with high atomization ... 66
Figure 73: Mixed Parallel-Swirl biodiesel coflow with low atomization ... 66
Figure 74: Singular Images of Spray taken at different time instants ... 70
Figure 75: Collated Image of frames in Figure 4.38 ... 71
Figure 76: Collated image of 200 frames ... 71
Figure 77: Plot of Water Spray angle versus Air Pressure for multiple grayscale values72 Figure 78: Plot of Diesel Spray angle versus Air Pressure for multiple grayscale values72 Figure 79: Plot of Water Spray angle versus Air Inlet Pressure ... 73
Figure 80: Plot of Diesel Spray angle versus Air Inlet Pressure ... 73
Figure 81: Comparison of SMDs of Diesel and Water Sprays ... 74
Figure 82: Comparison of D50 diameter and SMD of Diesel Spray ... 74
Figure 83: Comparison of D50 diameter and SMD of Water Spray ... 75
Figure 84: Droplet Size Distributions of Water Sprays ... 76
Figure A.1.: Nozzle Mixing Chamber Meshed: Blue region showing air and fuel inlets90
Figure A.2.: Air and Fuel Inlets ... 91
Figure A.3.: Combustion chamber mesh. Length 15 in. and Diameter 6.9 in ... 91
Figure A.4.: Species: Chemistry ... 92
Figure A.5.: Species: Model ... 92
Figure A.6.: Species: Control ... 93
Figure A.7.: Species: Create PDF Table ... 93
Figure A.8.: Discrete Phase Model: Enabling Droplet Breakup ... 94
Figure A.9.: Setting up droplet injection ... 94
Figure A.10.: Solution Schemes: Second Order for stability ... 95
Figure A.11.: Air Inlet Mass Flow BC with X,Y,Z component ... 95
Figure A.12.: Thermal BC ... 96
Figure A.13.: Species Mean Mixture Fraction ... 96
Figure A.14.: DPM Escape BC ... 97
Figure A.15.: Boundaries ... 97
Figure A.16.: Temperature Contour for Constant Wall Temperature ... 98
Figure A.17.: O2 mass fraction contour ... 98
Figure A.18.: CO mass fraction contour ... 98
DEFINITIONS Symbols
Φ: Equivalence Ratio m: mass flow rate ET: Exposure Time p: Pressure
Subscripts f: fuel flow
a: air flow to atomizer mixing chamber CP: Parallel Coflow
1 INTRODUCTION
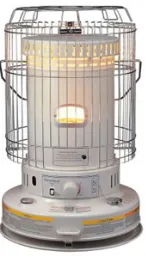
A traditional kerosene heater shown in Figure 1 features a wick at the centre that absorbs kerosene poured into a fuel tank which is necessary for a primary combustion process to occur. In order for the kerosene to be lit, there is a special ignition plug to vaporize and subsequently burn the kerosene to generate heat. A mechanical control is integrated into the centre of the burning units which allows the amount of air entering the base of the heater to be regulated. In addition, the exposed area of the wick in the heater can also be altered, affecting the height of the flame and the amount of heat that is produced. The wick is usually circular in shape and is composed of either cotton or fibreglass. It is possible for the kerosene heater to warm up surroundings by using either radiation or convection heating methods, blower fans being used for heavy duty applications. Lowering the wick out of the burner turns off the heater, extinguishing the flame.
Figure 2: Picture of a KFA 125 DGD Burner
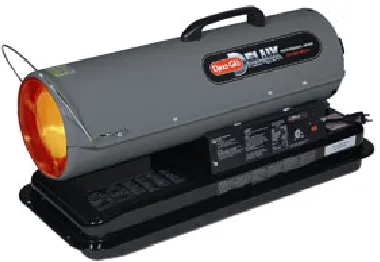
A Dura Heat Convection Kerosene Heater is capable of heating a room in a 360-degree radius providing maximum coverage area without utilizing a fan or a blower. The heater has a capacity of 23,000 Btu/h and coverage area of 1000 ft2, and serves as an emergency backup or portable heat source. Its safety features include automatic shut off when not vertically positioned and a metal cage style guard around the heater to prevent human contact with hot surfaces.
commonly consist of air assisted swirl nozzles similar to the design popularized by Delavan. The nozzle draws fuel from a sump by creating a vacuum in a constricted mixing chamber. The intensity of the vacuum determines the fuel flow rate and this intensity is determined by inlet pressure of air that is assisting atomization. This serves as a fuel flow control
mechanism in large air heaters such as the KFA 125 DGD manufactured by GHP Group Inc. The KFA 125 DGD shown in Figure 2 provides 100,000 to 125,000 Btu/h of heat to an area of 3000 ft2 for a period of 12 hours on a full 10 gallon tank. It is equipped with an air pressure gauge and a 520 CFM blower for co-flow.
atomization. The air assisted atomizer is a typical twin-fluid atomizer, where the compressed air is supplied for atomizing the liquid, while the liquid is supplied by one of the three ways, pressure feed, gravity feed, and siphon principle. The air assisted atomizers provide a fine degree of atomization under a given flow capacity and supplied pressure. In a siphon air assist atomizer, the pressurized air expands within the internal mixing chamber, thereby helping the liquid be siphoned by a vacuum pressure due to the ejector effect. The atomizer has a primary nozzle and secondary nozzle, which lead to a relative complex structure from the perspective of manufacturing.
A siphon air assisted atomizer with an orifice in the flowing air tube shown in Figure 3 was patented by Sadatomi and Kawahara. The atomizer is supplied pressurized air from a compressor and consumes less power, it contains straight tubes thus being simple to manufacture, and can provide droplets below 20 microns in size due to the porosity of the water inlet.
2 LITERATURE REVIEW
A few nozzle designs and experimental setups constructed to study spray characteristics from internal mixing siphon air-assist atomizers have been studied and summarized in the
following section. A majority of the publications listed sought to examine the effect of inlet fluid and air conditions on spray parameters D32 diameter and mass flux density over lateral and longitudinal dimensions.
Kufferath et al. [1] constructed an internal mixing nozzle system which allowed them to gain control over geometrical parameters like exit length and diameter of air-fluid mixture and the inlet length and diameter of fluid. Additionally, the fuel flow was externally controlled to observe the effect of fluid inlet conditions on pressure drop of air. The mixing chamber and exit region was studied through two acrylic walls of a square shaped exit region. Atomization of glycol-water mixture was observed using a Phase Doppler Analyzer (PDA) 200 mm downstream of nozzle exit. The authors observed that short exit lengths result in significantly higher D32 diameters at the nozzle centerline for laminar jets but are evenly distributed for laminar jets with long exit lengths and turbulent jets irrespective of exit lengths. Also, air pressure drop in the expanding region of the mixing chamber is limited by the cavitation which caused asymmetries to occur in spray jet. The transition region between laminar and turbulent behavior should be avoided due to instabilities in the spray behavior.
consumes energy more economically across a large range of flow rates, although a medium sized atomizer is more energy efficient at higher flow rates. Additionally, a propeller fan was attached below the nozzle exit to increase the spread of the spray which was measured using a patternator. The propellers resulted in a 50 % decrease of SMD due to secondary
atomization. An optimization study was conducted to obtain the outlet port length for the highest water suction flow rate. This length is an intermediate value and corroborates the authors' suggestion that too long exit lengths cause large pressure losses while too short exit lengths mean shorter vacuum pressure regions.
Kushari [2] carried out a similar exercise by varying the exit length and outflow area of a siphon air-assist atomizer and observing the effects on performance. Three injector models with different air inlet holes and hole diameters were taken into consideration. Water is sprayed into a high pressure chamber with coflow to prevent misting of windows that allow measurements using a PDA at 62.5 mm downstream of the nozzle exit. Increased Air/Liquid ratio resulted in decreased SMD due to higher liquid kinetic energy but reduced liquid flow rate due to flow constriction. Reduction in liquid flow rate is the predominant effect at lower Air/Liquid ratios but at higher ratios it is less sensitive to change. Also SMD at center of spray was higher than at periphery due to encroachment of high velocity air at the centre of the spray. Increase in exit port length resulted in reduced SMD due to better mixing of air and fluid due to longer interaction time. Beyond a certain value of Air/Liquid ratio, the SMD increase slows down.
on siphon action. The Air/Liquid mass flow ratio (ALR) increased with an increase in air supply pressure but the rate of increase was a rising tendency indicating water supply reduces with increasing air supply pressure. This behavior is more stark at lower ALR but reduces in intensity at higher ALR due to reduced flow area available to water, due to reduction in the discharge coefficient. Increase in ALR caused a reduction in SMD although the water flow rate reduced. However the span remained constant indicating symmetrical distribution at all ALRs. Higher liquid flow rates caused smaller SMDs due to increase kinetic energy of exiting jet. Lal et al. were able to obtain a non-dimensionalized droplet diameter represented in terms of the Ohnesorge Number (Oh) and nozzle geometry, ultimately establishing its decreasing relationship with the ALR for this particular nozzle and verifying their
suppositions with experimental data, which was in accordance. The authors also concluded that air supply pressure must be increased to maintain SMD with increasing water supply pressures.
Sadatomi, Murai et al. [7] developed a mist generator for the purpose of providing high air to fluid ratio sprays with high inlet air flow rates while minimizing power consumption and droplet size.
They developed an atomizer with a sphere in the supply line that breaks fluid into small droplets by the action of shear at its periphery. The droplet size distributions indicate that a majority of droplets are smaller than 30 microns in size at 0.2 LPM of flow rate. The authors verified results using Nukiyama and Tanasawa's correlation for estimating droplet sizes and found their results to be approximately 1.5 times their experimental data.
Nukiyama and Tanasawa's correlation: 𝒅𝑺𝑴 = 𝟎.𝟓𝟖𝟓
𝒗𝑮𝑳 � 𝝈 𝝆𝑳+ 𝟓𝟑.𝟐 � 𝝁𝑳 �𝝆𝑳𝝈� 𝟎.𝟒𝟓 �𝑸𝑳 𝑸𝑮� 𝟏.𝟓
The authors also found their results to be in accordance with a similar sized atomizer designed by Tanno et. al.
Figure 5: Sadatomi et al. [7] and Tanno et al.'s results [8]
Watanawanyoo et al. [4] studied not only the effect of nozzle inlet flow parameters on atomization but the visual images of spray at different critical flow rates using a
extent after which the curve plateaus. Increased supply pressure caused increased ALR but corroborated Lal et al.'s finding that ALR increases at a faster rate as supply pressure in increased. Contrary to Lal et al.'s findings, the coefficient of discharge increased with increase in supply pressure which fails to explain reduced water flow rate at higher supply pressures. Information obtained from images indicates that spray angle remained relatively constant across the range of supply air pressures. Shadowgraphs at 170 kPa, 520 kPa, and 790 kPa were observed. It was inferred that prompt atomization occurs at 790 kPa, the water jet maintained its integrity for a longer distance from the nozzle tip at 170 kPa, and the filaments broke into droplets at 520 kPa.
Liu [6] goes on to express component details like diffuser efficiency, mixing efficiency, suction and motive nozzle efficiency, and pressure recovery coefficient, concluding with the approximate values considered by researchers.
Among research conducted on visualization of diffusion flames, a few publications were consulted to get acquainted with the commonly constructed system designs. The publications discussed in this chapter have aided the development of the coflow burner, the subject of this report. The coflow burners have varying dimensions, state of fuel - liquid spray or gaseous, fuel delivery methods, oxidizer supply systems, and measurement systems. Objectives of different burner designs range from studying NOx concentrations, to obtaining axial and radial temperature profiles. However, the setup constructed by the author provides scope for examining multiple parameters in the future if not documented in this report, which was the motivation behind a chronological study of a variety of experiments.
Chen and Gomez [9] constructed a coflow burner to study heptane flames from
monodisperse sprays. They studied the effect of three dimensional fan-induced coflow versus the effect of parallel coflow on the flame height and width.
The principle focus of their research was determining droplet life histories along the flame centerline. The authors concluded that droplets follow d-squared law with respect to time and axial location as shown in Figure 7. The evaporated droplets form a cloud that is surrounded by the flame, while individual droplet burning does not occur, for which droplet interaction needs to be less vigorous.
Figure 7: (a) Droplet diameter v/s axial location; (b) Droplet diameter v/s time [9] Chen and Gomez [10] later used the same setup to observe transition from group combustion to individual droplet burning. The parameter used for this purpose was called Group
Combustion Number G. G >>1 indicates presence of vaporizing droplets surrounding the flame's core containing non-evaporating droplets while G << 1 indicates individual droplet burning.
𝑮= 𝟐𝝅𝒏𝑫𝑹𝒄𝟐
molar concentrations, the absence of soot in the lower part of the flame was seen. This allowed the authors to visually observe individual droplets burn. Increasing oxygen content resulted in increasing critical value of G.
Figure 8: (a) Group Combustion in Air versus (b) Individual Droplet Burning in Oxygen-rich Oxidizer [10]
Figure 9: Left: Fixed liquid flow rate, increasing gas flow rate (left to right) Right: Fixed gas flow rate, reducing liquid flow rate (left to right) [11]
Chen et al. [12] studied acetone turbulent spray flames from a burner with the provision of atomizing the fuel using an ultrasonic nebulizer and pilot coflow air to stabilize the flame. Air is used as a spray carrier before the fuel is injected imparting a premixed nature to the flames.
Figure 11: SMD at injector of flame AHC > AHF. [12]
Chen et al. use Figure 11 to describe the effect of droplet diameter at the injector mouth on spread of liquid droplets over the flame region. Flame AHC, by virtue of its higher SMD (21 μm) at injector tip, has widespread liquid droplets. The smaller SMD droplets of flame AHF (18 μm) evaporate in the turbulent combustion environment. Flame AHC contains a large
unburnt particle concentration at its periphery and the liquid droplets have a small response to flow turbulence. On the other hand, evaporation of droplets is clearly effected by
Masri and Gounder [13] also studied piloted flames of acetone in a setup similar to Chen et al. and concluded that at low jet velocities the flame is non-premixed. They obtained OH scattering images to understand the reaction zones in the flame. Varying jet velocity led to a change in the mean temperature as the jet moved towards transition from non-premixed to premixed.
Figure 12: Increasing Jet Velocity (left to right) causes transition from non-premixed to premixed [13]
Figure 13 : Experimental Setups (clockwise from top left)
3 EXPERIMENTAL SETUP
The burner design used in the following experiments is shown schematically in Figure 14 and pictorially in Figure 15. It is modeled off the KFA 50 DGD burner manufactured by GHP Group Inc. with the exception that co-flow air source is compressed air obtained from a Rotary Screw compressor and combustion is observed through a vertically placed SiO2 infused quartz combustion chamber shown in Figure 16. Effort was done to replicate original conditions by placing a restrictor at the outlet of the combustion chamber, that deflects the flame inside and creates a recirculation zone leading to increased air outlet temperatures. Concerns over the maximum temperature the chamber can sustain resulted in abandoning a restrictor and instead an open flame was observed.
Figure 15: Picture of the Coflow Burner
Air is injected both axially from the bottom and tangentially through the 4 side ports. The two air streams mix to form a swirling velocity profile, which flows around the central fuel tube. The flow can be characterized by the non-dimensional swirl number, defined as
where Gφ is the mass flux of axial air and Gz is the mass flux of tangential air. A swirl
number of zero represents a conventional co-flow burner with no swirl, and a swirl number of five represents a relatively high swirl flame. At the top of the burner, fuel is sprayed and mixed with the swirling air, and burns. The combination of swirling air and the low pressure zone created by the expansion causes the flame to form a recirculation zone, where
combustion gasses are pulled from the outside of the flame back to the centre. As the swirl number is raised, the flame height will decrease dramatically.
In order to effectively atomize the kerosene and diesel, Siphon type air atomizing nozzles are
used. These nozzles use pressurized air to atomize the liquid fuel as shown in Figure 17. When
used with conventional fuels such as kerosene and diesel, these nozzles require low air pressure
(3-5 psi) and no fuel pump. Viscous fluids would require higher flow rates to draw enough fluid
for combustion.
The construction of the siphon air atomizing nozzle has been pictorially shown in Figures 18, 19,
20, 21, and 22. It consists of 6 parts: A polymer cover; an insert with a through hole for fuel flow
and flutes on the outside for air flow; a conical part that forms the front body of the nozzle and
contains a mixing chamber and nozzle outlet through which the air fuel mixture flows; a conical
tip having helical air flow passages that fits at the end of the insert opening the air and fuel flow
of the assembly inside the cover and to prevent intermixing of fuel and air before it reaches the
mixing chamber. The cover contains two separate inlets for air and fuel.
Figure 17: Principle of Operation of Siphon Air Assist Atomizer [16]
Figure 19: Exploded View of Nozzle Assembly
Figure 21: Assembly without Front Portion
Figure 22: Tip with helical air passages and central fuel passage
As discussed previously, in order to further strengthen the flame recirculation zone above the
spray nozzle and to provide a significantly hot environment for the flame, a metal enclosure was
placed at the outlet of the quartz combustion chamber as shown in Figure 23. To accomplish this,
the radiation shield of a kerosene forced air heater was cut using shears and placed on top of the
quartz chamber and tightened using steel strips with worm screws. Fused quartz can safely
clear study of the flame. Meanwhile, the quartz cylinder with a thickness of 3 mm, outer
diameter of 170 mm and height of 12", provides a complete view of the interiors of the
combustion chamber from the nozzle tip up to the restrictor. The restrictor caused the flame to be
deflected inwards causing soot particles to be deposited on the quartz chamber walls hampering
the experimental readings.
Figure 23: Metal Restrictor held using a steel worm strip
The annular space was designed in a manner that does not affect the nature of swirling air flow.
The outer cylinder was made of plain carbon steel, in which 4 holes were drilled diametrically at
a mindpoint distance along its length. The cylinder sits atop a stainless steel base plate that
contains a total of 8 holes for coflow air inlet. Of these eight holes, half supply air to the annular
space and half provide air to the inner cylinder. The outer cylinder is concentric to an inner
stainless steel cylinder that contains an arrangement to hold the nozzle and spark plug at the
centre of the setup. The nozzle contains a protruded portion on the outer surface of its body. The
between the nozzle exit and the electrodes that is necessary for proper ignition. DC power supply
is provided to the electrodes via a capacitor shown in Figure 24 while air supply is provided to
the nozzle via a separate pneumatic circuit. The nozzle draws fluid through a flexible tube. The
tubes for air supply and fuel supply to the nozzle, and the wires for electric supply to the spark
plug enter the apparatus through a hole in the base plate that is concentric with the inner
cylinder. The co-flow air that enters this space is stratified using steel wool and an Aluminum
honeycomb mesh. The tubes necessitated cutting a central hole in the honeycomb inside the
inner cylinder that might induce small experimental errors. The outer cylinder has OD 3/8"
stainless steel tubes entering diametrically through the four peripheral holes as shown in Figure
27. These tubes were bent by an angle of 90 degrees, shown in Figure 28, in order to simulate
entry of fluid tangentially. The idea of drilling holes tangentially along the outer cylinder's
surface was discarded due to the possibility of a drill but being deflected sideways due to the
curvature of the cylinder. Also, inserting tubes offers the added flexibility of changing the helix
angle of air entry for swirl coflow. This is because the tubes are held on the outside using test
tube clamps and they can be rotated at will before fixing their positions. Devising means to
carefully adjust the helix angle for all tubes could be one of the vital tasks in future
improvements. In this report, the results presented have been obtained with a helix angle of
Figure 24: Capacitor
Figure 26: PCB
Figure 28: Tube bends
In order to supply coflow air to the chamber that would flow axially, stainless steel Swagelok
tube fittings with 1/4" tube OD were used. The 8 nuts were welded to the base plate, shown in
Figure 29, using a MIG welding setup that allowed the apparatus to be made leak-proof. The
other ends of the tube fittings were joined together using 4-way and 3-way connectors, ultimately
resulting in a single air supply tube linked to a pressure regulator, a rotameter, and a ball valve.
The same system is replicated for the four swirl flow inlet tubes as well as the tube supplying air
Figure 29: Base Plate with welded tube fittings
The quartz pipe has an outer diameter of 6.92" that is much smaller than the inner diameter of the outer steel pipe necessitating the construction of a mounting arrangement. A steel plate, having an outer diameter equal to that of the outer cylinder and inner diameter barely smaller than that of the quartz cylinder is manufactured by waterjet cutting of a steel plate. This steel ring is screwed at the flat surface of the outer cylinder and the quartz pipe is placed centrally on the flat ring as shown in Figure 31.
Figure 31: Quartz Pipe placed on Steel Plate mount
was restricted by welding a metal stopper at the edge of the base plate. This prevented lateral and angular movement of the cage allowing only upwards movement for assembly and disassembly.
Flame was observed with a Nikon Nikkor 105mm UV lens attached to a Canon Rebel T4i DSLR camera with an F to EF Mount adapter due to incompatibility of Nikon and Canon parts. The camera was mounted on a tripod, as shown in Figure 32, at a distance of approximately 10 feet from the setup and the portion of the setup above the bottom of the quartz chamber was brought into focus till the flame height was covered for the case of maximum flame height. This involved moving the camera to and fro till the correct distance from the setup was obtained. Long exposure photographs involved using filters to reduce transmissivity of light emanating from the flame. An Altura Neutral Density filter of notation ND8, having 12.5% transmittance, was used to observe natural colors of the flame. OH and HC luminescence was observed using 430 nm and 470 nm Edmund Optics band pass filters respectively. These were held in front of the camera lens using grippers. The process
Figure 32: DSLR Camera Setup with Filter and holder
when constant nature of readings would be established. The analyzer was calibrated from time to time.
Figure 34: Exhaust Gas Sampling Probe inserted in Steel Dome
images were collated using MatLAB's Image Processing Package into a single grayscale image that averaged the grayscale values for each location on all images using Matlab's imfuse () command. This provided a sharp image of the spray with high grayscale values in regions of spray with a contrasting background. The contrast between the background and the spray was used to determine location of the spray edge based on a user specified
threshold value. These values were stored in an array and fit along a linear curve. The slopes of the two curves along the two edges were used to determine spray angle for various nozzle inlet air pressures ranging from 5 psig to 60 psig.
Figure 35: Fundamentals of Operation of Particle Size Analyzer [15]
As shown in Figure 35 the light from the laser (1) is scattered by the spray droplets (3). The laser beam is expanded by the collimating optics (2) to provide a wide parallel beam. The scattered light is focused by a focusing lens (4) in a Fourier arrangement and picked up by the detector array (5). Unscattered light is focused by the focusing lens (4), so that it passes through the pinhole at the centre of the detector array. This is measured by the beam power detecto to give the light transmission.
The angle at which a particle diffracts light is inversely proportional to its size. The detector array is made up of over 30 individual detectors, each of which collects the light scattered by a particular range of angles. There is a data channel for each of these. Measuring the angle of diffraction determines the size of the particle. Diffraction is also influenced by the material which makes up the particles.
Figure 36: A Typical Light Scattering Pattern [15]
In cases where the particle concentration is high, the measurement process is complicated by scattered light being re-scattered by other particles before it reaches the detector. The
shaped droplet. The Spraytec uses the volume of the droplet to measure its size. The
fundamental size distribution derived is volume-based. The analysed distribution is expressed in a set of size bands, optimised to match the detector geometry and optical configuration which gives the best resolution. All parameters are derived from this fundamental
distribution.
Distribution parameters and derived diameters are calculated from the fundamental
4 RESULTS AND DISCUSSION Low Exposure Time Images
The flame was visualized using a DSLR camera under different air and fuel flow conditions. The Coflow air flow rate was varied from 100 lpm to 60 lpm in the parallel configuration and from 38 lpm to 23 lpm in four steps in the swirling configuration. It was observed that the swirl caused the flame width to increase. The swirl flow air was purposely inserted at lower pressures to avoid contact of the flame with the transparent quartz chamber. This caused soot to be deposited on the quartz surface defeating the purpose of visualizing the flame. The flow rate of air entering the siphon air assist atomizer was also varied from 21 lpm to 12 lpm in two steps in order to study the influence of atomization on flame characteristics. This caused the fuel flow rate to vary which was affected by the nature of fluid as well. It was evident from measurements, that of the two fuels tested, biodiesel was entrained by the atomizer at a faster rate than diesel, all other conditions remaining same.
The camera settings were varied to get the picture most appropriate for studying the average shape of the flame as well as its instantaneous behavior. Two sets of images were obtained. To study time averaged flame, exposure time was set to 8 seconds, F-Stop value was set to 4.5, the minimum value possible with the Nikon 105mm lens, and ISO was set to 100. All light sources in the surroundings were switched off. A neutral density filter of specification ND8 was used to reduce transmissivity by 1/8th. To get an instantaneous snapshot of the flame, exposure time was set to 0.2 seconds, ISO to 100, and F-Stop value to 32 i.e. aperture was kept to a minimum. As described previously, the flame pictures were segregated
the fuel flow rate. Figure 37 shows the contrasting images obtained by varying exposure time and aperture all else being maintained constant.
Figure 37: ET: 8 sec and F-stop: 4.5 (left) and ET: 0.2 sec and F-stop: 32 (right), mCP: 70 lpm, mf : 0.025 kg/min, ma: 18 lpm
atomization, combustion commences. The image on the right suggests that the flame front is not uniform but curving from bottom left to top right. This may be caused by the presence of spark plug electrodes that hamper uniform spread of the spray. The flame front is blue in color due to the ample supply of oxygen from below.
Figure 38: ET: 0.2 s; ma: 21 lpm; Diesel mf: 0.0297 kg/min
mCP in lpm (left to right): (a) 100, (b) 90, (c) 80, (d) 70, (e) 60
Figure 38 shows images of the flame at varying coflow rates keeping primary atomization parameters constant. The blue nature of the flame is due to leaner combustion and is seen in decreasing nature from left to right as would be expected.
Figure 39 shows images of the flame with same coflow rates as Figure 38 but with reduced fuel flow rate and coarse atomization. The issue of atomization will be discussed
Figure 39: ET: 0.2 s; ma: 12 lpm; Diesel mf: 0.0235 kg/min
mCP in lpm (left to right): (a) 100, (b) 90, (c) 80, (d) 70, (e) 60
The image in Figure 38 (b) and Figure 39 (a) have same air flow rates but Figure 38 (b) has a higher fuel flow rate and hence a higher equivalence ratio. However 38 (b) dedicates 21 lpm of air for atomization compared to 12 lpm by Figure 39 (a). This might be a reason Figure 38 (b) appears much bluer than Figure 39 (a) due to incomplete combustion of fuel. This can be seen in Figure 38 where atomization has a stronger impact on combustion than flow rate of swirling coflow air.
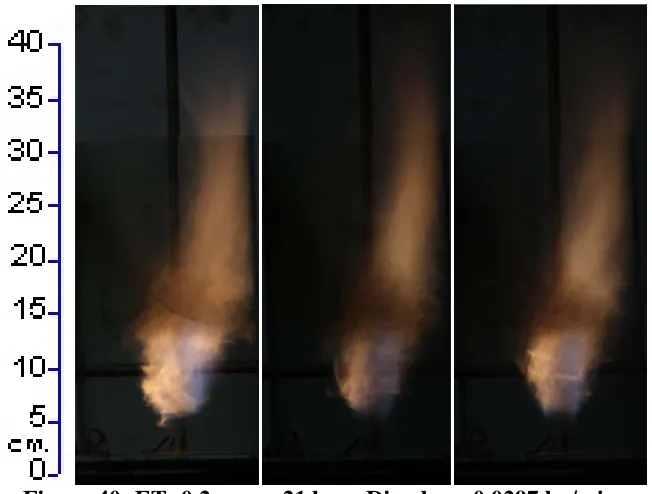
Figure 40: ET: 0.2 s; ma: 21 lpm; Diesel mf: 0.0297 kg/min
mCS in lpm (left to right): (a) 38, (b) 33, (c) 23
Figure 41: ET: 0.2 s; ma: 12 lpm; Diesel mf: 0.0235 kg/min
This indicates that coflow conditions have a lesser impact on combustion as compared to atomization of fuel. The droplet size under cold flow conditions is approximately 35 microns for Figure 40 and approximately 60 microns in Figure 41. This might be one of the factors that explain why Figure 41 images appear to have a reducing region in spite of having lower fuel flow rates.
Height of flames with different coflow inlet velocities and same primary atomization
conditions is similar for a particular fuel flow rate with minor differences. This indicates that coflow inlet velocity affects the reaction but it does not have a bearing on axial momentum of flame. Figure 40 has narrower flames than Figure 41, possibly due to the high velocity of injection of the fuel. Also Figure 40 contains a bright zone much closer to the nozzle fuel exit as compared to Figure 41, possibly due to the atomized fuel droplets reacting faster with the air. On the other hand, Figure 41 shows images with a bright portion much farther away from the nozzle exit and spread out over a larger area. This could be due to the necessity of
right. The irregularity associated with assembling the swirling coflow inlet tubes could be a reason for this occurrence. As mentioned in the previous chapter, the helix angle cannot be properly regulated and hence these results serve as preliminary, at best, to more systematic experimentation in the future.
Although it has been concluded that the coflow inlet velocity does not appreciably affect the physical characteristics of the flame, it is seen that flames with lower coflow inlet velocity have a smoother base in parallel coflow configuration. Also, as coflow inlet velocity is increased, the bright white portion shifts farther away from the nozzle exit. This might point to the fact that coflow air does have an effect on secondary atomization, pushing the smaller droplets further up before they completely react and generate energy. This can be verified from images in Figure 39 that have a slight tinge of red at the bottom of the flame at large coflows but the base is completely white at lower coflows.
Spray angle decreases as primary atomization settings are varied from a low fuel velocity to high. Figure 40 shows a blue portion occurring farther away from the nozzle exit as
compared to Figure 41. This indicates that the droplets do not have enough residence times to consume all the oxygen in the coflow air before they have travelled a significant distance away from the nozzle tip. Increasing coflow air inlet velocity beyond the maximum value used in this project might provide a deep blue diffusion flame.
Figure 42 ma: 21 lpm, Biodiesel mf: 0.033 kg/min;
ma: 12 lpm, Biodiesel mf: 0.016 kg/min
Figure 43 ma: 21 lpm, Biodiesel mf: 0.033 kg/min;
Figure 44 ma: 21 lpm, Diesel mf: 0.029 kg/min
mCP in lpm (from left to right): (a) 100, (b) 60
Figure 45 ma: 12 lpm, Diesel mf: 0.024 kg/min
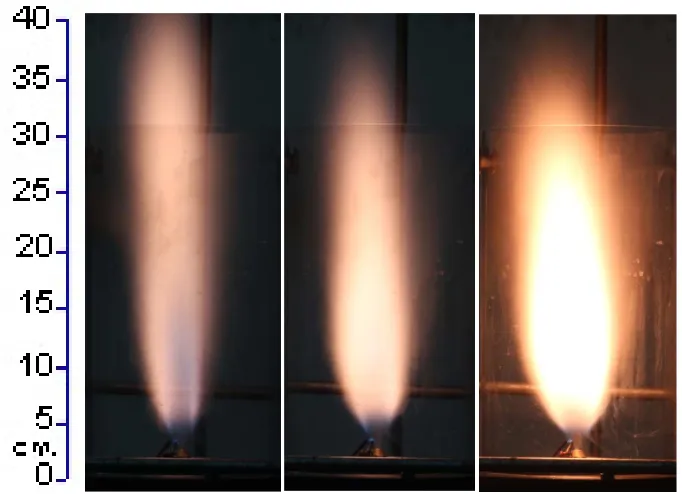
High Exposure Time Images
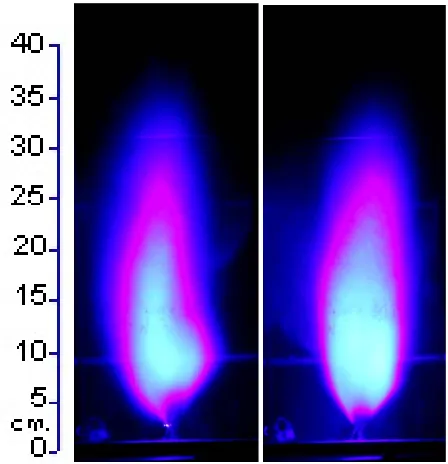
Figure 44 and 45 show long exposure images of the flame obtained using a Neutral Density ND-8 filter which has a transmissivity of 12.5%. The images were obtained with 8 seconds of exposure time to average out instantaneous variations and provide an approximate
representation of the flame at any time instant under a set of conditions. Figure 44 (a) and (b) show a narrower flame than Figure 45 (a) and (b), flame heights being similar. This
inflow rate of air (123 lpm v. 100 lpm). The swirling component dampens the effect of the parallel component, causing this behavior to occur.
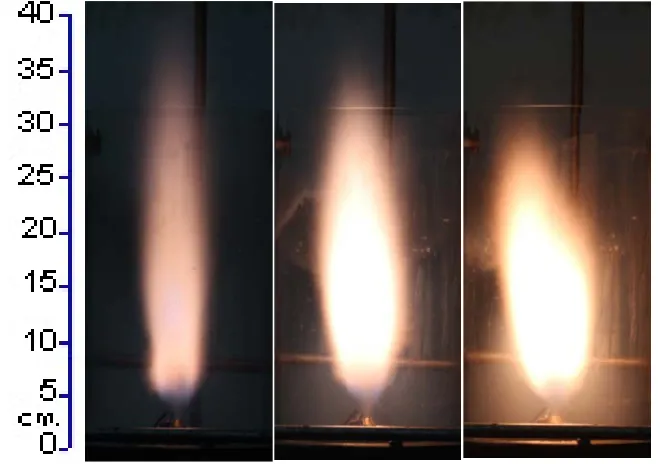
Figure 46 mCP: 100 lpm, ma in lpm (left to right): (a) 21, (b) 18, (c) 12
Diesel mf in kg/min (left to right): (a) 0.0301, (b) 0.0247, (c) 0.0238
Figure 47 mCP: 100 lpm, ma in lpm (left to right): (a) 21, (b) 18, (c) 12
Figure 48 mCS: 38 lpm, ma in lpm (left to right): (a) 21, (b) 18, (c) 12
Diesel mf in kg/min (left to right): (a) 0.0301, (b) 0.0247, (c) 0.0238
Figure 49 mCS: 38 lpm, ma in lpm (left to right): (a) 21, (b) 18, (c) 12
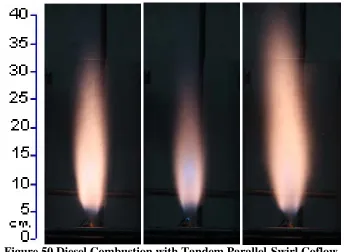
Figure 50 Diesel Combustion with Tandem Parallel-Swirl Coflow
Left to right: (a) 100 lpm mCP, 23 lpm mCS, (b) 70 lpm mCP, 28 lpm mCS, (c) 60 lpm mCP,
38 lpm mCS; ma: 21 lpm, Diesel mf: 0.0297 kg/min
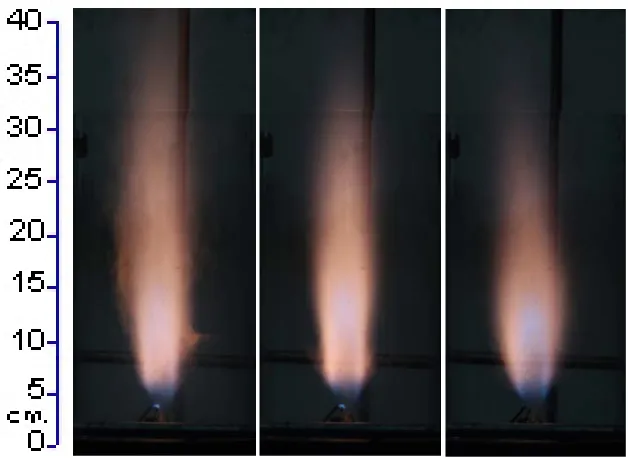
Figure 51 Diesel Combustion with Tandem Parallel-Swirl Coflow
Left to right: (a) 100 lpm mCP, 23 lpm mCS, (b) 70 lpm mCP, 28 lpm mCS, (c) 60 lpm mCP,
Figure 52 Biodiesel Combustion with Tandem Parallel-Swirl Coflow
Left to right: (a) 100 lpm mCP, 23 lpm mCS, (b) 70 lpm mCP, 28 lpm mCS, (c) 60 lpm mCP,
38 lpm mCS; ma: 21 lpm, Biodiesel mf: 0.033 kg/min
Figure 53 Biodiesel Combustion with Tandem Parallel-Swirl Coflow
Left to right: (a) 100 lpm mCP, 23 lpm mCS, (b) 70 lpm mCP, 28 lpm mCS, (c) 60 lpm mCP,
Images with 430 nm Optical Bandpass filter (CH*)
Figures 54 to 63 show flames studied using a 430 nm optical filter that provides a
Figure 54 ma: 21 lpm, Diesel mf: 0.029 kg/min
mCP in lpm (from left to right): (a) 100, (b) 60
Figure 55 ma: 12 lpm, Diesel mf: 0.024 kg/min
Figure 56 mCP: 100 lpm
ma in lpm (left to right): (a) 21, (b) 18, (c) 12
Diesel mf in kg/min (left to right): (a) 0.0301, (b) 0.0247, (c) 0.0238
Figure 57 mCP: 100 lpm
ma in lpm (left to right): (a) 21, (b) 18, (c) 12
Figure 58 mCS: 38 lpm
ma in lpm (left to right): (a) 21, (b) 18, (c) 12
Diesel mf in kg/min (left to right): (a) 0.0301, (b) 0.0247, (c) 0.0238
Figure 59 mCS: 38 lpm
ma in lpm (left to right): (a) 21, (b) 18, (c) 12
Figure 60 Diesel Combustion with Tandem Parallel-Swirl Coflow
Left to right (in lpm): (a) 100 mCP, 23 mCS, (b) 70 mCP, 28 mCS, (c) 60 mCP, 38 mCS
ma: 21 lpm, mf: 0.0297 kg/min
Figure 61 Diesel Combustion with Tandem Parallel-Swirl Coflow
Left to right (in lpm): (a) 100 mCP, 23 mCS, (b) 70 mCP, 28 mCS, (c) 60 mCP, 38 mCS
Figure 62 Biodiesel Combustion with Tandem Parallel-Swirl Coflow Left to right (in lpm): (a) 100 mCP, 23 mCS, (b) 70 mCP, 28 mCS, (c) 60 mCP, 38 mCS
ma: 21 lpm, mf: 0.0330 kg/min
Figure 63 Biodiesel Combustion with Tandem Parallel-Swirl Coflow Left to right (in lpm): (a) 100 mCP, 23 mCS, (b) 70 mCP, 28 mCS, (c) 60 mCP, 38 mCS
The effect of swirling coflow can be seen in Figures 60 to 63. Varying the swirling coflow air inlet flow rate has no effect on the overall CH* concentration. Increasing coflow flow rates beyond those presented in this report might provide a different picture. Increasing the percentage of swirling coflow air in the total air flow rate reduced the flame height. This caused the CH* concentration near the nozzle exit to rise and the spread of the profile
decreased. Overall it cannot be determined with these results whether swirling coflow caused the CH* concentration to reduce. However it is evident that the reaction zone shape is altered due to swirl. This might have a consequence in practical applications where a restrictor used to contain the flame and create a recirculation zone can be avoided, by injecting a swirling component in the axial coflow air without compromising the combustion chemistry. However, at lower atomizing pressures the CH* profiles are identical, pointing to the fact that atomization, although consuming negligibly higher air supply, has a defining effect on CH* concentration, and this can be further affected by altering coflow air supply rate.
Images with 470 nm Optical Bandpass filter (HCHO)
Figures 64 to 73 show images obtained using a 470 nm filter with a DSLR camera. These images provide a representation of the average formaldehyde (HCHO) concentration over the flame structure. Formaldehyde and soot have a strong correlation and studying HCHO
profiles in the reducing diffusion flame was considered necessary. Figure 64 shows a effect of coflow air on HCHO profiles. As coflow air flow rate is increased, the HCHO
Figures 66 and 67 show that atomization has a larger effect on biodiesel HCHO profiles than diesel. The increased atomization results in a longer and less intense biodiesel flame.
Figure 64 ma: 21 lpm, Diesel mf: 0.029 kg/min
mCP in lpm (from left to right): (a) 100, (b) 60
Figure 65 ma: 12 lpm, Diesel mf: 0.024 kg/min
Figure 66 mCP: 100 lpm
ma in lpm (left to right): (a) 21, (b) 18, (c) 12
Diesel mf in kg/min (left to right): (a) 0.0301, (b) 0.0247, (c) 0.0238
Figure 67 mCP: 100 lpm
ma in lpm (left to right): (a) 21, (b) 18, (c) 12
Figure 68 mCS: 38 lpm
ma in lpm (left to right): (a) 21, (b) 18, (c) 12
Diesel mf in kg/min (left to right): (a) 0.0301, (b) 0.0247, (c) 0.0238
Figure 69 mCS: 38 lpm
ma in lpm (left to right): (a) 21, (b) 18, (c) 12
Figure 70 Diesel Combustion with Tandem Parallel-Swirl Coflow
Left to right (in lpm): (a) 100 mCP, 23 mCS, (b) 70 mCP, 28 mCS, (c) 60 mCP, 38 mCS
ma: 21 lpm, mf: 0.0297 kg/min
Figure 71 Diesel Combustion with Tandem Parallel-Swirl Coflow
Left to right (in lpm): (a) 100 mCP, 23 mCS, (b) 70 mCP, 28 mCS, (c) 60 mCP, 38 mCS
Figure 72 Biodiesel Combustion with Tandem Parallel-Swirl Coflow Left to right (in lpm): (a) 100 mCP, 23 mCS, (b) 70 mCP, 28 mCS, (c) 60 mCP, 38 mCS
ma: 21 lpm, mf: 0.0330 kg/min
Figure 73 Biodiesel Combustion with Tandem Parallel-Swirl Coflow
Left to right (in lpm): (a) 100 mCP, 23 mCS, (b) 70 mCP, 28 mCS, (c) 60 mCP, 38 mCS
Spray Angle Experiments
The images shown in Figure 74 are obtained with a Phantom High Speed camera at a frame rate of 3000 frames per second. These images are composed of individual droplets and cannot be used to calculate the spray angle, for which several images have to be collated together. The imfuse ( ) command in Matlab's Image Processing Toolbox has been used to superimpose 200 images and obtain an image shown in Figure 76. Figure 75 is an image obtained after collating 4 images and shows the effect of using a large number of frames that were obtained within a short time span. The image is a matrix, whose size is dependent on the resolution, has each of its cells represented by a number between 0 and 255. This is an 8-bit grayscale image. The matrices were observed carefully and it was noted that the column where the intensity of light reduced sharply, unsurprisingly displayed a sharp change in the grayscale value as well. These values were noted to be between 30 and 50. This position was noted while scanning each row of the matrix from right to left and left to right . It has been left to the discretion of the user to decide the threshold value. These locations were then fit with a linear curve, the slope of which provided the spray angle.
The rate of decrease of spray angle reduces with increasing pressure possibly due to the siphon action of the nozzle. The rate at which fluid is drawn into the nozzle mixing chamber increases as air inlet pressure (and consequently flow rate) increases. However the fluid flow rate peaks at a certain air pressure and reduces as air flow rate is further increased. This is caused due to constricted flow area in the nozzle mixing chamber, which leaves smaller volume available to be occupied by the liquid. The spray angles for water are larger than spray angles for diesel due to higher viscosity of diesel. Dynamic viscosity of water is 8.9 x 10⁻⁴ Pa.s. while that of diesel is 2.47 x 10⁻³ Pa.s. This impedes secondary atomization of diesel causing a smaller spread. The spray angles of water sprays have a large range. For instance, at 8 lb/in2 air injection pressure, the spray angle is 68degrees, while at 80 lb/in2 it is 32 degrees. In contrast to this large decrease, the spray angle for diesel decreases from 44 degrees to 32 degrees as the air injection pressure is increased from 8 lb/in2 to 80 lb/in2. Also the difference between water and diesel spray angles is less at high injection velocities. This points to the fact, that as the effect of inertial forces increases, the effect of viscosity is nullified.
Droplet Size Experiment
The Sauter Mean Diameters of water and diesel sprays were measured using a Malvern Spraytec Particle Size Analyzer. Figures 81, 82 , and 83 show the variation of spray
parameters with respect to changing inlet flow conditions. As would be intuitively expected, the droplet size shows a decreasing trend as the fluid injection velocity is increased. Also, the primary atomization itself is affected by increasing inlet air pressure because the fluid
comment on the flow rate of the atomized fluid over the range of inlet pressures. Figure 81 shows that SMD of water sprays are larger than SMDs of diesel sprays at all air inlet pressures. A possible reason would be the higher surface tension of water (0.07 N/m) compared to diesel (0.029 N/m) which affects droplet break up. However this difference decreases as air inlet pressures increase. Similar to the spray angle experiment, where the viscous forces are negligible compared to inertial forces at high flow rates, the surface tension forces are negligible at high flow rates. Inertial forces dominate secondary
Figure 75 Collated Image of images shown in Figure 2
Figure 77 Individual Water Spray Angle Values obtained for a range of inlet air pressures and threshold grayscale values for Matlab program
Figure 78 Individual Diesel Spray Angle Values obtained for a range of inlet air pressures and threshold grayscale values for Matlab program
20 30 40 50 60 70 80 90
0 20 40 60 80 100
Sp ra y A ng le (d eg rees ) Pressure (psi)
Water Spray Cone Angles v. Pressure at
various threshold grayscales
grayscale 30 grayscale 33 grayscale 35 grayscale 37 grayscale 40 grayscale 43 20 30 40 50 60 70 80 90
0 20 40 60 80 100
Sp ra y A ng le (d eg rees ) Pressure (psi)
Diesel Spray Cone Angles v. Pressure at
various threshold grayscales
Figure 79 Plot of Spray Angle vs. Inlet Air Pressure
Working Fluid: Water
Figure 80 Plot of Spray Angle vs. Inlet Air Pressure
Working Fluid: Diesel
20 30 40 50 60 70 80 90
0 20 40 60 80 100
Sp ra y A ng le (d eg rees ) Pressure (psi)
Spray Angle v. Inlet Air Pressure
Water 20 30 40 50 60 70 80 90
0 20 40 60 80 100
Sp ra y A ng le (d eg rees ) Pressure (psi)
Spray Angle v. Inlet Air Pressure
Figure 81 Comparison of SMDs of Water and Diesel over a range of supply air pressures
Figure 82 Comparison of SMD i.e. D32 and D50 diameters for diesel spray over a range of supply air pressures
0 10 20 30 40 50 60 70 80
0 20 40 60 80
Dr op let Si ze (m ic ro ns )
Air Inlet Pressure (psi)
Comparison of Sauter Mean Diameters
D32 water D32 diesel 0 5 10 15 20 25 30 35 40 45 50
0 10 20 30 40 50 60 70
Dr op let siz e (m ic ro ns )
Air Inlet Pressure (psi)
Comparison of SMD and D50 of Diesel
Figure 83 Comparison of SMD i.e. D32 and D50 diameters for water spray over a range of supply air pressures
Figures 84 and 85 display the varying droplet size distributions of water and diesel sprays. These figures provide an indication of the droplet breakup phenomenon. For instance, Figure 84 (a) shows a bimodal distribution with two peaks. As injection velocity is raised the distribution becomes unimodal with a peak at the SMD. As injection pressure is further increased, the distribution shifts back to a bimodal distribution.
Figure 85 shows that diesel droplet breakup results in unimodal distributions over the entire range of inlet pressures. The plot of D50 and SMD versus injection pressures in Figure 82 is well represented in Figure 83.
0 10 20 30 40 50 60
0 20 40 60 80
Dr op let Si ze (m ic ro ns )
Air Inlet Pressure (psi)
Comparison of SMD and D50
of Water
Figure 84 Droplet Size Distributions of Water Spray pa in psi (clockwise): (a) 5, (b) 10, (c) 50, (d) 20
Emissions
An FGA 4000 XDS Gas Analyzer manufactured by California Instruments was used to measure emissions in the combustion exhaust. The setup has been described in the results section of this report. The parallel and swirl coflow inlet velocities were varied and emissions
were measured for different combinations. The nozzle was supplied with air flowing at 12 lpm during this experiment because larger air supply would result in a taller flame, and subsequent contact of the flame with the fume hood which is undesirable. Table 1 and Table
2 display emissions results for different cases. The data in Table 1 consists of combustion with a total air supply of 110 lpm while Table 2 consists of combustion under 120 lpm air.
Table 1 Emissions results with 110 litre/min coflow
Sr. No. Parallel Coflow (litre/min) Swirling Coflow (litre/min) Fuel Flow Rate (kg/min) Nozzle Air Supply
(litre/min) HC (ppm) CO (% Vol.)
CO2 (%
Vol.) No(ppm) x
1 70 28
0.0235 12
25 0.01 10.03 69
2 70 28 13 0 9.45 77
3 70 28 17 0 10.81 70
4 60 38 32 0 12.51 73
5 60 38 16 0.01 12.45 73
6 60 38 39 0 12 79
Table 2 Emissions results with 120 litre/min coflow Sr.
No. Parallel Coflow (litre/min) Swirling Coflow (litre/min) Fuel Flow Rate (kg/min) Nozzle Air Supply
(litre/min) HC (ppm) CO (% Vol.)
CO2 (%
Vol.) No(ppm) x
1
70 38 0.0235 12
29 0.01 12.56 66
2 25 0.02 13.31 68
3 19 0 12.13 76
The Tables 1 and 2 show that NOx emissions lie in the range of 70 to 80 ppm, carbon
monoxide emissions are negligibly small, HC emissions vary from anywhere between 15 and 30 ppm, and CO2 emissions remain virtually constant between 9% and 12% by volume. In Table 1, swirling coflow does not result in an appreciable reduction in NOx as some literature suggests, possible due to the small difference between the input settings of Table 1. Changing the input settings to 30 lpm parallel coflow and 68 lpm swirling coflow might present a different picture. Also, Table 2 does not point to a significant change in emissions as total air supply for combustion is increased by 10 lpm. Increasing the air supply to 200 lpm might provide different results but it was considered undesirable for the quartz material from the point of view of rising temperatures with leaner combustion. The two tables however provide a range of values of emissions under a set of fuel and air input conditions. The sampling was done after operating the burner for 30 to 40 seconds and the console of the gas analyzer displayed a rising value of NOx emissions and a reducing value of HC emissions before stabilizing. The results presented above are preliminary in nature and require further experimentation under controlled conditions for corroboration.
Table 3 Emissions Results with 160 litre/min and 138 litre/min Coflow
Parallel Coflow Swirling Coflow Air to Nozzle HC CO CO2 NOx
litre/min litre/min litre/min ppm % % ppm
100 60 12
0 0.01 11.96 59 0 0.01 10.57 73 5 0 9.37 73 7 0 10.89 75
100 38 12
5 CONCLUSIONS
This report documents combustion characteristics of a liquid spray flame from an air assisted swirl atomizer. Images of the flame with a DSLR camera were obtained at long and short exposure times with a neutral density filter, a 430 nm CH* filter and a 470 nm HCHO filter. The Coflow air was provided in a parallel and swirl configuration and the effect of varying the inlet mass flow rate was observed for both configurations. Also, the effect of varying inlet air mass flow rate to the atomizer was observed. In a separate set of experiments, the spray cone angle of water and diesel were obtained using a Phantom high speed camera. Droplet size distributions were obtained using a Malvern Spraytec particle size analyzer. The following conclusions can be established as a result of these efforts:
1) The effect of varying the coflow inlet mass flow rate on flame height is negligible. However, for the same inlet coflow mass flow rate, swirling coflow results in shorter and wider flames than parallel coflow.
2) Introduction of swirling coflow in parallel coflow results in reduction of flame height due to reduced axial momentum of the combusting mixture. This is seen for the case of 123 litre/min parallel-swirl tandem coflow versus 100 lpm parallel coflow. 3) The atomizer has a defining effect on combustion. For the same coflow mass flow
4) At the same primary atomization and coflow settings, biodiesel flames were observed to be shorter than diesel flames, possibly due to the higher density and viscosity of biodiesel impeding droplet travel.
5) Neutral Density filter images display a kink in the flame profile at a small distance away from the nozzle tip under parallel coflow. The kink moves farther away from the nozzle tip as coflow velocity is further increased. The occurrence of this phenomenon can be studied in the future.
6) Chemiluminescence images displayed higher concentration of formaldehyde and CH* radicals in coarsely atomized sprays. Also, CH* and HCHO concentrations were observed to be concentrated near the nozzle tip with increasing percentage of swirl while the spread of the emissions was significantly reduced. This points to the fact that swirl increases residence times of the droplet in the near nozzle region whereas parallel coflow tends to push the droplet further downstream before combustion is complete.
7) High Speed photography results show the spray angle to decrease with increasing inlet air mass flow rate. The rate of increase of spray angle with respect to the increase of air mass flow rate was seen to decrease in the case of water as well as diesel sprays. Also, the spray angles for water and diesel sprays at higher injection velocities are similar, pointing to the fact that inertial forces dominate viscous effects at these flow conditions.
seen to decrease from 30 microns at 8 psig air inlet pressure to 20 microns at 20 psig air inlet pressure, indicating that this atomizer is economical. DSDs of water are bimodal whereas DSDs of diesel are unimodal.
7 REFERENCES
[1] Kufferath, A., Wende, B., Leuckel, W., "Influence of liquid flow conditions on spray characteristics of internal-mixing twin-fluid atomizers", International Journal of Heat and Fluid Flow, 20 (1999) 513-519
[2] Kushari, A., " Effect of injector geometry on the performance of an internally mixed liquid atomizer", Fuel Processing Technology, 91 (2010) 1650–1654
[3] Lal, S., Kushari, A., Gupta, M., Kapoor, J.C., Maji, S., " Experimental study of an air assisted mist generator", Experimental Thermal and Fluid Science, 34 (2010) 1029– 1035
[4] Watanawanyoo, P., Mochida, H., Furukawa, T., Nakamura, M., Hirahara, H., " Experimental Study on the Spray Characteristics of an Air Assisted Atomizer with Internal Mixing Chamber", European Journal of Scientific Research, Vol.84 No.4 (2012), pp.507-521
[5] Yao, J., Sadatomi, M., "Performance Evaluation of an Air Assisted Atomizer with Liquid Siphon ", Journal of Applied Sciences, 13(22): 4985-4993, 2013
[6] Lui, F., " Review on Ejector Efficiencies in Various Ejector Systems", International Refrigeration and Air Conditioning Conference (2014), Paper 1553
[7] Sadatomi, M., Kawahara, A., Fukamachi, K., Matsuyama, F., Tanaka, N., "Development of a New Large-Flow-Rate and Efficient Mist Generator, and its application to air cooling in greenhouses", Multiphase Science and Technology, 22(1), 79–93 (2010)
[8] Tanno, S.,Miura, T., and Ohtani, S., "Atomization of high viscosity liquids by pneumatic nozzles", Proc. of ICALASS-85, London, LP/VB/6/1-8, 1985.
[9] Chen, G., Gomez, A., " Co-Flow Laminar Diffusion Flames of Monodisperse Sprays: Structure, Evaporation and Microgravity Effects", Combustion Science and
[10] Chen, G., Gomez, A., "Laminar Spray Diffusion Flames near the Transition from Group Combustion to Individual Droplet Burning", Combustion and Flame, 110:392- 404 ( 1997)
[11] Karpetis, A.N., Gomez, A., "An Experimental Study of Well-defined Turbulent Non Premixed Spray Flames", Combustion and Flame, 121:1-23 (2000)
[12] Chen, Y-C., Starner, S., Masri, A., "Characteristics of Turbulent Spray Combustion in a Piloted Jet Flame Burner", Proceedings of the Combustion Institute, Volume 29, 2002/pp. 625–632
[13] Masri, A., Gounder, J., "Turbulent Spray Flames of Acetone and Ethanol
approaching extinction", Combustion Science and Technology, 182: 702–715, 2010 [14] Reddy, V.M., Trivedi, D., Kumar, S., "Experimental Investigations on Lifted Spray
Flames for a Range of Coflow Conditions", Combustion Science and Technology, 184: 44–63, 2012
[15] Spraytec User Manual- MAN 0368, Malvern Instruments
Appendix A
Program to Calculate Spray Angle
%Program to superimpose images of spray on one another in order to find %spray angle
clc
p=input('Enter pressure in psi');
flag=input('Enter 1 for water, 2 for diesel');
%Triggering the camera results in obtaining a CINE file. This file is % a series of individual images.
% These images are stored in .tiff file format and named as ___.001.tiff, % ___.002.tiff etc.
% The Matlab program file is stored in the same folder as the image files
% This is a way to segregate files for water sprays and diesel sprays
if(flag==2)
str='d';
else if(flag==1)
str='w';
else
fprintf('Wrong flag entered');
end
end
% imfuse () allows collation of only 2 images at one instant. Collating % process is carried out iteratively in the loop below
A =imread([num2str(p) 'psi' str '.001.tiff']);
for i=2:9
B=imread([num2str(p) 'psi' str '.00' num2str(i) '.tiff']);
A=imfuse(A,B); end
for j=10:99
E=imread([num2str(p) 'psi' str '.0' num2str(j) '.tiff']);
A=imfuse(A,E); end
F=imread([num2str(p) 'psi' str '.100.tiff']);
A=imfuse(A,F);
% The rgb2gray function converts RGB images to grayscale by % eliminating the hue and saturation information while retaining % the luminance.
I=rgb2gray(A);
% imadjust is used to increase the contrast by saturating 1% of the data % at high and low intensities
C=imadjust(I)