Population Admixture May Appear to Mask, Change or Reverse Genetic Effects
of Genes Underlying Complex Traits
Hong-Wen Deng
Laboratory of Molecular and Statistical Genetics, College of Life Sciences, Hunan Normal University, ChangSha, Hunan 410081, People’s Republic of China and Osteoporosis Research Center and Department of Biomedical
Sciences, Creighton University, Omaha, Nebraska 68131 Manuscript received May 3, 2001
Accepted for publication August 16, 2001
ABSTRACT
Association studies using random population samples are increasingly being applied in the identification and inference of genetic effects of genes underlying complex traits. It is well recognized that population admixture may yield false-positive identification of genetic effects for complex traits. However, it is less well appreciated that population admixture can appear to mask, change, or reverse true genetic effects for genes underlying complex traits. By employing a simple population genetics model, we explore the effects and the conditions of population admixture in masking, changing, or even reversing true genetic effects of genes underlying complex traits.
THEORY
A
SSOCIATION studies have been widely used to helpdecipher the genetic basis of quantitative traits, Consider two large and randomly mating subpopula-such as the susceptibility to complex diseases. Despite tions, P1 and P2. Further assume that Hardy-Weinberg extensive efforts, the results in the identification and equilibrium holds at a biallelic marker locus (allelesQ inferences of genetic effects for complex traits from andq) which, for the purpose of simple illustration, is independent association studies often fail to reach con- assumed to be the functional mutation of a quantitative sensus. One such example is the association between the trait locus (QTL). The frequencies of the allele
Qin P1 vitamin D receptor (VDR) gene and bone mass (Eisman and P
2aref1 andf2, respectively. A large population P 1995;Peacock1995;Gonget al.1999), a major determi- is formed by admixture of individuals from P
1 (with a nant of osteoporosis (Deng et al. 2000a). Association
proportionp) and P2(with a proportion 1⫺p). studies differ in their findings on the significance of the
Let Qbe the functional allele causing larger pheno-VDR gene on bone mass variation. Further, studies that
typic values anda (⬎0) andddenote the additive and found the VDR gene significant differed in their
infer-dominance effects at the QTL (respectively), which are ences on the allelic effects (Houstonet al.1996;Gong
assumed to be the same in subpopulations P1 and P2. et al.1999).
Finally, let1and2denote the genotypic values of the Potential causes underlying the inconsistent
associa-genotypeqqin P1and P2. Assume, due to the complex tion studies are complex, including a number of
plausi-determination of the phenotypic values from environ-ble factors (genotype-by-environment interaction,
epista-mental factors and/or other genetic loci in the two sis, population differentiation, etc.), although no specific
subpopulations, that1⬆2. Without loss of generality, cause(s) has been unambiguously identified for any
spe-we assume2⫽ 0; hence1 represents the difference cial case. It is well known that one of the most important
of the mean phenotypic values of the complex trait of causes that may lead to the inconsistent results from
the genotypeqqin the two subpopulations. The geno-association studies is population admixture, which may
typic values of theQQ,Qq, andqqare, respectively,1⫹ induce false positives for genes not underlying complex
2a,1⫹a⫹d, and1in the subpopulation P1, and 2a, traits (Chakraborty and Smouse 1988; Deng and
a⫹d, and 0 in P2. LettingQQ,Qq, andqqdenote the Chen2000a;Deng et al.2001). It is much less well
ap-mean values of the genotypesQQ, Qq, and qq, respec-preciated that population admixture can mask, change,
tively, in the admixed population P, we have or reverse true genetic effects for genes underlying
com-plex traits. We employ a simple one-locus population
QQ⫽(1⫹2a)
f2 1p f2
1p⫹f22(1⫺p)
⫹2a f 2 2(1⫺p) f2
1p⫹f22(1⫺p) genetics model to explore some of the potential effects
of population admixture for association studies.
Q q⫽(1⫹a⫹d)
f1(1⫺f1)p
f1(1⫺f1)p⫹f2(1⫺f2)(1⫺p)
Address for correspondence:Osteoporosis Research Center, Creighton
University, 601 N. 30th St., Ste. 6787, Omaha, NE 68131. ⫹(a⫹d) f2(1⫺f2)(1⫺p)
f1(1⫺f1)p⫹f2(1⫺f2)(1⫺p)
E-mail: [email protected]
0⬍ 1⬍ 2a
k1
. (6)
qq⫽ 1
(1⫺f1)2p
(1⫺f1)2p⫹(1⫺f2)2(1⫺p).
Sincek1⬍0 whenf2⬍f1(Equation 3), the inequali-Clearly, ties of Equation 6 cannot hold. Therefore, when the
true genetic effect at the QTL is recessive in
subpopu-QQ⫽ 1⫻
f2 1p f2
1p⫹f22(1⫺p)
⫹2a (1a) lations P1and P2, it is impossible for an overdominant genetic effect at the QTL to be manifested in the admixed population P.
Q q⫽ 1⫻
f1(1⫺f1)p
f1(1⫺f1)p⫹f2(1⫺f2)(1⫺p)⫹a⫹d (1b) When the true genetic effect is additive at the QTL in subpopulations P1 and P2, (d ⫽ 0), from
Equa-qq⫽ 1
(1⫺f1)2p
(1⫺f1)2p⫹(1⫺f2)2(1⫺p). (1c) tion 5
Define ⫺a
k2
⬍ 1 ⬍ a k1
. (7)
k1⫽
f1(1⫺f1)p
f1(1⫺f1)p⫹f2(1⫺f2)(1⫺p)
⫺ f21p f2
1p⫹f22(1⫺p) Hence, we must first have ⫺a/k2 ⬍ a/ k1, implying from Equation 3 that
k2⫽ f
1(1⫺f1)p
f1(1⫺f1)p⫹f2(1⫺f2)(1⫺p)
⫺ (1⫺f1)2p
(1⫺f1)2p⫹(1⫺f2)2(1⫺p) w1⫽ ⫺(k1⫹k2)⬎0, (8)
where w1 is a function of the admixture proportion
k3⫽ f
2 1p f2
1p⫹f22(1⫺p)
⫺ (1⫺f1)2p
(1⫺f1)2p⫹(1⫺f2)2(1⫺p)
. (2)
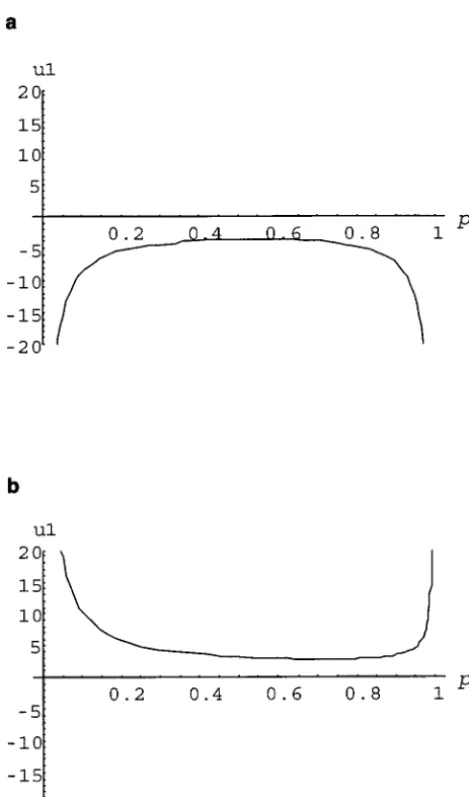
p(Equation 2). Figure 1a illustrates the functionw1 in Equation 8 to demonstrate intuitively the domain Note thatk1 ⫺k2 ⫹k3 ⫽0. It can be easily seen from ofpin whichw
1⬎0 for a particular set of parameters Equation 2 that
(f1⫽ 0.7 and f2 ⫽ 0.4). It is apparent from Figure 1a that, even when the true genetic effect is additive whenf2⬍f1, we havek1⬍ 0,k2⬎ 0, andk3⬎ 0;
at the QTL in subpopulations P1 and P2, there is a and large range ofpin which an overdominant effect can be incorrectly inferred in the admixed population P. whenf2⬎f1, we havek1⬎ 0,k2⬍ 0, andk3⬍ 0. In addition, the subpopulation mean
1 must also (3) fall within the regions between the two plotted lines
(1⫽ ⫺a/k2and1 ⫽a/k1) in Figure 1b when the In the following, we investigate the conditions under
true allelic effecta ⫽1. which the true genetic effects for a recessive, additive,
When the true genetic effect is dominant at the and dominant QTL are incorrectly inferred, due to
pop-QTL in subpopulations P1and P2(d⫽a), from Equa-ulation admixture, as overdominant, underdominant,
tion 5, no effect (the three genotypes have the same mean
phenotypic effect; i.e., the QTL effect is masked), or ⫺2a
k2
⬍ 1⬍0. (9) reversed (the alleleqis associated with larger phenotypic
values). Other genetic models (as reflected by different
Hence, we first must satisfy⫺2a/k1 ⬍0, from which dvalues) can be easily investigated using the approach
we must havek2⬎ 0, which is satisfied for any value we outline below.
of p between 0 and 1 when f2 ⬍f1 (Equation 3). As an example to demonstrate our theoretical
ap-Hence, as long as 1 is between the x-axis and the proach, we derive in detail the conditions under which
line 1 ⫽ ⫺2a/k2 in Figure 1c (where the additive the genetic effect at the QTL appears to be
overdomi-effecta⫽1), an overdominant genetic effect will be nant in the admixed population P. Under this scenario,
detected in the admixed population P even if the true we have Qq ⬎ QQ and Qq ⬎ qq. From Equations 1
genetic effect of the QTL is dominant in the large and and 2,
randomly mating subpopulations P1and P2.
1⫻ k1⫹ d⫺a ⬎0 and 1⫻k2⫹a ⫹d⬎ 0. 2. When f2 ⬎ f1, it can be shown as above that, when (4) the true genetic effect at the QTL is recessive in P1 Hence, and P2, it is impossible for an overdominant genetic effect at the QTL in the admixed population P to 1. Whenf2⬍f1, from Equations 3 and 4, it is apparent
exist. When the true genetic effect is additive at the that
QTL in P1 and P2, we must have a/k1⬍ 1⬍ ⫺a/k2 and thusw2⫽k1⫹k2⬎0 for overdominance. Finally, ⫺ (a ⫹d)
k2
⬍ 1⬍ a⫺d
k1
. (5) when the true genetic effect is dominant, we must
have 0⬍ 1⬍2a/k2 and thus 0⬍ ⫺2a/k2, which is When the true genetic effect is recessive at the QTL satisfied for any value of p between 0 and 1 when
Figure 2.—The conditions under which the true allelic effect is masked by population admixture.a⫽1 andf2⫽0.4. (a) f1 ⬎ f2. (b) f1 ⬍ f2. The situations under which f1 ⫽ 0.7 and 0.1 are studied, respectively. The parameter space includes the two lines drawn fordand1.
ated with smaller phenotypic values can be similarly derived. These conditions are summarized in Table 1. Figures 2 and 3 illustrate the conditions under two situa-tions (f2 ⬍ f1 and f2 ⬎ f1) when the genetic effect at the QTL is masked or reversed by population admixture.
Figure1.—The conditions for overdominant effects in the
admixed population P whenf2⬍f1·a⫽1,f2⫽0.4,f1⫽0.7, DISCUSSION and2⫽0. (a and b) Additive. (c) Dominance. Under additive
Through a simple one-locus population genetics model, effect, the parameter space for overdominant effects includes
the area covered above thex-axis and under the curve shown we demonstrate that there is a large range of parameter in a and the area covered between the two lines drawn in b. space in which population admixture changes the ge-Under dominant effects, the parameter space for overdomi- netic effects of genes underlying complex traits. In par-nant effects includes the area covered between the x- and
ticular, the parameter space in which population admix-y-axes and the line drawn in c.
ture may mask or reverse the genetic effects of genes underlying complex traits is not trivial. The parameters that are relevant in our simple one-locus genetics model The conditions under which the genetic effect at the
QTL in population P is manifested as underdominant, include the mean phenotypic values in different sub-populations, the genetic effects (the magnitude such as or is masked so that no genetic effect at the QTL is
TABLE 1
The conditions under which the genetic effect at a QTL is incorrectly inferred as overdominant, underdominant, no effect, or reversed effect
Overdominant Underdominant No effect Reversed effect
True effect f2⬍f1 f2⬎f1 f2⬍f1 f2⬎f1 f2⬍f1 f2⬎f1 f2⬍f1 f2⬎f1
Recessive 2a
k1
⬍ 1⬍0 0⬍ 1
2a k1
d⫽a(k2⫹k1) k2⫺k1
Additive ⫺a k2
⬍ 1⬍ a k1
a k1
⬍ 1⬍ ⫺
a k2
a k1
⬍ 1⬍ ⫺
a k2
⫺a k2
⬍ 1⬍ a k1
and 1⬍ ⫺
2a k3
1⬎ ⫺ 2a k3
Dominant ⫺2a k2
⬍ 1⬍0 0⬍ 1⬍ ⫺
2a k2
1⫽ ⫺ 2a k2⫺k1
Parameters are described in text.
frequencies at the QTL, and the admixture parameter p.It should be noted that when we investigate the effect of population admixture in masking the true genetic effects of a QTL, we explore the conditions under which the genotypic effects of all the genotypes of the QTL are exactly the same in the admixed population. In practice, the conditions under which population admix-ture may mask genetic effects of a QTL may be much less stringent. This is because as long as population admixture reduces the difference of the genotypic ef-fects of a QTL to an extent that is difficult to be detected powerfully by sample sizes regularly employed in associa-tion studies, true genetic effects of the QTL will likely be masked by population admixture. Although some similar phenomena may have been noted in epidemiol-ogy studies (see example 12.5 inArmitageandBerry
1987), there has been no study like this one that explic-itly addresses the effects of population admixture in changing, masking, or reversing the genetic effects of genes underlying complex traits.
Population association studies have certain advan-tages such as being powerful and relatively easy to recruit study subjects and thus are currently promoted (Risch
andTeng1998;MortonandCollins1999) and com-monly employed for seemingly large and randomly mat-ing populations (Deng et al. 1999). However, popula-tion admixture is often difficult to detect (Denget al. 2001). This study suggests that in addition to the poten-tial false-positive (significant) effects that are often em-phasized for population admixture studies (
Chakra-bortyandSmouse1988;DengandChen2000a;Deng
et al.2001), false-negative (nonsignificant) results induc-ible by population admixture should not be ignored. This is particularly important in metaanalyses of incon-sistent association results, where negative association
Figure 3.—The conditions under which the true allelic results have (incorrectly) been regarded as robust (to effect is reversed by population admixture.a⫽ 1 andf2⫽ population admixture) and positive results have been 0.4. (a)f1⬎f2. (b)f1⬍f2. The situations under whichf1⫽ regarded as potentially being confounded by popula-0.7 and 0.1 are studied, respectively. The parameter space
tion admixture. Our result should also be noted in QTL includes those under the curve drawn (whenf1⬎f2) in a and
re-(30025025) from National Science Foundation of China, and a grant
sults using the association study approach (Dengand
from HuNan Normal University.
Chen2000b;Denget al.2000b). This is because a true QTL in a genomic region identified via robust linkage studies may not be detected in fine mapping studies
using the association approach, since the genetic effects LITERATURE CITED may be masked in the collected sample due to potential
Allison, D. B.,1997 Transmission-disequilibrium tests for
quantita-population admixture. tive traits. Am. J. Hum. Genet.60:676–690.
It is not unusual that reverse genetic effects have been Armitage, P.,andG. Berry,1987 Statistical Methods in Medical Re-search.Blackwell, Oxford.
found in some association studies. For example, in the
Chakraborty, R.,andP. Smouse,1988 Recombination in
haplo-genetic studies of the VDR gene for osteoporosis, some types leads to biased estimates of admixture proportions in hu-studies find that theb allele is associated with higher man populations. Proc. Natl. Acad. Sci. USA85:3071–3074.
Deng, H. W.,andW. M. Chen,2000a Re: “Biased tests of association:
bone mass than the B allele, while others found the
comparison of allele frequencies when departing from
Hardy-opposite effect (Houstonet al.1996;Denget al.1999). Weinberg proportions.” Am. J. Epidemiol.151:335–357. The reverse genetic effects are generally attributable Deng, H. W.,andW. M. Chen,2000b QTL fine mapping in extreme
samples of finite populations for complex traits with familial
to different phases (repulsionvs. coupling) of linkage
correlation due to polygenes. Am. J. Hum. Genet.67:259–261.
disequilibrium between a marker locus and a functional Deng, H. W., J. Li, J. L. Li, M. JohnsonandR. R. Recker,1999 Asso-mutation locus (Houstonet al.1996). While this may ciation of VDR and ER genotypes with bone mass in postmeno-pausal women: different conclusions with different analyses.
Os-be plausible, our study shows that this is not the only
teoporosis Int.9:499–507.
explanation and that population admixture may induce Deng, H. W., W. M. Chen, S. Recker, M. R. Stegman, J. L. Liet al., reverse genetic effects at the QTLper se.It is a common 2000a Genetic determination of Colles’ fractures and differen-tial bone mass in women with and without Colles’ fractures. J.
practice to infer the genetic effects (such as dominant,
Bone Miner. Res.15:1243–1252.
additive, or recessive) at candidate genes when signifi- Deng, H. W., W. M. ChenandR. R. Recker,2000b QTL fine map-cant effects are found in population association studies ping by measuring and testing for Hardy-Weinberg and linkage disequilibrium at a series of linked marker loci in extreme samples
(e.g., Denget al.1999). It can be foreseen that, since
of populations. Am. J. Hum. Genet.66:1027–1045.
population association studies are powerful in fine map- Deng, H. W., W. M. ChenandR. R. Recker,2001 Population admix-ping genes underlying complex traits, when a true QTL ture: detection by Hardy-Weinberg test and its quantitative effects on linkage-disequilibrium methods for localizing genes
underly-is identified with the association approach, the results
ing complex traits. Genetics157:885–897.
may be used to infer the allelic and mutational effects. Eisman, J. A.,1995 Vitamin D receptor gene alleles and osteoporosis: Such inference may be critical for subsequent molecular an affirmative view. J. Bone Miner. Res.10:1289–1293.
Gong, G. D., H. S. Stern, S. C. Cheng, N. Fong, J. Mordesonet al.,
studies in studying the function and the regulation of
1999 The association of bone mineral density and Vitamin-D
the gene and its product. However, a correct inference receptor gene polymorphisms. Osteoporosis Int.9:55–64. of allelic effects may be compromised by the results Houston, L. A., S. F. Grant, D. M. ReidandS. H. Ralston,1996
Vitamin D receptor polymorphism, bone mineral density, and
from the population association alone due to the
poten-osteoporotic vertebral fracture: studies in a UK population. Bone
tial effect of population admixture in reversing the ge- 18:249–252.
Morton, N. E.,andA. Collins,1999 Tests and estimates of allelic
netic effects of the QTL. Therefore, approaches robust
association in complex inheritance. Proc. Natl. Acad. Sci. USA
to population admixture in testing association and
link-95:11389–11393.
age (e.g.,Spielmanet al.1993;Allison1997) may need Peacock, M.,1995 Vitamin D receptor gene alleles and osteoporosis:
a contrasting view. J. Bone Miner. Res.10:1294–1297.
to be used for the results to be confirmed.
Risch, N.,andJ. Teng,1998 The relative power of family-based
Research assistance from graduate student Y. Li is appreciated. I and case-control designs for linkage disequilibrium studies of
thank Professor B. Walsh and two anonymous reviewers for their complex human diseases. I. DNA polling. Genome Res.8:1273–
1288. constructive comments that helped to improve this article. H.-W. Deng
Spielman, R. S., R. E. McGinnisandW. J. Ewens,1993 Transmission was partially supported by grants from Health Future Foundation,
test for linkage disequilibrium: the insulin gene region and insu-National Institutes of Health grants (R01 GM60402-01A1, K01
lin-dependent diabetes mellitus (IDDM). Am. J. Hum. Genet.52:
AR02170-01, R01 AR45349, and P01 DC01813-07), grants from State 506–516.
of Nebraska Cancer and Smoking Related Disease Research Program,