The Molecular Genetics and Evolution of Red and
Green Color Vision in Vertebrates
Shozo Yokoyama and F. Bernhard Radlwimmer
Department of Biology, Syracuse University, Syracuse, New York 13244 Manuscript received March 19, 2001
Accepted for publication May 29, 2001
ABSTRACT
To better understand the evolution of red-green color vision in vertebrates, we inferred the amino acid sequences of the ancestral pigments of 11 selected visual pigments: the LWS pigments of cave fish (Astyanax fasciatus), frog (Xenopus laevis), chicken (Gallus gallus), chameleon (Anolis carolinensis), goat (Capra hircus), and human (Homo sapiens); and the MWS pigments of cave fish, gecko (Gekko gekko), mouse (Mus musculus), squirrel (Sciurus carolinensis), and human. We constructed these ancestral pigments by introducing the necessary mutations into contemporary pigments and evaluated their absorption spectra using anin vitro assay. The results show that the common ancestor of vertebrates and most other ancestors had LWS pigments. Multiple regression analyses of ancestral and contemporary MWS and LWS pigments show that single mutations S180A, H197Y, Y277F, T285A, A308S, and double mutations S180A/H197Y shift themax of the pigments by⫺7,⫺28,⫺8,⫺15,⫺27, and 11 nm, respectively. It is most likely that this “five-sites” rule is the molecular basis of spectral tuning in the MWS and LWS pigments during vertebrate evolution.
H
UMAN color vision is achieved through three mainly by A180/F277/A285 (amino acids A, F, and A types of photosensitive molecules: short wave- at sites 180, 277, and 285, following the amino acid site length- (or blue-) sensitive (SWS), middle wavelength- numbers in the human LWS/MWS pigments, respec-(or green-) sensitive (MWS), and long wavelength- respec-(or tively) and S180/Y277/T285, respectively (Yokoyama red-) sensitive (LWS) visual pigments, which absorb andYokoyama1990;Neitzet al.1991;Chanet al.1992; light maximally (max) at ⵑ420, ⵑ530, and ⵑ560 nm, Merbs and Nathans 1993; Asenjo et al. 1994). The respectively (Boynton 1979). However, having only spectral sensitivities of some MWS pigments from such SWS pigments and either MWS or LWS pigments, most species as mouse (Mus musculus), rat (Rattus norvegicus), mammals have dichromatic color vision. This condition and rabbit (Oryctolagus cuniculus), however, cannot be is commonly known as “red-green color blindness.” explained by this “three-sites” rule and require amino Even in human, the “red-green color blindness” is rela- acid changes at two entirely new sites: 197 and 308 tively common, affectingⵑ8% of males (Kalmus1965). (Sun et al. 1997; Radlwimmer and Yokoyama 1998; When diverse species are surveyed, themaxof most LWS Yokoyamaand Radlwimmer1998, 1999). It was sug-pigments ranges from 550 to 560 nm, while the MWS gested that S180A (amino acid replacement S→A at pigments detect a wider range of light withmaxatⵑ510– site 180), H197Y, Y277F, T285A, and A308S shift the 540 nm (Yokoyama2000a). All of these pigments be- maxof the LWS/MWS pigments toward green by 7, 28, long to a specific evolutionary group, often referred to 7, 15, and 16 nm, respectively, and the reverse changes as the LWS/MWS group (Yokoyama and Yokoyama toward red by the same amounts (Yokoyamaand Radl-1996;Yokoyama 1997, 1999, 2000a; Ebrey and Kou- wimmer1999). This five-sites rule explains themax of
talos2001). virtually all LWS/MWS pigments of vertebrates. The
Each visual pigment consists of a chromophore, 11- MWS pigment of bottlenose dolphin (Tursiops truncatus) cis-retinal, and a transmembrane protein, opsin, which is an exception, where the observed
maxis 13 nm lower is encoded by a specific opsin gene. The SWS, MWS, than the expected value from this five-sites rule (Yoko-and LWS opsin genes were cloned for the first time yamaandRadlwimmer1999). Thus, the details of the from human (Nathans et al. 1986). Since then, the mechanisms of spectral tuning in the MWS and LWS mechanisms of spectral tuning in the MWS and LWS pigments are still not fully understood.
pigments of vertebrates have been studied extensively. The evolution of red-green color vision was also stud-It was shown that the spectral sensitivities of the MWS ied by inferring the amino acid sequences at the five and LWS pigments in human and fish are determined
critical sites of the ancestral pigments. Comparing the MWS and LWS pigments from human and fish (Astyanax fasciatus), it was suggested that the LWS pigments in Corresponding author:Shozo Yokoyama, Biological Research
Labora-these species evolved from the ancestral MWS pigment tories, Department of Biology, Syracuse University, 130 College Pl.,
Syracuse, NY 13244. E-mail: syokoyam@mailbox. syr.edu independently (YokoyamaandYokoyama1990). The
evolution of the LWS pigment from the MWS pigment was also suggested byJacobs(1993) andWinderickx et al.(1992), but the primate ancestor appears to have had the LWS pigment (Neiet al.1997). It is also specu-lated that the mammalian ancestor had the MWS pig-ment (Yokoyama and Radlwimmer 1999). In these analyses, the absorption spectra of ancestral pigments were not evaluated. Without having the actual absorp-tion spectra of the ancestral pigments, the evoluabsorp-tionary results of red-green color vision remain speculative.
However, once the amino acid sequences and max of Figure 1.—Oligonucleotide primers for RT-PCR amplifi-such ancestral visual pigments are determined, we can cation of red and green opsin mRNAs. TheEcoRI andSalI sites study not only the evolutionary processes of LWS/MWS are boxed in the forward and reverse primers, respectively, and were used for cloning into the expression vector pMT5. A pigments directly but also the molecular bases of
red-Kozak sequence (CCACC) was inserted between theEcoRI site green color vision through time.
and the initiation codon to promote translation. Here, we infer the amino acid sequences of ancestral
pigments from contemporary sequences, construct the
ancestral pigments, evaluate theirmax, and test the valid- et al. 1988). These plasmids were expressed in COS1 cells ity of the five-sites rule during vertebrate evolution. To by transient transfection. The pigments were regenerated by accomplish the first three goals, we consider 11 pig- incubating the opsins with 11-cis-retinal (Storm Eye Institute, Medical University of South Carolina) and purified using im-ments: the LWS pigments of human, goat (Capra hircus),
mobilized 1D4 (The Culture Center, Minneapolis, MN) in American chameleon (Anolis carolinensis), chicken (
Gal-buffer W1 [50 mmN-(2-hydroxyethyl) piperazine-N⬘ -2-ethane-lus gal-2-ethane-lus), clawed frog (Xenopus laevis), and cave fish sulfonic acid (HEPES; pH 6.6), 140 mmNaCl, 3 mmMgCl
2, (A. fasciatus) and the MWS pigments of human, squirrel 20% (w/v) glycerol, and 0.1% dodecyl maltoside], as pre-(Sciurus carolinensis), mouse (M. musculus), gecko (Gekko viously described (Yokoyama2000b).
Mutants were generated by using the QuickChange site-gekko), and cave fish (A. fasciatus). The results suggest
directed mutagenesis kit (Stratagene, La Jolla, CA). All DNA that virtually all ancestral pigments had amino acids
fragments that were subjected to mutagenesis were sequenced SHYTA (amino acids S, H, Y, T, and A at sites 180, 197, to rule out spurious mutations. UV-visible spectra were re-277, 285, and 308, respectively) and were red sensitive. corded at 20⬚using a Hitachi U-3000 dual beam spectropho-Statistical and mutagenesis analyses show that the five- tometer. Visual pigments were bleached for 3 min using a 60-W standard light bulb equipped with a Kodak Wratten #3 sites rule, now including the synergistic effect of amino
filter at a distance of 20 cm. Data were analyzed using Sig-acid sites 180 and 197, fully explains the variation in the
maplot software ( Jandel Scientific, San Rafael, CA). spectral sensitivity of all ancestral and currently known
Sequence data analyses: The sources of the amino acid LWS/MWS pigments in vertebrates, including the dol- sequences of the MWS and LWS pigments of different verte-phin MWS pigment. brate species are given in Table 1, where both of their amino acid sequences andmaxare known. So far, with the exception of the chicken, frog, and cave fish pigments, theirmax’s have been evaluated usingin vitroassay.
MATERIALS AND METHODS
We selected two fish, two frog, two reptile, and one bird LWS/MWS pigments (Table 1). The numbers of mammalian
cDNA cloning and DNA sequencing:Total retinal RNAs of
pigments withmaxatⵑ510,ⵑ530, andⵑ560 nm are 4, 7, and chicken (Gallus gallus) and frog (Xenopus laevis) are gifts from
6, respectively (Table 1), from which we selected 1, 2, and 2 Dr. Mary Pierce at the SUNY Upstate Medical University at
pigments, respectively. Thus, with respect to the phylogenetic Syracuse, and that of cave fish (A. fasciatus) was isolated using
and spectral diversities, these 11 pigments represent every the procedure of Yokoyama et al. (1995). Figure 1 shows
segment of currently known LWS/MWS pigments in verte-reverse transcription (RT)-PCR primers used to amplify the
brates. The phylogenetic relationship of fish, frog, reptiles, four types of full-length opsin cDNAs.
and mammals is well established (e.g., seeKumarandHedges For each set of primers, cDNA was reverse transcribed at
1998), but that of human, goat, and rodents is unclear ( Nova-42⬚for 1 hr and at 95⬚for 5 min, and then PCR was carried out
cek 1992; De Jong 1998; Shoshani and McKenna 1998; for 30 cycles at 94⬚ for 45 sec, 55⬚ for 1.5 min, and 72⬚ for
Huchon et al.1999;Liu andMiyamoto 1999;Waddell et 2 min. PCR products were gel isolated and subcloned into the
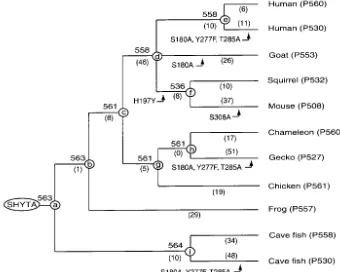
T-tailed EcoRV-digested Bluescript plasmid vector with T-over- al.1999a,b;Madsenet al. 2001;Murphyet al.2001). Thus, they are assumed to be equally distantly related. Accordingly, hang attached to 3⬘ ends (Hadjeb and Berkowitz 1996).
Nucleotide sequences of the entire region of the cDNA clones we consider the phylogenetic relationship [((((human (P560), human (P530)), goat (P553), (squirrel (P532), mouse were determined by cycle sequencing reactions using the
Sequitherm Excell II long-read kits (Epicentre Technologies, (P508))), ((chameleon (P560), gecko (P527)), chicken (P561))), frog (P557)), (cave fish (P558), cave fish (P530))]. Madison, WI) with dye-labeled M13 forward and reverse
prim-ers. Reactions were run on a LI-COR (Lincoln, NE) 4200LD On the basis of this tree topology, we infer the ancestral se-quences of the opsins by using a computer program, PAML, automated DNA sequencer.
Expression and spectral analyses of pigments: The PCR- based on a likelihood-based Bayesian method (Yang et al. 1995;Yang1997). In the inference, paralogous bovine RH1 amplified opsin cDNAs were subcloned into the EcoRI and
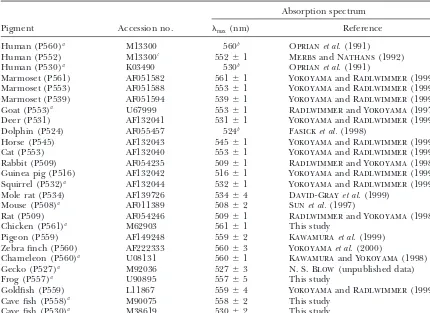
TABLE 1
Vertebrate LWS and MWS pigments
Absorption spectrum
Pigment Accession no. max(nm) Reference
Human (P560)a M13300 560b Oprianet al.(1991)
Human (P552) M13300c 552⫾1 MerbsandNathans(1992)
Human (P530)a K03490 530b Oprianet al.(1991)
Marmoset (P561) AF051582 561⫾1 YokoyamaandRadlwimmer(1999)
Marmoset (P553) AF051588 553⫾1 YokoyamaandRadlwimmer(1999)
Marmoset (P539) AF051594 539⫾1 YokoyamaandRadlwimmer(1999)
Goat (P553)a U67999 553⫾1 RadlwimmerandYokoyama(1997)
Deer (P531) AF132041 531⫾1 YokoyamaandRadlwimmer(1999)
Dolphin (P524) AF055457 524b Fasicket al.(1998)
Horse (P545) AF132043 545⫾1 YokoyamaandRadlwimmer(1999)
Cat (P553) AF132040 553⫾1 YokoyamaandRadlwimmer(1999)
Rabbit (P509) AF054235 509⫾1 RadlwimmerandYokoyama(1998)
Guinea pig (P516) AF132042 516⫾1 YokoyamaandRadlwimmer(1999)
Squirrel (P532)a AF132044 532⫾1 YokoyamaandRadlwimmer(1999)
Mole rat (P534) AF139726 534⫾4 David-Grayet al.(1999)
Mouse (P508)a AF011389 508⫾2 Sunet al.(1997)
Rat (P509) AF054246 509⫾1 RadlwimmerandYokoyama(1998)
Chicken (P561)a M62903 561⫾1 This study
Pigeon (P559) AF149248 559⫾2 Kawamuraet al.(1999)
Zebra finch (P560) AF222333 560⫾3 Yokoyamaet al.(2000)
Chameleon (P560)a U08131 560⫾1 KawamuraandYokoyama(1998)
Gecko (P527)a M92036 527⫾3 N. S. Blow(unpublished data)
Frog (P557)a U90895 557⫾5 This study
Goldfish (P559) L11867 559⫾4 YokoyamaandRadlwimmer(1999)
Cave fish (P558)a M90075 558⫾2 This study
Cave fish (P530)a M38619 530⫾2 This study
Cat,Felis catus; cave fish,Astyanax fasciatus; chameleon,Anolis carolinensis; chicken,Gallus gallus; deer,Odocoileus virginianus; dolphin, Tursiops truncatus; frog, Xenopus laevis; gecko, Gekko gekko; goat, Capra hircus; goldfish, Carassius auratus; guinea pig,Cavia porcellus; horse,Equus caballus; human,Homo sapiens; marmoset,Callithrix jacchus; mole rat,Spalax ehrenbergi; mouse,Mus musculus; pigeon,Columba livia; rabbit,Oryctolagus cuniculus; rat,Rattus norvegicus; squirrel,Sciurus carolinensis; zebra finch,Taeniopygia guttata.
aSequences used to infer the ancestral pigments of vertebrates. bNo standard error is provided.
cSee alsoWinderickxet al.(1992).
chameleon SWS1 (AF134194), and chicken SWS2 (M92037) chicken, frog, and cave fish. The regenerated pigments pigments were used as the outgroup (for the description of show two absorption peaks, one at ⵑ280 nm and an-these classes of pigments, seeYokoyamaandYokoyama1996;
other at 530–561 nm (Figure 2). When these pigments Yokoyama1997, 1999, 2000a;EbreyandKoutalos2001).
are exposed to light, the second peak shifts to ⵑ380 To study the spectral sensitivities of ancestral mammalian
nm (results not shown), indicating thecis-trans isomer-pigments further, we consider yet another phylogenetic tree
of LWS/MWS pigments: [(((human (P560), human (P530)), ization of the chromophore (Hubbard and Kropf (marmoset (P562), marmoset (P553), marmoset (P540))), 1958). This control experiment demonstrates that the rabbit (P509), (goat (P553), deer (P531))), guinea pig (P516),
lower peaks are entirely due to opsins covalently linked (squirrel (P532), mouse (P508))]. This tree topology of the
to 11-cis-retinal via a Schiff base bond. When measured mammalian pigments is basically the same as that in
Yoko-in the dark, the LWS pigments of cave fish, frog, and yamaand Radlwimmer(1999). However, it contains three
trifercations because of unresolved phylogenetic relationships chicken havemax at 558 ⫾ 2, 557 ⫾ 2, and 561 ⫾ 2
among the mammalian species. nm, respectively, while the MWS pigment of cave fish
has a max at 530 ⫾ 2 nm (Figure 2, Table 1). The respective dark-light difference spectra are given by 557, RESULTS
557, 561, and 531 nm, all of which are also precise to
Absorption spectra of the chicken, frog, and cave within⫾2 nm (Figure 2, insets) and are very close to
fish LWS/MWS pigments:To study the mechanisms of the corresponding dark spectra.
ments in Figure 3, the amino acid sequences of the ancestral pigments at nodes a–i (pigments a–i, respec-tively) were inferred by using the JTT model of amino acid replacements (Jones et al.1992; Figure 4). As we can see in Figure 4, the accuracy of most inferred amino acids is quite high and only relatively small numbers of them have posterior probabilities of⬍0.9. Note that the inferred amino acid sequences of pigments g and h are identical. When the Dayhoff model of amino acid replacements (Dayhoffet al.1978) is used, very similar ancestral amino acid sequences are inferred. For pig-mentsa–f,g(⫽h), andi, the two models predict only three, one, five, one, zero, one, three, and two amino acid differences, respectively. At these ambiguous sites, the posterior probabilities associated with the amino acid inference are always⬍0.9.
Using the contemporary pigments, we suggested that the spectral sensitivities of the LWS/MWS pigments are controlled mainly by the amino acids at 180, 197, 277, 285, and 308 (Yokoyama and Radlwimmer 1998, 1999). At these five critical sites, pigmentsa–e,g(⫽h), andihave SHYTA, while pigmentfhas SYYTA (Figure Figure2.—Absorption spectra of the cave fish LWS, frog 3). Most of these inferred amino acids have posterior LWS, chicken LWS, and cave fish MWS pigments measured probabilities ⬎0.9. For pigments d–f, however, amino in the dark. The dark-light difference spectra are shown in
acids S180 and A180 are predicted with probabilities of the insets.
0.7 and 0.3, respectively.
Absorption spectra of the ancestral pigments: Many
inferred amino acids of the ancestral pigments are iden-(CHAPS-PC) mixture and microspectrophotometry
tical to those of the contemporary pigments (Figure (MSP) methods, themaxof the chicken LWS pigment
4), showing that pigments a–i can be constructed by were estimated to be 571 (Okanoet al.1989) and 569
introducing necessary mutations into some extant pig-nm (BowmakerandKnowles1977), respectively. Our
ments. Indeed, pigmentsd–fwere constructed by intro-estimate isⵑ10 nm lower than these values. The cause
ducing six mutations into human (P560) pigment, nine of this difference is not immediately clear. However, in
mutations into pigment d, and nine mutations into the CHAPS-PC method, the sample used for the
evalua-squirrel (P532) pigment, respectively (Figure 5A). The tion of themax is not pure and containsⵑ92% of the amino acid sequences of pigments a–c,g(⫽ h), andi LWS pigments, while the MSP analyses are often subject
are similar to that of chameleon (P560) pigment, which to sampling errors. Compared with these methods, the can be divided into segments I–IV by three restriction visual pigments regenerated using an in vitroassay are sites (Figures 4 and 5B). Thus, by introducing necessary identical and are expected to provide a more reliable mutations into these segments, we constructed I1–I4,
max of each specific pigment. II1–II4, III1–III4, and IV1–IV2, respectively (Figure 5C). The two previous estimates of themaxof frog (P557) The pigmentsa–c,g(⫽h), andiwere then obtained by pigment are very different: 611 nm by MSP (Witkovsky recombining these four segments at the three restriction et al.1981) and 533 nm by the light-evoked cone contrac- sites (Figure 5C). In this way, we constructed one ances-tion method (BesharseandWitkovsky1992). At pres- tral pigment at each node, each amino acid having the ent, the cause of the two very different estimates is not highest posterior probability.
clear. Our estimate of 557 nm falls in between these When measured in the dark, the
maxof pigmentsa–f, two max’s. MSP estimates for the cave fish MWS and g(⫽h), andiare 563⫾2, 563⫾2, 561⫾2, 558⫾2, LWS pigments regenerated with 11-cis-retinal showed 558⫾2, 536⫾1, 561⫾2, and 564⫾2 nm, respectively
max’s at 533 ⫾ 3 and 563 ⫾ 4 nm, respectively (F. I. (Figure 6). The respective dark-light difference spectra Harosi and J. Kleinschmidt, personal communica- are given by 564, 563, 561, 558, 558, 536, 561, and 564 tion; see also Kleinschmidt and Harosi 1992). The nm, all of which are precise to within⫾2 nm (Figure 6, present results, 530 and 558 nm, respectively, agree well insets). They are virtually identical to the corresponding with the MSP results. In the following, we use the dark dark spectra. Thus, pigment f with SYYTA at the five spectra obtained from the in vitroassay for themax of critical sites has amaxat 536 nm, while the other ances-the chicken, frog, and cave fish pigments (Table 1). tral pigments with SHYTA havemaxat 558–564 nm
(Fig-Amino acid sequences of the ancestral LWS/MWS ures 3 and 6). These results suggest that the pigment
of the common ancestor was red sensitive and the
pig-Figure3.—A composite evolutionary tree topology of 11 vertebrate LWS/ MWS pigments. SHYTA refers to the amino acids at sites 180, 197, 277, 285, and 308 for the ancestral vertebrate pig-ment. The numbers after P and those at the nodes a–i refer tomaxobtained byin vitroassay. The numbers in parentheses indicate the total numbers of amino acid replacements along a specific branch.
temporary LWS/MWS pigments evolved from the LWS sidering the standard errors associated with the estima-tion of the max, the expected and corresponding ob-pigment. As noted earlier, for pigmentsd–f, S180 and
A180 are predicted with probabilities 0.7 and 0.3, respec- served max’s are in reasonably good agreement. Table 2 clearly shows that the spectral tuning of the tively. As we see below, changes S180A and A180S should
shift the max for no more than 7 nm and, therefore, LWS/MWS pigments is determined mainly by the amino acids at 180, 197, 277, 285, and 308. It is also true the uncertain inference of amino acids at site 180 does
not change the red and green sensitivities of the ances- that, despite having the same amino acid composition SHYTA at the five critical sites, pigmentsa–e,g(⫽ h), tral pigments.
Now, what do the spectral sensitivity data in Figure 3 andi have somewhat different max, ranging from 558 to 564 nm (Figures 3 and 6). Among these, themaxof tell us about the mechanisms of spectral tuning in the
LWS and MWS pigments? Following Yokoyama and pigmentsd ande(both withmax ⫽ 558 nm) and that of pigmenti(max⫽564 nm) are significantly different Radlwimmer(1999), let 180,197,277,285,308, and Z
be the magnitudes of themax shifts caused by S180A, (P⬍0.05). Where does this variation in themaxvalues come from? As noted earlier, the spectral sensitivities H197Y, Y277F, T285A, A308S, and the absorption
spec-trum of a pigment with SHYTA. Note that the amino of human (P530) and human (P560) pigments are de-termined mainly by the three-sites rule. However, addi-acid compositions for all contemporary and ancestral
pigments are either Y277/T285 (Y277 and T285) or tional amino acid differences at sites 116, 230, 233, and 309 are known to have some minor influence on the F277/A285 (Figure 4) and, therefore, two parameters,
277and285, cannot be estimated separately. When mul- differentiation of the two pigments (Asenjoet al.1994). Pigments d, e, and i have two identical amino acids tiple linear regression analysis is applied to themax of
the 11 contemporary and 9 ancestral pigments,ˆ180⫽ I230/Y309, but pigmentsdandehave two amino acid replacements S116Y/A233S (Figure 4). Both amino
⫺7⫾ 2 nm,ˆ197⫽ ⫺26⫾ 2 nm,ˆ277/ˆ285⫽ ⫺24⫾ 3
nm,ˆ308⫽ ⫺19⫾4 nm, and Z⫽ 560 ⫾1 nm. When acids Y116 and S233 are human (P530) pigment spe-cific. Therefore, the difference in themaxbetween pig-the regression analysis is applied to only pig-the 11
contem-porary pigments, ˆ180 ⫽ ⫺6 ⫾ 2 nm, ˆ197 ⫽ ⫺27⫾ 2 mentsd and eand pigment i is caused most probably by the slightly decreasedmaxin the former two pigments nm,ˆ277/ˆ285⫽ ⫺24⫾ 2 nm,ˆ308⫽ ⫺18⫾3 nm, and
Z ⫽ 559 ⫾ 1 nm. Thus, the two sets of estimates are due to S116Y/A233S. It should be stressed, however, that the minor variation inmaxis found only in certain practically identical. Using the former set of estimates,
we can predict the expectedmaxfor the contemporary mammalian pigments. Thus, this minor adjustment in the mechanisms of spectral tuning seems to be a local and ancestral pigments (Table 2). Table 2 shows that
the observedmax of frog (P557) and cave fish (P558) phenomenon.
Five-sites rule:Using the contemporary and ancestral
pigments and ancestral pigments a, b, d, e, and i fall
Figure5.—Strategy for constructing the an-cestral pigmentsa-i. (A) The construction of pigmentsd–f from human (P560) and squir-rel (P532) pigments. (B) The opsin cDNA structure of chameleon (P560) pigment.BglII, NcoI, andSphI denote the positions of three restriction sites (see also Figure 4). (C) The construction of pigments a–c, g(⫽h), andi from chameleon (P560) pigment.
separately. However, if we consider the amino acid se- The corresponding observedmax fall outside of these intervals. Thus, some improvement in the estimation quences of all 26 pigments in Table 1, we can evaluate
277and285separately and also determine interactions procedure is desirable. It turns out that such an improve-ment can be made by considering interactions among between sites 180 and 197 (180⫻197); 180 and 285
(180⫻285); 197 and 285 (197⫻285); 197 and 308 (197⫻308); the five critical sites. The improvement in the estimation procedures with and without a specific interaction term 277 and 285 (277⫻285); and 180, 277, and 285 (180⫻277⫻285;
appendix). can be tested by
When the interaction terms are neglected, Z ⫽559
F20,19⫽(SSE2/20)/(SSE1/19), nm, ˆ180 ⫽ ⫺5 nm, ˆ197 ⫽ ⫺22 nm, ˆ277 ⫽ ⫺8 nm,
ˆ285⫽ ⫺17 nm, andˆ308⫽ ⫺25 nm (Table 3, model a). where SSE1and SSE2indicate the SSE values (see appen-When the max for the 26 pigments are estimated by dix) for the models with and without a specific interac-using thesevalues, they agree reasonably well with the tion term, respectively. When interaction terms180⫻197, corresponding observed values (Table 4, column a). 180⫻285,197⫻285,197⫻308,277⫻285, and180⫻277⫻285are consid-However, themaxof dolphin (P524) and squirrel (P532) ered separately, theF20, 19values are 3.4 (P⬍0.001), 1.2 pigments deviate from the corresponding expected val- (P⫽0.25–0.5), 1.2 (P⫽0.25–0.5), 1.6 (P⫽0.1–0.25), ues by 5 and 4 nm, respectively (see alsoYokoyamaand 1.0 (P ⬵ 0.5), and 1.0 (P ⬵ 0.5), respectively. These Radlwimmer1999). The 95% confidence intervals for tests show that only the estimation procedure with themaxvalues of dolphin (P524) and squirrel (P532) 180⫻197should significantly improve the estimates.
Figure6.—Absorption spectra of the ancestral pigmentsa–gandimeasured in the dark. The dark-light difference spectra are shown in the insets.
559 nm,ˆ180⫽ ⫺7 nm, ˆ197⫽ ⫺28 nm, ˆ277⫽ ⫺8 nm, the same time, ˆ180⫻197causes a significant red shift in
ˆ285⫽ ⫺15 nm, ˆ308 ⫽ ⫺27 nm, and ˆ180⫻197 ⫽ 11 nm themax. When the expectedmaxof the 26 pigments are (Table 3, model b). Thus, Z,ˆ180,ˆ277,ˆ285, andˆ308are inferred using these estimates, the differences between similar to those of model a, but ˆ197 decreases and, at the expected and observedmaxare significantly reduced (Table 4, column b). The 95% confidence intervals for themaxof dolphin (P524) and squirrel (P532) pigments
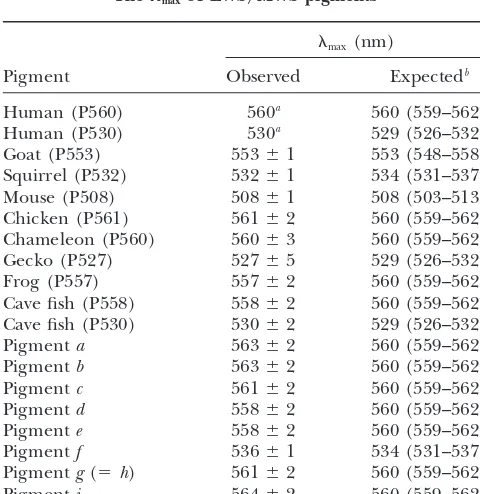
TABLE 2
are now 523–528 nm and 529–534 nm, respectively, and
Themaxof LWS/MWS pigments contain the observed
max.
These analyses show that the five-sites rule, now
in-max(nm)
cluding the synergistic effect of sites 180 and 197,
ex-Pigment Observed Expectedb plains the
maxof all contemporary pigments. According to the five-sites rule, the ancestral pigments with SHYTA
Human (P560) 560a 560 (559–562)
and SYYTA should havemaxat 559 and 536 nm,
respec-Human (P530) 530a 529 (526–532)
tively. The corresponding observed values are 558–564
Goat (P553) 553⫾1 553 (548–558)
Squirrel (P532) 532⫾1 534 (531–537) and 536 nm (Figure 3). Thus, this rule explains the
Mouse (P508) 508⫾1 508 (503–513) spectral tunings of the LWS/MWS pigments during the
Chicken (P561) 561⫾2 560 (559–562) entire history of vertebrate evolution. Sites 180, 277,
Chameleon (P560) 560⫾3 560 (559–562)
285, and 308 are located near the chromophore
(Pal-Gecko (P527) 527⫾5 529 (526–532)
czewski et al. 2000), where interaction between the
Frog (P557) 557⫾2 560 (559–562)
chromophore and an opsin usually takes place
(Yoko-Cave fish (P558) 558⫾2 560 (559–562)
Cave fish (P530) 530⫾2 529 (526–532) yama 2000a,b; Ebrey and Koutalos 2001). The site
Pigmenta 563⫾2 560 (559–562) 197 is located outside of the transmembrane regions,
Pigmentb 563⫾2 560 (559–562) but H197 is known for its important function of chloride
Pigmentc 561⫾2 560 (559–562)
binding (Sunet al.1997). Although we cannot offer a
Pigmentd 558⫾2 560 (559–562)
structural explanation for the max shift, it suggests an
Pigmente 558⫾2 560 (559–562)
intimate relationship between the chloride binding site
Pigmentf 536⫾1 534 (531–537)
Pigmentg(⫽h) 561⫾2 560 (559–562) at 197 and the spectral tuning residue at 180.
Pigmenti 564⫾2 560 (559–562) Ancestral mammalian pigments:By applying the JTT
model of amino acid replacements to another tree
to-aNo standard error is given.
TABLE 3
The effects of amino acid changes at sites 180, 197, 277, 285, and 308 on themaxshifts
Estimator (nm)
Model Z ˆ180 ˆ197 ˆ277 ˆ285 ˆ308 ˆ180⫻197
a. No interaction 559⫾1 ⫺5⫾1 ⫺22⫾1 ⫺8⫾2 ⫺17⫾2 ⫺25⫾2 —
b. One interaction 559⫾1 ⫺7⫾1 ⫺28⫾1 ⫺8⫾1 ⫺15⫾1 ⫺27⫾1 11⫾2
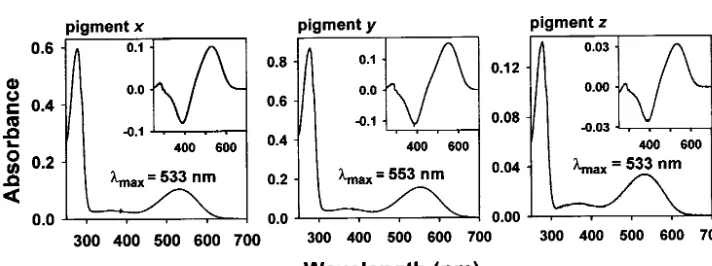
inferred the amino acid sequences of the common an- 1, and 533 ⫾ 2 nm, respectively (Figures 7 and 8). These results are consistent with those of Yokoyama cestors of the 11 mammalian pigments (pigmentx), of
human (P560) and human (P530) pigments (pigment andRadlwimmer(1999). However, we have also seen that themaxof pigmentsd–fare given by 558, 558, and y), and of squirrel (P532) and mouse (P508) pigments
(pigmentz). Pigmentsx–z roughly correspond to pig- 536 nm, respectively (see Figure 3). Thus, themax of pigmentxis 25 nm lower than that of pigmentd. ments d–f in Figure 3, respectively. Most amino acids
inferred have posterior probabilities of⬎0.9 and pig- Pigmentsx–zhave AYYTA, AHYTA, and AYYTA at the five critical sites, respectively, whereas pigments d–f mentsx–zhave only four, two, and five sites, where the
posterior probabilities are⬍0.9 (Figure 4). have SHYTA, SHYTA, and SYYTA, respectively. Thus, the difference between the max of pigments x and d Using site-directed mutagenesis and recombinant
DNA techniques, we then reconstructed these three an- must have been caused by the amino acid differences at sites 180 and 197. Slightly lowermax of pigments y cestral pigments. Again, using anin vitroassay, themax
of pigmentsx–zare determined to be 533⫾ 1, 553⫾ andzthan those of pigmentseandfcan be explained
TABLE 4
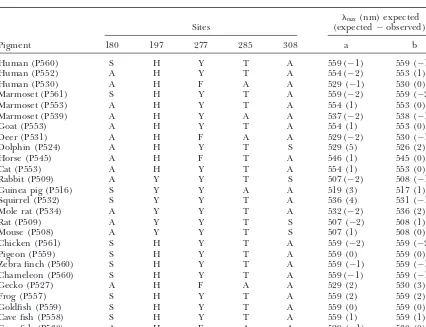
Amino acid compositions at five critical sites andmaxof the extant LWS and MWS pigments
max(nm) expected
Sites (expected⫺observed)a
Pigment 180 197 277 285 308 a b
Human (P560) S H Y T A 559 (⫺1) 559 (⫺1)
Human (P552) A H Y T A 554 (⫺2) 553 (1)
Human (P530) A H F A A 529 (⫺1) 530 (0)
Marmoset (P561) S H Y T A 559 (⫺2) 559 (⫺2)
Marmoset (P553) A H Y T A 554 (1) 553 (0)
Marmoset (P539) A H Y A A 537 (⫺2) 538 (⫺1)
Goat (P553) A H Y T A 554 (1) 553 (0)
Deer (P531) A H F A A 529 (⫺2) 530 (⫺1)
Dolphin (P524) A H Y T S 529 (5) 526 (2)
Horse (P545) A H F T A 546 (1) 545 (0)
Cat (P553) A H Y T A 554 (1) 553 (0)
Rabbit (P509) A Y Y T S 507 (⫺2) 508 (⫺1)
Guinea pig (P516) S Y Y A A 519 (3) 517 (1)
Squirrel (P532) S Y Y T A 536 (4) 531 (⫺1)
Mole rat (P534) A Y Y T A 532 (⫺2) 536 (2)
Rat (P509) A Y Y T S 507 (⫺2) 508 (1)
Mouse (P508) A Y Y T S 507 (1) 508 (0)
Chicken (P561) S H Y T A 559 (⫺2) 559 (⫺2)
Pigeon (P559) S H Y T A 559 (0) 559 (0)
Zebra finch (P560) S H Y T A 559 (⫺1) 559 (⫺1)
Chameleon (P560) S H Y T A 559 (⫺1) 559 (⫺1)
Gecko (P527) A H F A A 529 (2) 530 (3)
Frog (P557) S H Y T A 559 (2) 559 (2)
Goldfish (P559) S H Y T A 559 (0) 559 (0)
Cave fish (P558) S H Y T A 559 (1) 559 (1)
Cave fish (P530) A H F A A 529 (⫺1) 530 (0)
aa and b denote estimation procedures with no interaction and with an interaction between 180 and 197,
TABLE 5
Effects of single amino acid changes on themaxshift
Pigment Mutation max(nm)
Pigmentx — 532
A180S 533
A58T, V76A, H294N 532
Pigmenty — 553
I274V 554
I320V 553
Pigmentz — 532
T58A 532
V115I, A180S 534
H294N 533
V76A 532
Figure7.—A composite evolutionary tree topology of 11 mammalian LWS/MWS pigments. The numbers after P and those at the nodes x–z refer tomaxobtained byin vitroassay.
the two human pigments is estimated to be ⵑ30 MY ago (YokoyamaandYokoyama1989). Thus, the diver-by the amino acid differences at site 180. These results gences of the LWS and MWS pigments seem to be rela-clearly show that the inference of the ancestral pigments tively recent events in vertebrate evolution. These obser-depends not only on the phylogenetic relationship of vations are consistent with our suggestion that the extant pigments but also on the types of pigments used vertebrate ancestor had the LWS pigment rather than for constructing the phylogenetic tree. As noted earlier, the MWS pigment.
however, the phylogenetic relationship of mammalian species has not been resolved. Thus, until the issue is
DISCUSSION resolved, it is premature to discuss whether the
mamma-lian ancestor had MWS or LWS pigment. It is highly likely that the vertebrate ancestor pos-Compared with the variability in the spectral sensitivi- sessed the LWS pigment with SHYTA at the five critical ties of those of the mammalian pigments, the max of amino acid sites and that the contemporary LWS/MWS LWS/MWS pigments of nonmammalian vertebrates are pigments evolved from the ancestral LWS pigment. We more uniform. The currently available data show that have also seen that the five-sites rule, now including the all fish, amphibian, reptile, and avian lineages have LWS synergistic effect between amino acid sites 180 and 197, pigments but not necessarily MWS pigments (Table 1). fully explains the variation in the max of the LWS/ Similarly, the orthologous pigment in marine lamprey MWS pigments during the entire history of vertebrate (Lamptera marinus) has P180, Y277, and T285, showing evolution. The first conclusion was based on a single the LWS pigment-specific feature (H. Zhang and S. amino acid sequence at each ancestral node, while the Yokoyama,unpublished data). It seems that the diver- second conclusion was derived using a purely statistical gence between chameleon (P560) and gecko (P527) argument. Here, we address these points in more detail. pigments (Figure 3, node h) and between cave fish Uncertain inference of amino acids and spectral
sensi-(P558) and cave fish (P530) pigments (node i) occurred tivity:As noted earlier, ancestral mammalian pigments ⵑ150–190 million years (MY) ago (Yokoyama and x–zhave 4, 2, and 5 amino acid sites where the posterior Blow 2001) and ⵑ190–320 MY ago (Yokoyama and probabilities are⬍0.9. We replaced these amino acids by those with the second highest posterior probabilities Yokoyama1990), respectively. The divergence between
TABLE 6
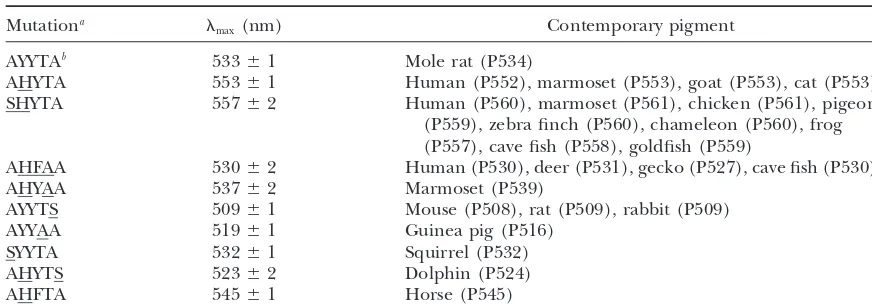
Amino acid changes at the five critical sites of pigmentxand theirmax
Mutationa
max(nm) Contemporary pigment
AYYTAb 533⫾1 Mole rat (P534)
AHYTA 553⫾1 Human (P552), marmoset (P553), goat (P553), cat (P553)
SHYTA 557⫾2 Human (P560), marmoset (P561), chicken (P561), pigeon
(P559), zebra finch (P560), chameleon (P560), frog (P557), cave fish (P558), goldfish (P559)
AHFAA 530⫾2 Human (P530), deer (P531), gecko (P527), cave fish (P530)
AHYAA 537⫾2 Marmoset (P539)
AYYTS 509⫾1 Mouse (P508), rat (P509), rabbit (P509)
AYYAA 519⫾1 Guinea pig (P516)
SYYTA 532⫾1 Squirrel (P532)
AHYTS 523⫾2 Dolphin (P524)
AHFTA 545⫾1 Horse (P545)
aEach mutation is indicated by an underline. bAmino acid composition of pigmentx.
and determined themax of the mutant pigments. The measured. Table 6 clearly shows that, as long as the amino acid compositions at the five critical sites are the results clearly show that the max of the regenerated
mutant pigments are virtually identical to those with- same, the max of the mutants are virtually identical to those of the corresponding contemporary pigments. out such mutations, showing that the amino acid
differ-ences at these 11 sites have little effect on themaxshift It should be stressed that these mutant pigments with the background of pigmentx and the corresponding (Table 5).
Interestingly, amino acid changes A180S introduced contemporary LWS/MWS pigments can have very dif-ferent amino acid compositions at sites other than the into pigmentsxandzdo not shift themaxeither.
Consid-eringˆ180of⫺7 nm (Table 3, model b), this observation 5 critical sites. For example, reflecting dynamic evolu-tionary processes of amino acid replacements during may be surprising. These results need to be understood,
however, by considering the interaction between sites vertebrate evolution, pigment x differs from human (P560) pigment at 27 amino acid sites, whereas it differs 180 and 197. Note that squirrel (P532) and mole rat
(P534) pigments have AYYTA and SYYTA at the five from cave fish (P558) pigment at 91 sites. Thus, the majority of these amino acid replacements have contrib-critical sites, respectively, but theirmax values are 532
and 534 nm and are virtually identical (Table 4). On uted very little to the spectral tuning in the LWS/MWS pigments and may be considered as “neutral” changes. the other hand, human (P552), marmoset (P553), goat
(P553), and cat (P553) pigments have AHYTA, whereas The mutagenesis analyses using the mammalian ancestral pigment strengthen the argument that the “five-sites” rule human (P560), marmoset (P561), chicken (P561),
pi-geon (P560), zebra finch (P560), chameleon (P560), has been the molecular mechanism of spectral tuning in the LWS/MWS pigments throughout vertebrate evolu-frog (P557), cave fish (P558), and goldfish (P559)
pig-ments all have SHYTA (Table 4). Themax of the two tion.
Red-green color vision:To study the
structure-func-groups of pigments differ by 4–9 nm (Table 4). Thus,
themax shift caused by A108S is very small, if there is tion relationships of the LWS/MWS pigments, we con-sidered only the visual pigments with 11-cis-retinal (also any, for pigments with Y197, but it isⵑ7 nm for pigments
with H197. From these observations, it is expected that known as vitamin A1aldehyde). In nature, however, the
max of these visual pigments can be modified further since both pigmentsxandzhave AYYTA, A180S should
not cause any significantmaxshift. at the visual pigment level as well as at the photoreceptor cell level. It turns out that many fishes, amphibians, and
More on the five-sites rule:The statistical inferences
strongly suggest that the five-sites rule explains the varia- reptiles can use 11-cis-3, 4-dehydroretinal (or vitamin A2 aldehyde) as the chromophore, which causes a red shift tion in themaxof all contemporary and ancestral LWS/
MWS pigments. When the five critical sites are consid- in the max (Whitmoreand Bowmaker 1989;Harosi 1994). For example, goldfish (P559) pigment uses ered, the contemporary LWS/MWS pigments are
classi-fied into nine different groups (Table 6). To test the mostly vitamin A2 aldehyde as the chromophore and actually achieves amaxvalue atⵑ620 nm (Palacioset validity of the statistical result further, we reconstructed
the nine types of pigments by modifying the amino acid al.1998;YokoyamaandRadlwimmer1999). Cave fish (P558) pigment uses vitamin A1and A2aldehydes with compositions at the five critical sites of pigmentx.Using
and Harosi 1992). Thus, this pigment can achieve a pigments, the numbers of amino acid replacements (K) can differ considerably between comparable branches.
maxatⵑ560–620 nm depending upon the composition
of the chromophore. Cone photoreceptor cells in many In Figure 3, for example, compared with the K for branch b-frog (P557) pigment (29), those for b-gecko amphibians, reptiles, and birds use different devices,
colored oil droplets. Although their exact functions (P527), b-mouse (P508), b-squirrel (P532), b-goat (P553), b-human (P530), and b-human (P560) pigments are 64, have not been fully elucidated, the oil droplets often
contain a high concentration of carotenoids and are 99, 72, 80, 75, and 70, respectively. These values are all
Ⰷ29 (P ⬍ 0.01). This difference is largely due to the likely to serve as cutoff filters (Bowmaker1991). Both
chicken (P561) and pigeon (P559) pigments are ex- accelerated evolution in the mammalian ancestor, rep-resented by branch c–d. Similarly, the Kfor branches pressed in the cone cells with the red-colored oil
drop-lets with cutoff wavelengths at 560–580 nm (Bowmaker f-mouse (P508) pigment and h-gecko (P527) pigment are significantly larger than those for f-squirrel (P532) et al. 1997). These photoreceptor cells may actually
achievemaxat 600–620 nm (BowmakerandKnowles pigment and h-chameleon (P560) pigment, respectively (both withP ⬍0.01; Figure 3).
1977). Thus, the photoreceptor cells with the LWS
pig-ments in many vertebrate species actually detect more These results seem to show that the accelerated evolu-tionary rate of amino acid replacement leads to the reddish light than the LWS pigments regenerated using
the in vitroassay. By the same token, when vitamin A2 acquisition of new functions. More specifically, the K tend to be larger for branches where amino acid replace-aldehyde is used as the chromophore, the MWS
pig-ments can also achievemaxatⵑ560 nm (seePalacios ments occur at the functionally important five sites 180, 197, 277, 285, and 308 than those without such changes. et al.1998).
When the actual max of visual pigments are red Furthermore, the gecko pigment has pure rod-retinas (Crescitelli 1972; Crescitelli et al. 1977) and the shifted, how do animals achieve max at ⵑ530 nm? It
turns out that many species use an evolutionarily dis- cone-specific MWS pigment had to adapt to this unique cellular change. The accelerated evolutionary rate of tantly related group of RH2 pigments for their green
color detection (Yokoyama2000a,b; EbreyandKou- amino acid replacement for branch c–d is not immedi-ately clear, but it may reflect themaxshift from 558 nm talos2001). For example, by replacing vitamin A1
alde-hyde with vitamin A2 aldehyde, the two goldfish RH2 to either 536 nm in the ancestral rodent pigment or 553 nm of the goat pigment (Figure 3). If it turns out pigments shift theirmaxfromⵑ510 nm to 530–540 nm
(Johnsonet al.1993;Palacioset al.1998). The chicken that the rodents are most distantly related to the other groups of mammals, then theKassociated with H197Y photoreceptor cell with the RH2 pigments withmaxat
ⵑ510 nm actually achieves amaxat 533 nm due to the in the ancestral rodent pigment will be ⬎8. On the other hand, if the goat pigment is most distantly related, presence of a green oil droplet in the cell (Bowmaker
and Knowles 1977). Like the MWS pigments, these then the K associated with S180A can be ⬎26. Thus, there is a positive correlation between the evolutionary RH2 pigments are often called “green pigments,”
some-times creating confusing terminology. Placental mam- rate of amino acid replacement and the level of the divergence in themax. Such correlation has also been mals use neither vitamin A2 aldehyde nor colored oil
droplets and, therefore, their red-green color vision is detected for various evolutionary groups of visual pig-ments in the gecko (Yokoyama andBlow2001) and determined directly by the MWS and LWS pigments.
Vitamin A1aldehyde is used by both vertebrates and avian species (Yokoyamaet al.2000). All of these exam-ples seem to show that the relaxation from purifying invertebrates, but a vitamin A2aldehyde-based pigment
has not been found in invertebrates (SmithandGold- selection caused by environmental changes is the first important step toward the adaptation of organisms to smith 1990). Thus, vitamin A2 aldehyde might have
been an evolutionary device to generate dual functions new environments.
or a new function of one visual pigment. Similarly, as Comments by Ruth Yokoyama, Stephen Schaeffer, and two anony-suggested by Thompson (1991), colored oil droplets mous reviewers are greatly appreciated. This work was supported by
National Institutes of Health grant GM-42379. might have been an efficient way to generate a variability
in the spectral sensitivity in photoreceptors that had not yet achieved the mechanisms for expressing a single
type of visual pigment in one photoreceptor cell (how- LITERATURE CITED
ever, seeWalls1942). While these functional changes Asenjo, A. B., J. RimandD. D. Oprian,1994 Molecular determi-nants of human red/green color discrimination. Neuron 12:
are underway in the RH2 pigments, it is reasonable to
1131–1138. assume that the ancestor of the LWS/MWS pigments
Besharse, J. C.,andP. Witkovsky,1992 Light-evoked contraction or photoreceptor cells with such pigments must have of red absorbing cones in theXenopusretina is maximally sensitive
to green light. Vis. Neurosci.8:243–249. been red sensitive. These observations are also
consis-Bowmaker, J. K.,1991 The evolution of vertebrate visual pigments tent with the idea that the vertebrate ancestor had the
and photoreceptors, pp. 63–81 inEvolution of the Eye and Visual LWS pigment. Systems, edited byJ. R. Cronly-DillonandR. L. Gregory.CRC
Press, Boca Raton, FL.
Bowmaker, J. K.,andA. Knowles,1977 The visual pigments and Merbs, S. L.,andJ. Nathans,1993 Role of hydroxyl-bearing amino oil droplets of the chicken retina. Vision Res.17:755–764. acids in differentially tuning the absorption spectra of the human Bowmaker, J. K., L. A. Heath, S. E. WilkieandD. M. Hunt,1997 red and green cone pigments. Photochem. Photobiol.58:706–
Visual pigments and oil droplets from six classes of photoreceptor 710.
in the retinas of birds. Vision Res.37:2183–3194. Murphy, W. J., E. Eizirik, W. E. Johnson, Y. P. Zhang, O. A. Ryder Boynton, R. M.,1979 Human Color Vision.Holt, Rinehart & Winston, et al., 2001 Molecular phylogenetics and the origin of placental
New York. mammals. Nature409:614–618.
Chan, T., M. LeeandT. P. Sakmar,1992 Introduction of hydroxyl Nathans, J., D. ThomasandD. S. Hogness,1986 Molecular genet-bearing amino acids causes bathochromic spectral shifts in rho- ics of human color vision: the genes encoding blue, green, and dopsin: amino acid substitutions responsible for red-green color red pigments. Science232:193–201.
pigment spectral tuning. J. Biol. Chem.267:9478–9480. Nei, M., J. ZhangandS. Yokoyama,1997 Color vision of ancestral Crescitelli, F.,1972 The visual cells and visual pigments of the organisms of higher primates. Mol. Biol. Evol.14:611–618.
vertebrate eye, pp. 245–363 inHandbook of Sensory Physiology, ed- Neitz, M., J. Neitzand G. H. Jacobs, 1991 Spectral tuning of ited byH. J. A. Dartnall.Springer, Berlin. pigments underlying red-green color vision. Science252:971– Crescitelli, F., H. J. A. DartnallandE. R. Loew,1977 The visual 974.
pigments of gecko and other vertebrate eye, pp. 391–450 in Novacek, M. J.,1992 Mammalian phylogeny: shaking the tree. Na-Handbook of Sensory Physiology, edited by H. J. A. Dartnall. ture356:121–125.
Springer, Berlin. Okano, T., Y. Fukada, I. G. ArtamonovandT. Yoshizawa,1989 David-Gray, Z. K., H. M. Cooper, J. W. Janssen, E. NevoandR. G. Purification of cone visual pigments from chicken retina.
Bio-Foster,1999 Spectral tuning of a circadian photopigment in chemistry28:8848–8856.
a subterranean ‘blind’ mammal (Spalax ehrenbergi). FEBS Lett. Oprian, D. D., A. B. Asenjo, N. LeeandS. L. Pelletier,1991
De-461:343–347. sign, chemical synthesis, and expression of genes for the three Dayhoff, M. O., R. M. SchwartzandB. C. Orcutt,1978 A model human color vision pigments. Biochemistry30:11367–11372.
of evolutionary change in proteins, pp. 345–352 inAtlas of Protein Palacios, A. G., F. J. Varela, R. SrivastavaandT. J. Goldsmith, Sequence and Structure, Vol. 5, Suppl. 3, edited byM. O. Dayhoff. 1998 Spectral sensitivity of cones in the goldfish,Carassius aura-National Biomedical Research Foundation, Washington, DC. tus.Vision Res.38:2135–2146.
De Jong, W. W.,1998 Molecules remodel the mammalian tree. Palczewski, K., T. Kumasaka, T. Hori, C. A. Behnke, H. Motoshima Trends Ecol. Evol.13:270–275. et al., 2000 Crystal structure of rhodopsin: a G protein-coupled Ebrey, T.,andY. Koutalos,2001 Vertebrate photoreceptors. Prog. receptor. Science289:739–745.
Retin. Eye Res.20:49–94. Radlwimmer, F. B.,andS. Yokoyama,1997 Cloning and expression Fasick, J. I., T. W. CroninandD. M. Hunt,1998 The visual pig- of the red visual pigment gene of goat (Capra hircus). Gene198:
ments of the bottlenose dolphin (Tursiops truncatus). Vis. Neu- 211–215.
rosci.15:643–651. Radlwimmer, F. B.,andS. Yokoyama,1998 Genetic analyses of the Hadjeb, N.,andG. A. Berkowitz,1996 Preparation of T-overhang green visual pigments of rabbit (Oryctolagus cuniculus) and rat
vectors with high PCR product cloning efficiency. Biotechniques (Rattus norvegicus). Gene218:103–109.
20:20–22. Searle, S. R.,1971 Linear Models.John Wiley & Sons, New York. Harosi, F. I.,1994 Analysis of two spectral properties of vertebrate Shoshani, J.,andM. C. McKenna,1998 Higher taxonomic
relation-visual pigments. Vision Res.34:1359–1369. ships among extant mammals based on morphology, with selected Hubbard, R.,andA. Kropf,1958 The action of light on rhodopsin. comparisons of results from molecular data. Mol. Phylogenet.
Proc. Natl. Acad. Sci. USA44:130–139. Evol.9:572–584.
Huchon, D., F. M. CatzeflisandJ. P. Douzery,1999 Molecular Smith, W. C.,andT. H. Goldsmith,1990 Phylogenetic aspects of evolution of the nuclear von Willebrand factor gene in mammals the distribution of 3-hydroretinal in the class Insecta. J. Mol. Evol. and the phylogeny of rodents. Mol. Biol. Evol.16:577–589. 30:72–84.
Jacobs, G. H.,1993 The distribution and nature of color vision
Sun, H., J. P. MackeandJ. Nathans,1997 Mechanisms of spectral among mammals. Biol. Rev.68:413–471. tuning in the mouse green cone pigment. Proc. Natl. Acad. Sci. Johnson, R., K. B. Grant, T. C. Zankel, M. F. Boehn, S. L. Merbs
USA94:8860–8865. et al., 1993 Cloning and expression of goldfish opsin sequences.
Thompson, I.,1991 Considering the evolution of vertebrate neural Biochemistry32:208–214.
retina, pp. 136–151 inEvolution of the Eye and Visual Systems, edited Jones, D. T., W. R. TaylorandJ. M. Thornton,1992 The rapid
byT. R. Cronly-DillonandR. L. Gregory.CRC Press, Boca generation of mutation data matrices from protein sequences.
Raton, FL. Comput. Appl. Biosci.8:275–282.
Waddell, P. J., Y. Cao, J. HaufandM. Hasegawa,1999a Using Kalmus, H., 1965 Diagnosis and Genetics of Defective Colour Vision.
novel phylogenetic methods to evaluate mammalian mtDNA, in-Pergamon Press, Oxford.
cluding amino acid-invariant sites-LogDet plus site stripping, to Kawamura, S.,andS. Yokoyama,1998 Functional characterization
detect internal conflicts in the data, with special reference to the of visual and nonvisual pigments of American chameleon (Anolis
position of hedgehog, armadillo, and elephant. Syst. Biol. 48: carolinensis). Vision Res.38:37–44.
31–53. Kawamura, S., N. S. BlowandS. Yokoyama,1999 Genetic analyses
Waddell, P. J., Y. Cao, M. HasegawaandD. P. Mindell,1999b of visual pigments of the pigeon (Columba livia). Genetics153:
Assessing the Cretaceous superordinal divergence times within 1839–1850.
birds and placental mammals by using whole mitochondrial pro-Khorana, H. G., B. E. Knox, F. Nasi, R. SwansonandD. A.
Thomp-tein sequences and an extended statistical framework. Syst. Biol. son,1988 Expression of a bovine rhodopsin gene inXenopus
48:119–137. oocytes: demonstration of light-dependent ionic currents. Proc.
Walls, G. I.,1942 The Vertebrate Eye and Its Adaptive Radiation.The Natl. Acad. Sci. USA85:7917–7921.
Cranbook Institute of Science, Bloomfield Hills, MO. Kleinschmidt, J.,andF. I. Harosi,1992 Anion sensitivity and
spec-Whitmore, A. V.,andJ. K. Bowmaker,1989 Seasonal variation in tral tuning of cone visual pigments in situ. Proc. Natl. Acad. Sci.
cone sensitivity and short-wave absorbing visual pigments in the USA89:9181–9185.
ruddScadinius erythrophthalmus.J. Comp. Physiol. A166:103–115. Kumar, S.,andS. B. Hedges,1998 A molecular timescale for
verte-Winderickx, J., D. T. Lindsey, E. Sanocki, D. Y. Teller, A. G. brate evolution. Nature392:917–920.
Motulskyet al., 1992 Polymorphism in red photopigment un-Liu, F.-G. R.,andM. M. Miyamoto,1999 Phylogenetic assessment
derlies variation in color matching. Nature356:431–433. of molecular and morphological data for Eutherian mammals.
Witkovsky, P., J. S. Levine, G. A. Engbretson, G. HassinandE. F. Syst. Biol.48:54–64.
Macnicol,1981 A microspectrophotometric study of normal Madsen, O., M. Scally, C. J. Douady, D. J. Kao, R. W. Debryet
and artificial rod in the Xenopus retina. Vision Res.21:867–873. al., 2001 Parallel adaptive radiations in two major clades of
Yang, Z.,1997 PAML: a program package for phylogenetic analysis placental mammals. Nature409:610–614.
by maximum likelihood. Comput. Appl. Biosci.13:555–556. Merbs, S. L.,andJ. Nathans,1992 Absorption spectrum of human
of ancestral nucleotide and amino acid sequences. Genetics141:
1641–1650. 180⫹ 197⫹ 180⫻197⫹Z⫹e15⫽534 Yokoyama, R.,andS. Yokoyama,1990 Convergent evolution of the
red- and green-like visual pigment genes in fish,Astyanax fasciatus, 180⫹ 197⫹ 308⫹ 180⫻197⫹ 197⫻308⫹Z⫹e16⫽509 and human. Proc. Natl. Acad. Sci. USA87:9315–9318.
Yokoyama, R., B. E. KnoxandS. Yokoyama,1995 Rhodopsin from 180⫹ 197⫹ 308⫹ 180⫻197⫹ 197⫻308⫹Z⫹e17⫽508 the fish, Astyanax: role of tyrosine 261 in the red shift. Invest.
Ophthalmol. Visual Sci.36:939–945. Z⫹e18⫽561 Yokoyama, S.,1997 Molecular genetic basis of adaptive selection:
examples from color vision in vertebrates. Annu. Rev. Genet.31: Z⫹e19⫽559 311–332.
Yokoyama, S.,1999 Molecular bases of color vision in vertebrates. Z⫹e20⫽560
Genes Genet. Syst.74:189–199.
Yokoyama, S.,2000a Molecular evolution of vertebrate visual pig- Z⫹e21⫽560
ments. Prog. Retin. Eye Res.19:385–419.
180⫹ 277⫹ 285⫹ 180⫻285⫹ 277⫻285⫹ 180⫻277⫻285⫹Z⫹e22⫽527 Yokoyama, S., 2000b Phylogenetic analysis and experimental
ap-Z⫹e23⫽557 proaches to study color vision in vertebrates. Methods Enzymol.
315:312–325. Z⫹e24⫽559
Yokoyama, S.,andN. S. Blow,2001 Molecular evolution of the Z⫹e
25⫽558 cone visual pigments in the pure rod-retina of the nocturnal
180⫹ 277⫹ 285⫹ 180⫻285⫹ 277⫻285⫹ 180⫻277⫻285⫹Z⫹e26⫽530, gecko,Gekko gekko.Gene (in press).
Yokoyama, S.,andF. B. Radlwimmer,1998 The “five-sites” rule
whereei’s (i⫽ 1, 2, . . . , 26) denote random errors.
and the evolution of red and green color vision in mammals.
Mol. Biol. Evol.15:560–567. This is represented in a matrix form as Yokoyama, S.,andF. B. Radlwimmer,1999 The molecular genetics
and evolution of red and green color vision in mammals. Genetics y⫽ X⫹e,
153:919–932.
Yokoyama, S.,andR. Yokoyama,1989 Molecular evolution of hu- where man visual pigment genes. Mol. Biol. Evol.6:186–197.
Yokoyama, S.,andR. Yokoyama,1996 Adaptive evolution of photo- y⬘ ⫽[560 530 561 . . . 530], receptors and visual pigments in vertebrates. Annu. Rev. Ecol.
Syst.27:543–567.
Yokoyama, S., N. S. BlowandF. B. Radlwimmer,2000 Molecular evolution of color vision of zebra finch. Gene259:17–24.
Communicating editor:S. W. Schaeffer
APPENDIX
Xⴕ⫽
0 1 1 0 1 1 1 1 1 1 1 1 0 0 1 1 1 0 0 0 0 1 0 0 0 1 0 0 0 0 0 0 0 0 0 0 0 1 1 1 1 1 1 0 0 0 0 0 0 0 0 0 0 0 1 0 0 0 0 1 0 1 0 0 0 0 0 0 0 0 0 0 0 1 0 0 0 1 0 0 1 0 0 1 0 1 0 0 0 0 1 0 0 0 0 0 0 0 0 1 0 0 0 1 0 0 0 0 0 0 0 0 1 0 0 1 0 0 0 1 1 0 0 0 0 0 0 0 0 0 0 0 0 0 0 0 0 0 0 0 0 1 0 0 1 1 1 0 0 0 0 0 0 0 0 0 0 0 1 0 0 1 0 1 0 0 0 0 0 0 0 0 0 0 0 0 0 1 0 0 0 1 0 0 0 0 0 0 0 0 0 0 0 1 0 0 0 1 1 0 0 0 0 0 0 0 0 0 0 0 1 0 0 0 0 1 0 0 0 0 0 0 0 0 0 0 0 0 0 1 0 0 0 1 0 0 1 0 0 0 0 1 0 0 0 0 0 0 0 0 0 0 0 0 0 1 0 0 0 1 1 1 1 1 1 1 1 1 1 1 1 1 1 1 1 1 1 1 1 1 1 1 1 1 1 1
, Consider the relationshipsZ⫹e1⫽560 180⫹Z⫹e2⫽553 180⫹ 277⫹ 285⫹ 180⫻285⫹ 277⫻285⫹ 180⫻277⫻285⫹Z⫹e3⫽530
Z⫹e4⫽561 and
e⬘ ⫽[e1e2 e3. . .e26]. 180⫹Z⫹e5⫽553
If we assume that the random term,e, has a normal 180⫹ 285⫹ 180⫻285⫹Z⫹e6⫽539
distribution with mean 0 and 2I, then the mean (ˆ) 180⫹Z⫹e7⫽533 and standard error (sˆ) of ⴕ ⫽ [180 197 277 285 308
180⫻197180⫻285197⫻308277⫻285180⫻277⫻285Z] are estimated 180⫹ 277⫹ 285⫹ 180⫻285⫹ 277⫻285⫹ 180⫻277⫻285⫹Z⫹e8⫽531
from 180⫹ 308⫹Z⫹e9⫽524
ˆ ⫽(XⴕX)⫺1Xⴕy, 180⫹ 277⫹Z⫹e10⫽545
sˆ⫽[(XⴕX)⫺1SSE/(n⫺p)]1/2, 180⫹Z⫹e11⫽553
where 180⫹ 197⫹ 308⫹ 180⫻197⫹ 197⫻308⫹Z⫹e12⫽509
SSE⫽ (y⫺Xˆ)⬘(y⫺ Xˆ),
197⫹ 285⫹Z⫹e13⫽516
andnandpdenote the number of samples and parame-ters, respectively (Searle1971).