Division VI
OPTIMIZATION OF PRIMARY SODIUM HEATING RATE TO REDUCE POWER RAISING DURATION BASED ON CONTROL PLUG LIFE
Rosy Sarkar1, Suresh Kumar R, Jalaldeen S, Anil Kumar Sharma, and Velusamy K
HBNI, Indira Gandhi Center for Atomic Research, Kalpakkam 1
email id: [email protected]
ABSTRACT
The heating rate of primary sodium is an important consideration during start-up of the reactor. During cold shutdown condition of the reactor, the temperature of both hot pool and cold pool sodium is 453 K. During power raising, gradually the temperature of primary sodium will be increased at a specified rate. Traditionally, a slow heating rate of 20 K/h is considered. This requires about 20 hours to attain full power. Higher rate of sodium heating, which reduces the power raising duration, may cause creep and fatigue damages to the reactor components that are immersed in hot pool. In this study, the structural damage possible in the control plug as a function of heating rate at a critical region has been determined and the dependence of control plug life on the heating rate is estimated. The fatigue damages caused due to power raising at the free level of sodium for heating rates 20 K/h, 60 K/h, 100 K/h and 120 K/h are 3.53 E-10, 7.59 E-07, 3.06 E-04 and 2.19 E-03 respectively and the corresponding creep damages are 7.8 E-03, 6.0 E-03, 8.2 E-03 and 9.6 E-03 for 861 cycles. The number of allowable cycles determined by combining the creep and fatigue damage values at full power with the values at power raising and the values are 1182, 1185, 1180 and 1171 cycles at heating rates 20 K/h, 60 K/h, 100 K/h and 120 K/h respectively. Hence, a sodium heating rate of 60 K/h is recommended during power raising in view of CP life. This reduces the power raising duration from 20 hours to 6.6 hours.
INTRODUCTION
The heating rate of primary sodium is of concern during start-up of the reactor. In Prototype Fast Breeder Reactor (PFBR), after shutdown of the reactor, the temperature of both hot pool and cold pool sodium ia at 453 K. During power raising, gradually the temperature of primary sodium will be increased at a specified rate. Traditionally, a slow heating rate of 20 K/h is considered. This requires about 20 hours for power raising. Higher rate of sodium heating may cause creep and fatigue damages to the reactor components which are immersed in hot pool sodium like Control Plug (CP) bottom, Intermediate Heat eXchanger (IHX) and inner vessel. In this study, the damage possible in the control plug bottom as a function of heating rate at a critical region has been determined and the dependence of CP life on the heating rate is estimated. The heating rates considered in this investigation are 20 K/h, 40 K/h, 60 K/h, 80 K/h, 100 K/h and 120 K/h. The evolution of sodium temperature at fuel subassembly top for various heating rates is shown in Fig.1.
GEOMETRICAL DETAILS
The CP supports 12 Control Rod Drive Mechanisms (CRDMs), 210 thermo well tubings in six groups, 3 failed fuel localization modules, a Core Cover Plate (CCP), one central canal plug, Lattice Plate (LP) and other associated supports. Except for the 12 CRDMs and central canal plug, all other components mentioned above form an integral part of CP. CP is in turn supported on SRP [1]. The CP bottom portion (which is the critical region) consists of CCP, Upper Stay Plate (USP), Lower Stay Plate (LSP) and outer shell. The schematic sketch of CP is shown in Fig.2a. The present analysis is related to the junction of USP and the outer shell which is the most critical location.
Geometric Details of USP to Outer Shell Weld
The USP shell junction is the most critical location because there is Argon cover gas over the sodium free level and when the sodium temperature is increased, the argon gas temperature also rises. Moreover, the rise in sodium level results in abrupt changes in the material properties of the CP at this location. There are eight holes (M20) equispaced at the USP outer shell junction for draining. The effect of the holes is neglected. The weld details are as shown in Fig.2b.
Fig.1: Evolution of Sodium Temperature at Fuel SA Top 0
100 200 300 400 500 600 700
0 5 10 15 20
T
em
p
er
at
u
re
(
C
)
Time (Hours)
Temperature at Fuel SA top
20 K/hr
40K/hr
Fig.2b: Weld Details of USP to Outer Shell Junction
Fig.2a: Vertical Section of Control Plug
Upper Stay Plate
Thermocouple Tube Sheath
Skirt Assembly SRP Thick Plate
Shielding Plates Middle Assembly
Mechanism Box Central Canal Plug
Lattice Plate Core Cover Plate Lower Stay Plate
LOADING CONDITIONS
The level of hot pool sodium (at 453 K) at the start of power raising is ~ 26700. After reaching full power (820 K), the hot pool sodium level reaches 27400. The maximum sodium temperature at the inner surface of the CP is 853 K. Thus, the sodium travels a height of 700 mm while gaining 400 K temperature rise. The temperature of sodium within the CP is 7 K more than that outside [2]. The argon gas temperature is calculated using the formula given below and is updated at each iteration.
- (1)
Where TNa is Sodium temperature (K) and TAr is argon gas temperature (K).
The time taken to heat the primary sodium and the raise in sodium level at all the heating rates considered are given in Table-1.
Table-1: Input parameters used in the analysis
Heating Rate Heating Time Raise in Sodium level in 1 hour
20 K/h 20 h 35 mm
40 K/h 10 h 70 mm
60 K/h 6.6 h 105 mm
80 K/h 5 h 140 mm
100 K/h 4 h 175 mm
120 K/h 3.3 h 210 mm
MATERIAL DATA
The material for the construction of CP is SS 316 LN. Density has been conservatively taken at 423 K and all the other material properties have been conservatively taken at 823 K. Important material properties used for the analysis are given below. These material properties are taken from RCC MR Appendix A3 [3].
Density, ρ = 7879 kg/m3
Young’s Modulus, E = 1.8E11 Pa
Poisson’s Ratio, ν = 0.3
Expansion coefficient (α) = 16.9 x 10⁻⁶ /K
Conductivity (K) = 17.74 W/mK
Specific Heat (C) = 540 J/kgK
FINITE ELEMENT FORMULATION
ANALYSIS AND RESULTS
Case-1: At Heating Rate 20 K/h
Transient analysis of the CP with the above mentioned loading and boundary conditions has been carried out at a heating rate of 20 K/h. As the sodium temperature increases, the evolution of stress with time is shown in Fig.4.
Fig.3: FEM mesh of CP at the junction of USP- outer shell
Location-C Location-B
Location-A
Fig.4: Plot of maximum stress with respect to time 0 20 40 60 80 100 120 140 160 180 200 0 100 200 300 400 500 600 700 800 900
0 5000 10000 15000 20000 25000
T em p er at u re ( K ) M ax im u m S tr es s (M P a) Time (s)
Max Stress Evolution
Temperature (K)
The evolution of temperature and the corresponding stress distribution in the CP, at the instance of maximum damage are shown in Fig.5 and Fig.6 respectively. The maximum stress is 128 MPa.
t = 9180 s 613 K 581 K 545 K
Time (t) = 0 s 438 K
447 K
461 K
t = 21420 s 817 K 797 K 745 K
t = 9180 s 60.1 MPa
33.5 MPa
Time (t) = 0 s 0.2 MPa
33.4 MPa
128 MPa
1.6 MPa
t = 21420 s Fig.6: Stress Distribution during 461 K ≤ T ≤ 817 K
Case-2: At Heating Rate 40 K/h
The evolution of temperature and the corresponding stress distribution in the CP, at the instance of maximum damage are shown in Fig.7. The maximum stress is 148 MPa.
Case-3: At Heating Rate 60 K/h
The evolution of temperature and the corresponding stress distribution in the CP, at the instance of maximum damage are shown in Fig.8. The maximum stress is 168 MPa.
817 K 792 K 736 K
Temperature distribution Time (t) = 10710 s Stress Distribution 1.9 MPa 97.5 MPa 148 MPa
819 K 789 K 719 K
Temperature distribution Time (t) = 7140 s Stress Distribution 113 MPa 168 MPa
2.06 MPa Fig.7: Temperature and Stress Distribution at 40 K/h
Similar transient analysis of the CP with the above mentioned loading and boundary conditions has been carried out at heating rates of 80 K/h, 100 K/h and 120 K/h and the corresponding damage is estimated.
DESIGN CHECK FOR SECONDARY LOADING
Assessment of Creep Fatigue Damage during Power Raising
The creep and fatigue damage calculations have been done as per RCC-MR RB [4] for 20 K/h, 40
K/h and 60 K/h and the values are given in Table-2. The max value is calculated from the values of Pm
and Pm + Pb extracted from [4]. The creep and fatigue damages during power raising are added to those at
full power.
Table – 2: Creep and Fatigue Damage Calculations for CP Free level of Sodium
Assessment of Creep-Fatigue Damage at full power for 1000 load cycles
The creep damage and fatigue damage of CP at full power are taken from earlier studies, which have been carried out for 1000 load cycles, with a hold time of 200 hours per cycle. The damage values taken are for the case of SCRAM with flow reduction to 20 % in PSP that is given below [4]:
Inner surface:
Creep damage per cycle = 0.46E-03 Fatigue damage per cycle = 0.1E-05
Outer surface:
Creep damage per cycle = 0.8238E-03 Fatigue damage per cycle = 0.546E-05
The total number of permissible cycles has been calculated by adding the damage at full power at the outer surface to the damage caused during power raising as shown in Table-3.
Cases 20 K/h 40 K/h 60 K/h 80 K/h 100 K/h 120 K/h
∆σTot (MPa) 128 148 168 195 225 250
max (MPa) 7.5 7.5 7.5 7.5 7.5 7.5
()(%) =
()el+pl + ()cr 0.079 0.092 0.1 0.12 0.14 0.16
No. of cycles
allowable (Nd)
2.43E+12 4.4E+10 1.1E+09 2.6E+07 2.8E+06 3.9E+05
Fatigue Damage
(per cycle) 4.10E-13 2.26E-11 8.82E-10 3.75E-08 3.56E-07 2.54E-06
Sr (MPa) 135.28 143.35 150.19 158.18 166.45 173.58
tr (hours) 687318.0 431690.6 296891.3 71918.7 16654.7 1845.8
Creep Damage
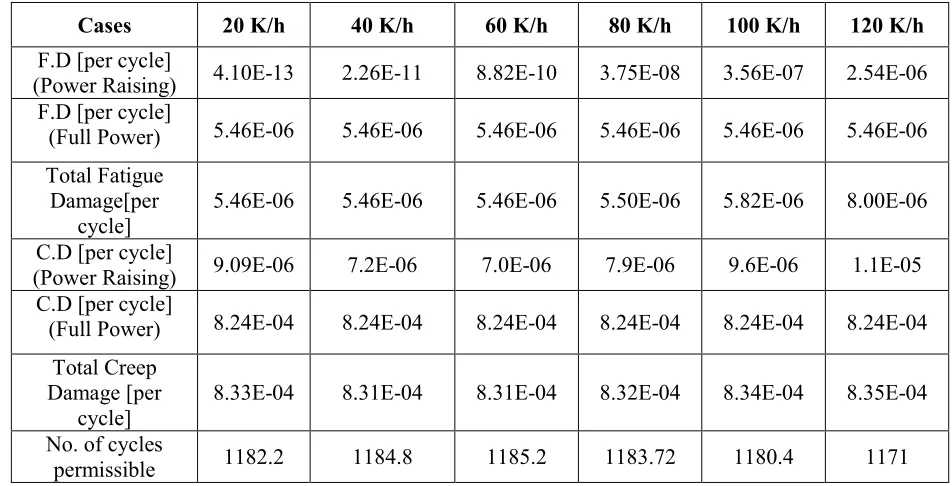
Table – 3: Total Creep and Fatigue Damage
The results show that the number of cycles permissible is greater than 861 for all the cases up to 120 K/h.
INFERENCE FROM THE ANALYSIS
From the analysis it is observed that the fatigue damage is negligible and the creep damage is relatively significant. The dependence of creep damage and the number of cycles on heating rate are presented in Fig.9. Table-4 gives the creep damage values during power raising for 861 cycles and the total number of cycles permissible. The creep hold time is the time taken for the sodium at 698 K to reach 823 K, which is the creep regime.
Table – 4: Creep Damage and Total Number of Cycles permissible
Heating Rate (K/h) Maximum Stress (MPa)
Creep Hold time (h)
Creep Damage during Heating
Total number of cycles
20 128 6.25 0.0078 1182
40 148 3.125 0.0062 1184
60 168 2.08 0.006 1185
80 195 1.56 0.018 1183
100 225 1.25 0.064 1180
120 250 1.04 0.48 1171
It is observed that the stress increases with heating rate, whereas the creep damage decreases initially due to the decrease in the creep dwell time. Subsequently, the creep damage increases due significant increase in stress. Accordingly, the total number of cycles allowable slightly increases up to 60 K/h, and thereafter decreases.
Cases 20 K/h 40 K/h 60 K/h 80 K/h 100 K/h 120 K/h
F.D [per cycle]
(Power Raising) 4.10E-13 2.26E-11 8.82E-10 3.75E-08 3.56E-07 2.54E-06
F.D [per cycle]
(Full Power) 5.46E-06 5.46E-06 5.46E-06 5.46E-06 5.46E-06 5.46E-06
Total Fatigue Damage[per
cycle]
5.46E-06 5.46E-06 5.46E-06 5.50E-06 5.82E-06 8.00E-06
C.D [per cycle]
(Power Raising) 9.09E-06 7.2E-06 7.0E-06 7.9E-06 9.6E-06 1.1E-05
C.D [per cycle]
(Full Power) 8.24E-04 8.24E-04 8.24E-04 8.24E-04 8.24E-04 8.24E-04
Total Creep Damage [per
cycle]
8.33E-04 8.31E-04 8.31E-04 8.32E-04 8.34E-04 8.35E-04
No. of cycles
CONCLUSION
Detailed structural analysis has been carried out to investigate the possible damage caused to the CP, due to the heating rate of primary sodium during power raising. The fatigue damages caused due to power raising at the free level of sodium for heating rates 20 K/h, 60 K/h, 100 K/h and 120 K/h are 3.53 E-10, 7.59 E-07, 3.06 E-04 and 2.19 E-03 respectively and the corresponding creep damages are 7.8 E-03, 6.0 E-03, 8.2 E-03 and 9.6 E-03 for 861 cycles. The number of allowable cycles determined by combining the creep and fatigue damage values at full power with the values at power raising and the values are 1182, 1185, 1180 and 1171 cycles at heating rates 20 K/h, 60 K/h, 100 K/h and 120 K/h respectively. The creep damage decreases initially due to the reduction of creep dwell time at higher heating rate in spite of increase in stress. On further increase in heating rates, the effect of increase in stress overpowers the low creep dwell time, resulting in higher creep damage and thereby lower number of cycles permissible. Hence, a sodium heating rate of 60 K/h is recommended during power raising in view of CP life. This reduces the power raising duration from 20 hours to 6.6 hours.
REFERENCES
Chellapandi P. et. al., “Stress Analysis of Bottom Portion of Control Plug”, PFBR/31410/DN/1013/R-A. Natesan K. et. al., “Transient Thermal Evolution in various parts of Control Plug Immersed in Sodium
during SCRAM”, PFBR/31410/DN/1040/R-A.
RCC-MR Section I, Subsection Z, “Technical Appendix A3”, 2007.
Chellapandi P. et.al., “Life Prediction of Control Plug”, PFBR/RG/31410/DN/1022. Fig.9: Number of cycles and creep damage vs. heating rate
0 0.002 0.004 0.006 0.008 0.01 0.012 1160 1180 1200 1220 1240 1260 1280 1300
0 50 100 150 C
re ep D am age d u e t o P ow er R ai si n g T ot al n o. of c yc le s
Heating rate (K/h) Total no. of cycles