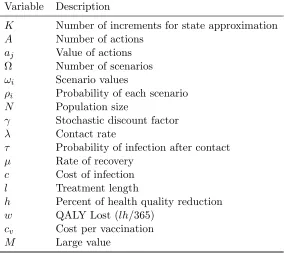
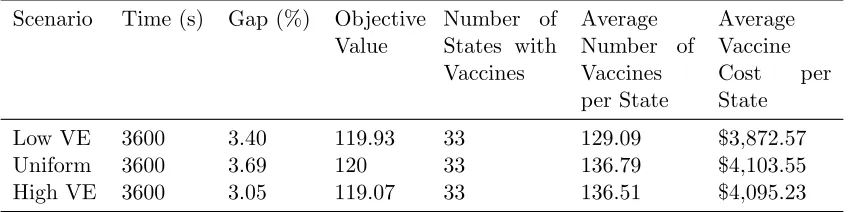
ABSTRACT
RULON, CHRISTINA MARIE. Optimizing Vaccine Distribution During an Influenza Pandemic. (Under the direction of Osman Ozaltin.)
Vaccination is critical in circumventing an influenza pandemic. By its very nature, a new strain of influenza virus may develop and spread rapidly throughout spatially distributed
pop-ulation groups. A direct causal effect of such unfettered growth is an initial scarcity of vaccines.
Accordingly, minimization of the number of vaccines needed to contain the pandemic is im-perative for effective disease mitigation. Given a heterogeneous age distributed population, in
the first model we develop a mixed-integer programming formulation to determine the minimal
fraction of each subgroup to vaccinate such that pandemic elimination results. This formu-lation employs a surface threshold characterization to describe where the minimal fractions
reside. Furthermore, it allows for the unique representation of contract rates, susceptibility and
infectiousness for each age group. Disease elimination occurs when the reproduction number is less than or equal to one. We use the spectral radius, the largest magnitude eigenvalue of the
next generation matrix, to define the reproduction number in a heterogeneous population. We
analyze results from the optimization model using the parameters from the 1957 Asian influenza A pandemic. Using U.S. population projections and future age group distribution factors, we
evaluate the results of the optimization model. Additionally, the evaluation of vaccines at
vary-ing levels of efficacy, provides insight into the problematic scenario of ineffective vaccines. From these results, we observe an inequitable distribution of vaccines to heterogeneous subgroups.
Therefore, we consider the addition of fairness constraints to ensure equitable vaccine
dissemi-nation, and we analyze the additional vaccines needed to satisfy these constraints.
Other difficulties in vaccine distribution present as public health decisions regarding the
implementation of vaccines to combat an influenza pandemic are made under a shroud of
un-certainty. In this regard, decision makers face the daunting challenge of balancing competing concerns. On one side of the scale is the concern for employing proper proportions of vaccines
to eliminate widespread infection. The competing predicament is the fiscal cost associated with
implementing the vaccines and the health concerns of lost quality adjusted life years due to infection. Use of dynamic optimization techniques to weigh these competing objectives allow
public health decision makers to consider the most recent information in determining the op-timal vaccine strategy. In he second model, we employ an infinite horizon Markov Decision
Process (MDP) model to provide instruction for establishing health policies regarding the
pro-portion of susceptible individuals to vaccinate in each possible state of disease progression. The expected discounted reward optimality equations developed from this MDP are solved using a
intro-duce another layer of uncertainty through development of a two stage stochastic program to
explore unpredictability surrounding vaccine efficacy. Results of this optimizations are evalu-ated using the parameters from an influenza outbreak at an English boarding school. These
results yield insight to various facets of optimal vaccine distribution based on susceptible and
©Copyright 2016 by Christina Marie Rulon
Optimizing Vaccine Distribution During an Influenza Pandemic
by
Christina Marie Rulon
A thesis submitted to the Graduate Faculty of North Carolina State University
in partial fulfillment of the requirements for the Degree of
Master of Science
Operations Research
Raleigh, North Carolina
2016
APPROVED BY:
Maria Mayorga David Papp
Osman Ozaltin
DEDICATION
BIOGRAPHY
Christina Rulon graduated from the College of Mount St. Joseph in 2012 obtaining a Bachelors of Science degree in Business/Mathematics and Accounting. After working for a year in the
accounting field, Christina entered North Carolina State University in the fall of 2013 pursuing a Masters of Science in Operations Research. Upon graduation, Christina will begin an Oak
Ridge Institute for Science and Education (ORISE) fellowship at Wright-Patterson Air Force
ACKNOWLEDGEMENTS
I would like to express my gratitude to my advisor, Dr. Osman Ozaltin, for his continual assistance and support. Additionally, I would like to thank him for taking the time to teach
me new concepts related to mathematical programming and Markov decision theory as well as opening new doors by introducing me to the mathematical study of epidemiology. I greatly
appreciate the firm foundation he has given me in these concepts which I can continue to explore
in future endeavors.
I am grateful for Dr. Maria Mayorga and Dr. David Papp for agreeing to serve as committee
TABLE OF CONTENTS
LIST OF TABLES . . . vii
LIST OF FIGURES . . . .viii
Chapter 1 Introduction . . . 1
Chapter 2 Optimizing Vaccine Distribution in an Age-Structured Population 4 2.1 Introduction . . . 4
2.2 Literature Review . . . 6
2.2.1 Basic Reproduction Number and Heterogeneous Models . . . 6
2.2.2 Mathematical Models related to Pandemic Influenza . . . 7
2.3 Mathematical Support from Previous Articles . . . 10
2.4 Model Formulation . . . 14
2.4.1 Mixed Integer Solutions Approach . . . 15
2.5 Results . . . 17
2.6 Conclusion . . . 22
Chapter 3 A Markov Decision Process for Vaccine Distribution . . . 24
3.1 Introduction . . . 24
3.2 Literature Review . . . 26
3.3 Previous Mathematical Contributions . . . 27
3.3.1 Decision Epochs . . . 27
3.3.2 States . . . 28
3.3.3 Actions . . . 29
3.3.4 Transition Probabilities . . . 29
3.3.5 Rewards . . . 32
3.4 Optimizing Health Policies . . . 33
3.4.1 Decision Rules . . . 33
3.4.2 Linear Program . . . 34
3.4.3 Stochastic Programming . . . 35
3.5 Results . . . 36
3.5.1 State Aggregation . . . 36
3.5.2 Stochastic Program Results . . . 38
3.6 Conclusion . . . 46
Chapter 4 Conclusions. . . 48
4.1 Conclusion and Future Considerations . . . 48
References. . . 50
Appendices . . . 55
Appendix A Appendix A . . . 56
A.2 GMPL file . . . 57
Appendix B Appendix B . . . 59
B.1 Initial Values . . . 59
LIST OF TABLES
Table 2.1 Initial Values . . . 18
Table 3.1 Variables for Stochastic Program Formulation . . . 39
Table 3.2 Vaccine Efficacy and Probability of Occurring . . . 42
Table 3.3 Varying Scenarios . . . 43
Table 3.4 EVPI: Lowest Expected Vaccine Efficacy . . . 45
Table 3.5 EVPI: Uniform Probability of Scenarios . . . 45
Table 3.6 EVPI: Highest Expected Vaccine Efficacy . . . 46
Table A.1 Values Used in the Next Generation MatrixR . . . 56
Table A.2 Initial Values for the MILP . . . 57
LIST OF FIGURES
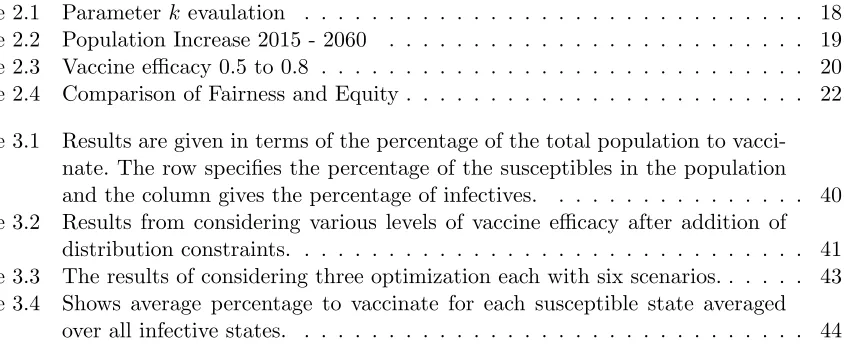
Figure 2.1 Parameter kevaulation . . . 18
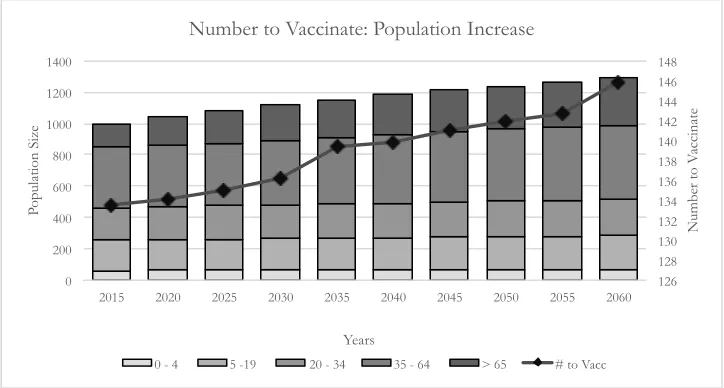
Figure 2.2 Population Increase 2015 - 2060 . . . 19
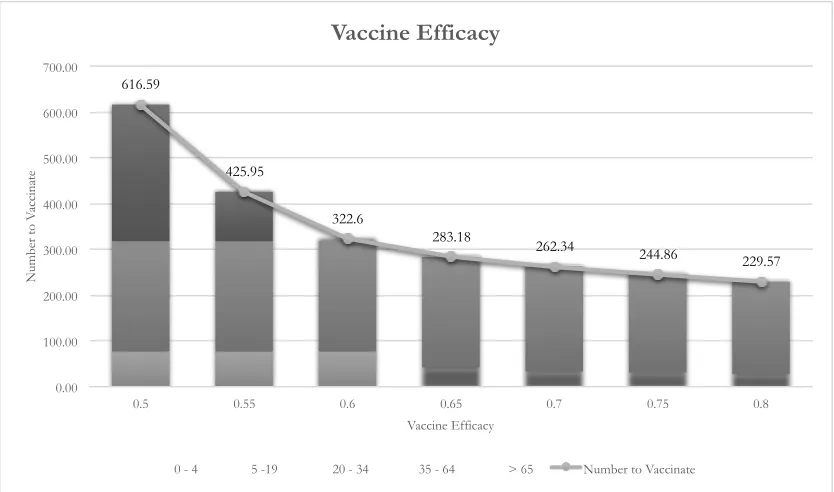
Figure 2.3 Vaccine efficacy 0.5 to 0.8 . . . 20
Figure 2.4 Comparison of Fairness and Equity . . . 22
Figure 3.1 Results are given in terms of the percentage of the total population to vacci-nate. The row specifies the percentage of the susceptibles in the population and the column gives the percentage of infectives. . . 40
Figure 3.2 Results from considering various levels of vaccine efficacy after addition of distribution constraints. . . 41
Figure 3.3 The results of considering three optimization each with six scenarios. . . 43
Chapter 1
Introduction
Influenza is an acute viral infection that is easily transmitted from person to person [51]. Although it is commonplace for influenza strains to emerge seasonally, the occasion of certain
circumstances can lead to the evolution of a novel virus strain. A novel strain of influenza
disseminates throughout a susceptible population of a geographic area largely due to lack of immunity from previous strains. A pandemic, which is considered a global outbreak of a disease,
then develops as a result of the novel strain moving swiftly through the population due to the
natural interaction between geographic areas and populations leading to rapid worldwide spread ( [14] and [26]). Despite the fact that an influenza of pandemic proportions does not occur with
regularity, the impact of such a pandemic can be remarkably devastating to a society in terms
of its heightened illness levels, overburdened health care systems and elevated mortality rates as well as social and economic disruptions. In essence, it is these consequences that come to
characterize an influenza pandemic.
The foremost characteristic of an influenza pandemic is higher illness rates. Attack rates of the virus are higher across all age groups in the population, and very often, they adversely affect
age groups not usually burdened by seasonal influenza. A historical comparison of pandemics
and seasonal influenza strains provide evidence for this concept. Seasonal influenza annually affects five to ten percent of adults and 20 to 30 percent of children, and it can cause serious
medical complications for the following groups: children younger than two years of age, adults
age 65 and over, pregnant women and people with pre-existing medical conditions [51]. However, in a pandemic, even individuals outside of the aforementioned risk groups are at an increased
danger of falling prey to the higher attack rates and illness. During the 1918-1919 pandemic
outbreak, commonly referred to as the Spanish flu, illness rates for the 20 to 40 percent of the worldwide population that was afflicted were highest in those aged 20 to 50 years old [27].
41 percent of all hospitalizations [10].
In addition, another consequence of pandemic influenza is reflected in the mortality rates. During an influenza pandemic, mortality rates may be elevated for the entire population [26].
Specifically, studies have shown that even age groups not significantly impacted by seasonal
influenza may have elevated mortality rates. A look at statistical evidence from the Spanish flu reveals that mortality rates were highest for individuals in the age group of 20 to 50 [27]. Also,
empirical evidence from the H1N1 pandemic shows that of the approximately 12,465 deaths,
none were in individuals over 65 years of age ( [11] and [27]). Nonetheless, contradictions in the age-structured illness and mortality rates for seasonal influenza should not be viewed as the
pandemic norm. Of the approximately 69,800 people who died from the 1957 Asian influenza
pandemic, the elderly had the highest rates of death. Additionally, those over 65 years of age were the most likely to die in the 1968 Hong Kong flu virus [27].
Over and above these life threatening consequences of higher illness and mortality rates,
pandemic influenza can greatly overburden health care services. With the rapid and largely unrestrained spread of illness throughout the entire population, a significantly larger number
of individuals will be seeking medical care and emergency room services. As a result, resources
such as staff, facilities, equipment, treatment medications and hospital beds will become quickly exhausted [26]. As an analogous consequence, an influenza pandemic can be very disruptive to
the economy as skilled laborers are left with little choice but to stay home from work to care for themselves, their children or other loved ones. This workforce issue may cause some businesses to
close while others find production significantly reduced. Furthermore, as a preventative measure
to stop the spread of the influenza virus some businesses and schools may close during the pandemic, which increases the social and economic disorder [26].
Due to these catastrophic and often fatal consequences, mitigation of an influenza pandemic
is essential to alleviate illness, reduce mortality and circumvent adverse economic performance. Yet, as a direct result of the sporadic and novel nature of the influenza strain, public health
de-cision makers are left with little time to prepare in order to lessen and prevent these problematic
effects as a new strain begins to spread. Therefore, these officials must remain mobilized in order to optimally employ the control measures at their disposal. According to the Centers for Disease
Control and Prevention (CDC), influenza vaccines are the best way to prevent the spread of
influenza [12]. However, since the strain is initially unknown and the time the pandemic will strike is unable to be predicted, vaccines are initially scarce in any pandemic situation. With
vaccines as the most pivotal preventative element, questions arise as to the optimal distribution
strategy of this scarce resource.
Throughout this thesis we will consider the fundamental question of vaccine distribution
through two distinct models. In chapter two we consider the optimal distribution of vaccines
results. As evidenced by past pandemic situations, unique virus strains affect age groups in
the population differently. Therefore, in this formulation, we consider subgroups with contact rates, susceptibility and infectivity differing by age group. For this model, a mixed integer
programming solutions approach is developed to determine the minimal portion of each age
group to vaccinate in order to eliminate the epidemic from the population. Results are evaluated based on various levels of vaccine efficacy and population distribution. Finally, we consider the
consequence, in terms of additional vaccines, of the addition of fairness and equity constraints.
In chapter three we consider optimal vaccination strategies in regards to minimizing pan-demic related costs through use of a Markov decision process (MDP). The MDP is solved with
a linear programming solutions approach to determine optimal vaccine strategies. Further, we
increase the uncertainty considered in the model by including vaccine efficacy as a stochastic parameter. Results are given for different scenarios of the stochastic model.
In chapter four we provide a summary of both models. In addition, we present final
Chapter 2
Optimizing Vaccine Distribution in
an Age-Structured Population
2.1
Introduction
Vaccination is the critical response in circumventing an influenza pandemic. Nevertheless, when
a threatening influenza pandemic emerges, vaccine availability will not meet global demand. This leaves public health officials with an immediate and challenging dilemma [19]. Namely,
public health officials must determine the most effective distribution of a limited supply of
vac-cines among competing age groups within the population. As provided in chapter 1, pandemic influenza often presents with increased illness in age groups not normally burdened by seasonal
influenza, which makes the task of deciding the most effective age group to vaccinate even more
daunting. When modeling pandemic influenza, these illness related factors are often measured through the contact rate, susceptibility and infectivity, which vary immensely based upon the
age group of an individual and the behavior of the circulating influenza strain. This is supported
by various studies examining historical pandemics.
Let us first evaluate studies that have considered the contact rate in age-diversified
popu-lations. The number of close interactions of one individual with another over a specified period
of time is known as the contact rate. The likelihood of becoming infected is strongly influenced by the number of contacts a susceptible individual has with others in the population [47].
Addi-tionally, the ages of the contact individuals vary extensively based on the age of the susceptible individual. Consideration of the daily encounters of school-aged children in comparison with
elderly individuals illuminates this concept. School-aged children come in contact with
numer-ous individuals on a daily basis including other children in school, teachers and extracurricular activity groups. In addition, school-aged children have close interactions with their parents,
individuals who may have relatively little close contact with others in the population on a daily
basis and fewer interactions overall, even among their own age and peer groups. In fact, the ar-ticleThe Shifting Demographic Landscape of Pandemic Influenza, points to five studies, all but
one of which support the theory that children have the highest rates of contact among all age
groups in the population. In addition, the study associated with the article, J. Mossong [33], cites the numerous and age-diversified contact rates of children as a primary reason for disease
propagation throughout the entire population. These studies provide conclusive evidence as to
the importance of considering the behavior of individuals based on their age as it pertains to interactions with others when evaluating a threatening influenza pandemic.
Once contact has been established between individuals, the rates of susceptibility and
infec-tivity play an important role in determining if the disease will be transmitted from the infective individual to the susceptible individual. Once again, these rates vary based on the disease
be-havior of the pandemic as it targets certain age groups. One study provides that children were
twice as susceptible to infection during the 2009 H1N1 virus as adults 19 to 50 years of age liv-ing in the same household [48]. Furthermore, younger adults were more susceptible than those
aged 50 and older [48]. In regards to infectivity, we can examine evidence from the Asian and
the Hong Kong influenza pandemics, as well as the H1N1 pandemic influenza strain. During the Asian pandemic, children had a higher rate of infectivity than adults; however, for the Hong
Kong pandemic, the infectivity was similar for all age groups [36]. Additionally, S. Cauchemez and Ferguson [48], provide that infectivity was not significantly different based on age for the
H1N1 pandemic. As witnessed by these studies, it is crucial to consider the influence of the
disease on certain targeted age groups in regards to heightened degrees of susceptibility and infectivity.
These studies present the need for a model that optimizes the distribution of vaccines
with consideration of the age-dependent contact rates, susceptibility and infectivity for an emerging influenza strain. In section 2.2, we review literature pertaining to this topic. The
next section, 2.3, provides a review of the important mathematical concepts that pertain to
this chapter. In section 2.4, we develop a mixed integer programming optimization model to determine the minimum number of each heterogeneous, age-distributed subgroup to vaccinate
in order to eliminate the pandemic from the population. Further, we implement a mixed integer
programming solutions approach. Finally, in section 2.5, we provide results of the optimization. Additionally, as motivated by these results, we consider the addition of fairness and equity
constraints in terms of the increase on the number of vaccines needed to eliminate the pandemic.
2.2
Literature Review
As a result of the increase in the study of epidemiological data, rapid advancements were made in
the scientific understanding of infectious disease characterization and transmission throughout the 20th century [6]. As a direct corollary of growth in scientific understanding, mathematical
models became more advanced in their ability to analyze infectious disease spread and
effec-tively recommend control measures to stifle threatening epidemics. In Adivar and Selen [1], which reviews some of this epidemiological literature from academic journals between 1971 and
2010, the studies are categorized into two groups: theoretical, focusing more on mathematical
relations, and empirical research, focusing on a certain infectious disease. In this study, we will review literature in both areas. From a mathematical standpoint, we will review concepts as
they pertain to the basic reproduction number and heterogeneous populations. Additionally, we will look at specific models that have been developed for the study of pandemic influenza.
2.2.1 Basic Reproduction Number and Heterogeneous Models
In the early 20th century, the critical concept of the ‘net reproduction rate’ began making its way
from demography into the mathematical study of infectious diseases [6]. In 1952, the concept was introduced in epidemiology as the ‘basic reproduction rate’ by MacDonald during his work
with Malaria. However, much later, in Diekmann’s research in 1990, it was stated that the term
‘rate’ should be changed to ’basic reproduction ratio’ or ‘basic reproduction number’ since the value is dimensionless [18]. C.P. Farrington and Gay [15] defines the basic reproduction number,
symbolized as R0, as the expected number of secondary infections in a completely susceptible
population produced by a typical infected individual during its entire infectious period. This concept of considering initial spread is described as a ‘branching process’ where susceptible
individuals are infected, while neglecting the consideration of a decrease in susceptibles [18]. This value characterizes the ability of an infectious disease to invade a population, the effort needed to
control an infection that has already penetrated a geographical region and the control measures
needed to prevent a pandemic [21]. For these reasons, the basic reproduction number is hailed as one of the most important concepts in the mathematical study of infectious diseases [21].
Review of developments regarding the basic reproduction number provide an important basis
for subsequent concepts.
Early considerations that contributed to the development of the basic reproduction number
in epidemiology can be traced to Ross in 1911 [21]. While working with Malaria, he discovered
that the number of mosquitoes per individual in the population must exceed a certain number in order for the disease to persist [15]. These theories were formally defined in the work of Kermack
and McKendrick as threshold criteria. The threshold theorem states that the introduction of
density of susceptibles is above a critical value [4]. The value of the basic reproduction number,
R0, corresponds to this theorem as it is used to describe this threshold behavior. WhenR0 ≤1,
the epidemic does not persist; however, when R0 > 1, the infectious disease can invade the
population [21]. These concepts were further popularized by Dietz [17] in 1975, and further, by
Anderson and May in a conference on infectious diseases in 1982 [5] (reviewed in [18]).
This early work regarding the basic reproduction number laid the foundation for another
significant advancement in threshold behavior. Namely, this consideration involves the value of
the basic reproduction number in a population with multiple classes of infective individuals [34]. These multiple classes are often called heterogeneous subgroups. Dividing the population into
heterogeneous classes is a critical component in understanding and adequately modeling many
infectious diseases. Depending on the disease characteristics and modeling objective, these dis-joint classes could be based on a variety of different disease related factors, such as transmission
method, infective period, latent period, and genetic susceptibility, or based on factors of age,
economic status, geographic location, and cultural disposition [24].
Although heterogeneous populations were considered in early works, such as Hethcote [23]
and I.M. Longini and Elveback [31], O. Diekmann and Metz [43] discover a valuable method
for evaluating the basic reproduction number in a heterogeneous population. This method of determiningR0 is based on calculation of the next generation operator and can be used for any
number of discrete, disjoint classes. They derive the basic reproduction number, mathematically, as the dominant eigenvalue of a positive linear operator. The value of R0 in a heterogeneous
population as the largest magnitude eigenvalue has been heavily employed in a number of
studies.
One such work, Hill and Longini [28], vaccine distribution during an influenza pandemic in
a heterogeneous population is analyzed and an equation is found that characterizes the surface
on which the critical vaccine fractions reside. The critical vaccine fractions are defined as the minimum fraction of each subgroup to vaccinate in order to eliminate an epidemic from the
population. Therefore, this surface characterization is significant as it gives all fractions that
result in aR0 of one, meaning the pandemic is eliminated. This thesis determines the vaccine
fractions on this surface that minimize the total number of vaccines needed to eliminate the
pandemic through a mixed integer programming optimization routine.
2.2.2 Mathematical Models related to Pandemic Influenza
Many diverse mathematical methods have been used to consider the transmission of pandemic
models based on their approach as either deterministic or stochastic. Further, some models
employ optimization methods to determine the ideal control strategy. Optimization techniques provide the added capability to look beyond predetermined strategies to discover optimal control
methods [42]. The addition of these optimization routines are especially useful when the goal
is to determine the optimal amount of a resource to distribute based on a given objective, such as minimization of costs, illness or mortality. This concept has been particularly crucial
in determining the most advantageous distribution of a limited supply of vaccines during an
influenza pandemic. In the remainder of this section, we provide a review of deterministic and stochastic models in regards to the problem they evaluate. Then, we examine some articles that
have employed the use of optimization approaches.
Deterministic Models
Deterministic models were one of the earliest methods used to consider the propagation and control of infectious diseases [22]. These models provide an ideal starting point for consideration
of mathematical modeling in epidemiology. Some of the foundational theories discovered through
these early deterministic models are still used today. Hethcote and van Ark [24] provides an overview of various deterministic models and considers models for both infectious diseases which
occur quickly and those that are endemic in a population. Furthermore, this study evaluates
the use of heterogeneous and homogeneous populations. Three immunization campaigns are evaluated in which the population is disseminated into cities and villages with homogeneous
mixing within these geographic areas and a limited number of interactions between them.
Another deterministic model, May and Anderson [39], considers the distribution of vaccines in the cities and villages structure during an outbreak of a micro parasitic infection. This
research shows that for some cases fewer immunizations are required than when assuming
homogeneous mixing. Both of these deterministic models highlight the importance of considering heterogeneous populations when studying infectious diseases.
Additionally, some deterministic models related to pandemic influenza consider a specific
facet of the infectious disease. Examples of these studies include Matrajt and Longini [38], L. Matrajt and Longini [35], and Teytelman and Larson [50]. They address the possibility of
a secondary wave, multi-dose vaccines, and differing stages of spread in geographical regions, respectively. Certainly, the vast scope of these three articles illuminates the important role of
deterministic models in considering all angles of an infectious disease, which in this case is
pandemic influenza.
This review of deterministic models provides evidence as to the vast considerations that can
be researched through this modeling approach. Deterministic formulations have been widely
ef-fective in considering various subgroups in the population, especially geographically distributed
regions and age-related factors. However, as scientific study becomes more advanced, practi-tioners are left with a need to evaluate additional factors. Consequently, a major element left to
consider is the effect of uncertainty. This uncertainty can arise in many forms, such as contact
rates, susceptibility, infectivity, and vaccine efficacy. Whereas, deterministic models evaluate these variables with a single estimate, stochastic models provide the ability to use probability
distributions to reflect some of this uncertainty. We will next evaluate the addition of
uncer-tainty in mathematical models by reviewing several stochastic formulations.
Stochastic Models
Stochastic models provide a useful tool to mimic the inherent uncertainty that comes with
any natural process. Consequently, these models are helpful in evaluating certain unknown
parameters in pandemic influenza. L.R. Elveback and Gatewood [37] is one significant work in the realm of pandemic influenza modeling which incorporates these stochastic parameters.
Specifically, the stochastic variables in this model include variability in infectivity, latent, and
withdrawal periods, as well as rates of susceptibility and infectivity. The results of this model are compared with historical data, and therefore, parameters from this work have been used in
other models and for validation purposes [31].
Other stochastic models consider varying facets of influenza, such as, parameter estimation and control strategies. Two examples are I.M. Longini and Halloran [32] and Britton [7] which
considers multiple control measures to contain an emerging pandemic and estimates R0 from
the final size of an outbreak in a community, respectively. These studies serve to illuminate the additional considerations that are incorporated into stochastic models.
Optimization Approaches
As evidenced by the previous research, deterministic and stochastic models have provided many
beneficial results in epidemiology. Nevertheless, optimization is a valuable tool in Operations Research that can further aid in the consideration of finding optimal control strategies.
Opti-mization is advantageous as it does not depend on the consideration of predetermined strategies
but rather finds a mathematically optimal solution based on the model [42]. Studies have used a variety of heuristic approaches to solve optimization formulations with the goal of determining
the best control strategy. We examine some of these significant studies particularly as they
relate to pandemic influenza.
I.M. Longini and Elveback [31] provides one of the pioneering works in the study of
op-timizing vaccine distribution during an influenza pandemic. In this research an age-stratified
preschool, school age, young adults, middle aged adults, and older adults. A deterministic model
of disease spread is considered and a non-linear program is formulated. Due to the objective function structure, this study employs an iterative guessing routing based on a grid search to
determine the optimal results.
In addition to the computational optimization method and deterministic model used by I.M. Longini and Elveback [31], Hethcote and Waltman [25] and Greenhalgh [20] evaluate the
distribution of vaccines through use of a deterministic simulation model with dynamic
pro-gramming optimization techniques. Hethcote and Waltman [25] considers a model that could be implemented for a variety of epidemic diseases with the objective of keeping the number of
infectives below a fixed value. Greenhalgh [20] also examines the objective of minimizing the
number infected; however, the associated model includes a heterogeneous population. Further-more, Greenhalgh [20] considers both vaccination and removal of infectives from the population
as control measures.
Other pandemic influenza research that incorporates optimization techniques include Med-lock and Galvani [40] and S. Lee and Chowell [49]. The research performed in MedMed-lock and
Galvani [40] aims to effectively distribute vaccines based on five different outcome measures.
This study uses an age structured compartmental model along with a non-linear simplex algo-rithm to determine optimal distributions. S. Lee and Chowell [49] works to find time-dependent
optimal vaccination policies through an optimal control problem aimed at minimizing the num-ber of infected individuals over the entire pandemic. This study computes a variety of optimums
based on different vaccine coverage and transmission levels through the use of Pontryagins
Max-imum Principle.
These optimizations studies show the breadth of considerations and solution approaches
that have been implemented in evaluating the optimal distribution of vaccines. This work
will expand upon the previously discussed work of Hill and Longini [28] to determine optimal vaccine distribution in an age-structured heterogeneous population through a mixed integer
programming solutions approach. This solution approach allows for efficient use of optimization
software in order to find an optimal distribution.
2.3
Mathematical Support from Previous Articles
As the objective of this chapter is to develop a model that finds the minimum number of
in-dividuals to vaccinate to eliminate the influenza pandemic, we present some of the important contributions of Hill and Longini [28] and I.M. Longini and Elveback [31], which aid in the
advancements made in this chapter. Specifically, we consider theories related to the basic repro-duction number in a heterogeneous population, defined as the next generation matrix, which
considering how Hill and Longini [28] utilizes this next generation matrix to consider vaccine
distribution in a heterogeneous population for an influenza pandemic. Through consideration of this next generation matrix, Hill and Longini [28] develops a characterization of the surface
where all vaccine fractions reside such that the reproduction number is one. Additionally, we
provide some concepts from I.M. Longini and Elveback [31] that are used to calculate the entries that comprise this next generation matrix.
As a starting point, we consider the characterization of the basic reproduction number in a
heterogeneous population as expressed in Hill and Longini [28]. Previously, we defined the basic reproduction number, R0, as the number of secondary infections caused by a single infectious
individual in a completely susceptible population [22]. Additionally this number is related to the
reproduction number in order to consider the influence of vaccines on the population. Therefore, Hill and Longini [28] uses the reproduction number, Rf, to denote the basic reproduction
number after the effect of vaccination. Consequently, in the absence of vaccines, the basic
reproduction number is identical to the reproduction number,R0 =Rf. Therefore, the interests reside in the value ofRf such that the disease will not persist in the population. From previous
discussions, we know that if the value of R0 ≤1 the disease is eliminated. Thus, the objective
of Hill and Longini [28] is to determine the value of the vaccine fractions such thatRf = 1. Due to the age-structured population, the discussion of the basic reproduction number is
extended to consider a heterogeneous population. As discussed in Hill and Longini [28], let m homogeneous age groups define the heterogeneous population, such that m∈ J. Additionally, let Rij represent the expected number of secondary infections in unvaccinated individuals in
subgroupi∈ J caused by a single unvaccinated infectious individual in mixing groupj ∈ J [28]. Then, them×m next generation matrix,R, is:
R=
R11 R12 . . . R1m R21 R22 . . . R2m
..
. ... . .. ...
Rm1 Rm2 . . . Rmm
From O. Diekmann and Metz [43], we know the basic reproduction number is the spectral
radius of the next generation matrix, R. Therefore, Hill and Longini [28] are interested in the
vaccine fractions that reduce the largest eigenvalue of the matrix toRf = 1. Before considering how Hill and Longini [28] incorporated the affects of vaccines on R, we must determine the
calculation of the entries,Rij, that comprise this matrix.
i ∈ J and susceptible individuals in age group j ∈ J. Additionally, let nj be the number of individuals in age group j ∈ J. With these variables defined, the following represents the average number of contacts from subgroup itoj:
niβij nj
In order to continue toward the goal of definingRij, this contact rate must take into account
the susceptibility of an individual in age group j and the infectivity of an individual in age
group i. Let Ej and Hi represent the relative susceptibility and infectivity, respectively, of an individual in age group i, j ∈ J. Then, the total number of contacts between unvaccinated infectious individuals in subgroup iand susceptible individuals in subgroupj becomes:
niβijHiEj nj
In order to derive the final value of Rij, we must take into account the rate of infectious
individuals that are no longer circulating due to removal or recovery. Let γi represent the infectious removal proportion for age groupi. This final calculation comprises the entries of the
matrixR (for more information on this calculation, see I.M. Longini and Elveback [31]):
Rij =
niβijHiEj njγi
(2.1)
Accordingly, the Rij variables are now used to assist in defining when the epidemic
termi-nates. Working towards our objective for this chapter, we now present the first formulation of the minimization problem. Let fj be the fraction of vaccinated individuals in age group j∈ J. With this variable defined, we consider the model described by Hill and Longini [28]:
min f
X
j
njfj (2.2a)
subject to Rf = 1, (2.2b)
0≤fj ≤1, j∈ J (2.2c)
Objective (2.2a) minimizes the number of individuals vaccinated. The decision variables are
epidemic elimination. This model discussed in Hill and Longini [28] allowed the authors to
develop a surface characterization of all fractions such that a reproduction number of one would result.
With the entries of R calculated and this initial model formulated, we now discuss the
integration of vaccines into R such that Rf = 1. To this end, Hill and Longini [28] develops a threshold surface characterizing the vaccine fractions when constraint (2.2b) is satisfied. In
the remainder of this section, we present the characterization that was formulated by Hill and
Longini [28]. Letθandφrepresent the vaccine efficacy against susceptibility and infectiousness, respectively. Furthermore, let ψ= 1−θφ be the vaccine efficacy. Also, we define the auxiliary variable dj = 1−ψfj. Likewise, let D = I −ψF, where F is a matrix with the vaccination fractions on the diagonal, F =diag[f1, f2, . . . fm], and I is the m×m identity matrix. Then,
the reproduction number after vaccination, Rf, is the spectral radius ofRD.
Theorem 1 Let A be a non-negative, indecomposable matrix and let ρ(A) denote its spectral
radius. The non-negative square matrix, A, has exactly one eigenvector with positive entries.
Furthermore, this eigenvector corresponds to the spectral radius eigenvalue, ρ(A).
Theorem 1 is called the Perron-Frobenius theorem. Insight and explanations into this theorem, especially in regards to the terms non-negative and indecomposable, can be found
in Hunter [29]. Non-negative is defined as a matrix with all positive entries. Considering the
previously discussed calculation of entries in this matrix, the matrix should always be non-negative. Indecomposable, also known as irreducible, means that matrix is not capable of being
reduced to the following form:
R =
"
R11 0
R21 R22
#
Hill and Longini [28] assumes the matrixR is indecomposable, as does this thesis. In this
assumption, the authors describe the characteristic in terms of its meaning to the pandemic influenza model stating that this assumption eliminates the possibility that some subgroups
encounter major outbreaks where as other subgroups are unaffected. Hill and Longini [28] also
references Anderson and Britton [3] regarding this assumption of an indecomposable matrix. With Theorem 1 holding for the pandemic influenza model discussed, the next step is to
ensure that for the next generation matrix, R, there is exactly one eigenvector, with possible
scalar multiples, that corresponds to the spectral radius. In order to contain the pandemic, the post-vaccination reproduction number must be less than or equal to one, Rf = ρ(RD) ≤ 1. When Rf = 1, by Theorem 1, the RD matrix must have positive left and right eigenvectors,
m X
i=1
viRijdj =vj ⇒dj = vj Pm
i=1Rijvi
= vj
(vTR) j
⇒ψfj = 1− vj (vTR)
j
(2.3)
Let vj be the jth component of the eigenvector associated with the spectral radius and Rij be the ijth component of the next generation matrix. Upon solving for the fractions, fj,
in (2.3) Hill and Longini [28] generate a surface characterizing all threshold solutions. (Note
that scalar multiple solutions are avoided through the normalization of v,||V||= 1.)
fj =ψ−1
1− vj
(vTR) j
such that ||V||= 1 vi≥0 ∀i
2.4
Model Formulation
In this section, we formulate a mathematical model to determine the minimum number of vaccines needed to eliminate an epidemic from a heterogeneous, age-structured population. The
results are given in the form of the fraction of each disjoint subgroup that should be vaccinated to just achieve elimination, which are denoted elsewhere as the critical vaccine fractions [28].
We are interested in the combination of fractions on the threshold surface that yields the
smallest value of P
jnjfj. Using the work of Hill and Longini [28] and replacing the threshold surface fraction definition forfj in formulation (2.2), returns the following:
min v
X
j
njψ−1
1−P vj
iRijvi
=X
j
njψ−1− X
j
njψ−1
vj P
iRijvi
(2.4a)
subject to 1−ψ≤ P vj
iRijvi
≤1, j ∈ J (2.4b)
X
j
vj = 1 (2.4c)
In formulation (2.4), the decision variables are the components of the eigenvector, vj.
Con-straint (2.4b) is analogous to (2.2c). The new conCon-straint (2.4c) is responsible for normalizing the components of v. Constraint (2.2b) is no longer required as it is always true when fj is
on the threshold surface. The first term of (2.4a) is constant and can be omitted. Thus, the
max v
X
j
njψ−1
vj P
iRijvi
2.4.1 Mixed Integer Solutions Approach
The current problem is in the form of a fractional program. We now propose a mixed-integer
programming reformulation. The first step to consider is discretization of the variablesvj.
Previ-ous discussions provide evidence that these variables must be between zero and one. Therefore, we let vj =PKk=02−kx
j
k where K is the number of discretization variables. Then, consider the 0-1 fractional program:
max x
X
j
njψ−1
PK
k=02
−kxj
k
P
iRij
PK
k=02−kx
j k
(2.5a)
subject to 1−ψ≤
PK
k=02−kx
j k P
iRij
PK
k=02−kx
j k
≤1, j∈ J (2.5b)
X
j K X
k=0
2−kxjk !
= 1, (2.5c)
xjk∈ {0,1}, j∈ J k= 1,2, . . . K (2.5d)
In (2.5), the decision variables are xjk. Constraint (2.5d) is added to specify xjk as binary,
while (2.5b) and (2.5c) are equivalent to (2.4b) and (2.4c), respectively.
In (2.5) all fractional denominators are equivalent. Consequently, we define a new variable,
yj = P 1
iRijPKk=02−kx
j k
max x,y
X
j
njψ−1 K X
k=0
2−kxjkyj !
(2.6a)
subject to X i
Rij K X
k=0
2−kxikyj !
= 1, (2.6b)
1−ψ≤
K X
k=0
2−kxjkyj ≤1 j ∈ J, (2.6c)
X
j K X
k=0
2−kxjk !
= 1, (2.6d)
xjk ∈ {0,1} j∈ J, k∈ K (2.6e)
0≥yj j∈ J (2.6f)
The decision variables in (2.6) are xjk and yj. Constraint (2.6b) delineates the value of yj.
Additionally, (2.6f) is added to ensure the yj variables are non-negative.
In three instances the binary decision variable,xjk, is multiplied with the continuous decision
variable, yj. In order to formulate the desired mixed integer program, the multiplication must
be linearized. This is achieved through specifying an upper bound for the continuous variable, yj. The upper bound is attained when the denominator is minimized. Therefore, we use the
following optimization formulation:
Z = min v
X
i
Rijvi, (2.7a)
subject to X j
vj = 1, (2.7b)
(1−ψ) X i
RijVi≤vj ≤ X
i
Rijvi j∈ J. (2.7c)
The decision variables in this minimization are the values of the eigenvector, v. Con-straint (2.7b) is the normalization of the entries in the vector. Additionally, the ConCon-straint (2.7c)
specifies the feasible region binding vj between zero and one.
Using this upper bound, we can reformulate the previous non-linear programming iteration.
max x,y,z
X
j
njψ−1 K X
k=0
2−kzkjj !
(2.8a)
subject to X i
Rij K X
k=0
2−kzjki !
= 1. j ∈ J (2.8b)
1−ψ≤
K X
k=0
zkjj ≤1, j∈ J (2.8c)
X
j K X
k=0
2−kxjk !
= 1, (2.8d)
xjk∈ {0,1} j∈ J, k∈ K (2.8e)
yj ≤0, j ∈ J (2.8f)
zikj ≥yj+uj(xki −1), j∈ J, k∈ K, i∈ I (2.8g)
zikj ≤yj, j∈ J, k∈ K, i∈ I (2.8h)
zikj ≤ujxik, j∈ J, k∈ K, i∈ I (2.8i)
Optimization model (2.8), is a mixed-integer programming formulation that minimizes the
number of vaccinations needed in a heterogeneous population while still preventing an epidemic.
There are three sets of decision variables in this model, xjk, yj, and zkji . Constraints (2.8b) through (2.8f) correspond to previous constraints. The final three constraints are added in
order to let the variablezikj linearize the relationship ofxjkyj.
2.5
Results
From this model, we evaluate scenarios and perform sensitivity analysis to determine the
mini-mum number to vaccinate. Initially, we must examine efficient values of the parameterk. After we have chosen this value for the discrete interval, we consider the effects of population increase.
Final results explore repercussions of changes in vaccine efficacy on the number of people to
vac-cinate and the distribution of these vaccines. From these results, we are motivated to consider the effects of adding fairness and equity constraints. Results are provided for these additional
considerations in terms of the increase in the number to vaccinate. The initial values are taken
from I.M. Longini and Elveback [31] and Hill and Longini [28]. The specific values used can b found in Table A.1 and Table A.2 in Appendix A.1. Appendix A.2 gives the GMPL code
used to create the LP file for these results. The model was then solved using cplex optimization
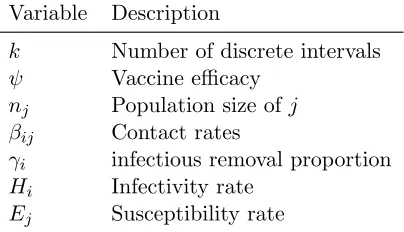
Table 2.1: Initial Values
Variable Description
k Number of discrete intervals
ψ Vaccine efficacy
nj Population size ofj
βij Contact rates
γi infectious removal proportion Hi Infectivity rate
Ej Susceptibility rate
We must determine a value for the number of discrete intervals,k, before considering
sensi-tivity to other parameters. This value must balance two conflicting objectives. As more intervals
are used, we benefit from increased accuracy; however, as k increases the program will have elevated run time. We weigh the importance of this decision by considering differing values of
kfor the initial data. Figure (2.1) illustrates the effect ofkon run time and accuracy, which is
in terms of total number to vaccinate, askincreases from three to 20.
0 50 100 150 200 250 300 350
3 4 5 6 7 8 9 10 11 12 13 14 15 16 17 18 19 20
N
um
be
r to
V
ac
ci
nate
Discrete K Values
Increasing Discrete Intervals
Time to Run (Seconds) Number to Vaccinate (People)
Figure 2.1: Parameterkevaulation
Examining the number to vaccinate in Figure 2.1, we witness a significant decrease when k is between three an five. Nonetheless, after the initial decrease this number remains around
the program to optimize remains low and relatively constant over the first nine values of k.
However, k values of ten to 17 witness a steady increase in run time. From this analysis, we can determine that the ideal k value to use would be approximately nine. As sensitivity to
other parameters is further examined in the remainder of this section,kis always chosen to be
between nine and 14 so that accurate results are given and run time remains reasonable. With a value chosen for the parameter k, we next consider changes in the size and
distri-bution of the parameter nj. The initial population distribution used to calculate k consist of
data from the 1975 census estimates. Naturally, the distribution and the size of the population change over time. As influenza pandemics occur erratically every ten to 40 years, the population
characteristics during a future epidemic are likely to be significantly different from today. In
the interest of determining influences that these changes may have on the number to vaccinate, we examine future projected population growth and age structure. This projected population
information is taken from the US Census Bureau for years 2015 to 2060 [8].
126 128 130 132 134 136 138 140 142 144 146 148 0 200 400 600 800 1000 1200 1400
2015 2020 2025 2030 2035 2040 2045 2050 2055 2060
Nu mb er to V ac cin at e Po pu la tio n Siz e Years
Number to Vaccinate: Population Increase
0 - 4 5 -19 20 - 34 35 - 64 > 65 # to Vacc
Figure 2.2: Population Increase 2015 - 2060
Figure (2.2) illustrates the influence of population increase on the number of individuals to
vaccinate. The projected increase in population size is projected to subsequent years based on the initial population of 1000 individuals with the age structure proportionate to the census
projections. The shades of the stacked columns indicate the proportion of the population
con-stituting the associated age range. Consequently, figure (2.2) shows the population aging as the shaded area corresponding to age ranges 35 to 64 as well as 65 and over are gradually increasing
the number to vaccinate to circumvent the epidemic increases approximately 9.3 percent. The
number to vaccinate does not increase equivalently with the growth of the population.
Whereas the future size and age distribution of the population can be projected by
or-ganizations such as the census bureau, vaccine efficacy is unknown until the immunization is
implemented. By evaluating different levels of vaccine efficacy, we can determine sensitivity to this uncertain element. Figure Figure 2.3 evaluates efficacies from 0.5 to 0.8.
616.59
425.95
322.6
283.18 262.34
244.86 229.57
0.00 100.00 200.00 300.00 400.00 500.00 600.00 700.00
0.5 0.55 0.6 0.65 0.7 0.75 0.8
Nu
mb
er
to
V
ac
cin
at
e
Vaccine Efficacy
Vaccine Efficacy
0 - 4 5 -19 20 - 34 35 - 64 > 65 Number to Vaccinate
Figure 2.3: Vaccine efficacy 0.5 to 0.8
There are three important results illustrated by figure (2.3). First, when vaccine efficacy is
reduced between 50 and 60 percent, there is a significant decrease in the number to vaccinate. Second, the first two age groups are always vaccinated. Finally, the fourth and the fifth age
groups are never vaccinated.
These results are best understood through analysis of the values of the parameters com-prising the matrixR. The parameter values used in these results were calculated based on the
1957 Asian influenza A pandemic [31]. Recall, the parameters used in calculatingRinclude the
relative susceptibility and infectiousness of an individual,Ej and Hj, respectively; the contract rate between individuals, βij; and the infectious removal proportion,γj. The parameter values
forEj,Hj, and γj are similar for allj. However, there are significant differences in the contact
Influence of the matrix βij is further evidenced if vaccine efficacy is decreased below 50
percent. A vaccine efficacy of 45 percent makes epidemic elimination infeasible. Withψ= 0.45, the reproduction number remains above one, R = 1.025, even if everyone in the population is
vaccinated. The individuals in groups four and five contribute minimally to the spread of the
disease so their vaccination is not important to the objective of eliminating the disease. This result leads to unbalanced distribution of vaccine resources among the heterogeneous subgroups
in the population.
Such unbalanced vaccination fractions lead to questions and concerns regarding fairness and equity in resource distribution. The objective function and constraints given in (2.8) only aim to
reduce the basic reproduction number below one by vaccinating as few individuals as possible.
With current contact rates as well as levels of susceptibility and infectiousness, at most, the first three age groups will be vaccinated. As the vaccine efficacy increases vaccinating the third age
group becomes less important. Adding equity constraints can provide a more even distribution
of resources; however, the question arises as to the cost that these constraints will impose in terms of extra resources required.
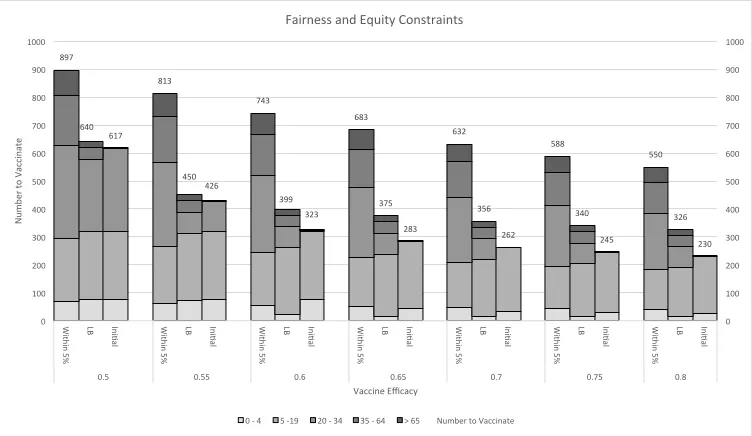
The first equity constraints considered examines the impact of a lower bound. This lower
bound states that each subgroup must have 20 percent of its individuals vaccinated. Examina-tion of results show for vaccine efficacies under 65 percent there are significant changes with
each five percent decrease in efficacy.
We compare this result with adding a constraint that specifies all fractional values must
be within five percent. Adding these constraints notably alters the number of individuals to
vaccinate. Comparisons of the number to vaccinate and the extreme difference when adding these constraints can be seen in figure (2.4). Since all fractions must be within five percent, we
must vaccinate higher percentages of groups four and five even though they don’t significantly
contribute to the reduction of the reproduction number below one. Even with a vaccine efficacy of 80 percent, over half of the population is vaccinated. This corresponds to a 70 percent
increase over adding only the lower bound constraint and a 143 percent increase over the
897
640 617
813
450 426
743
399 323
683
375 283
632
356 262
588
340 245
550
326 230
0 100 200 300 400 500 600 700 800 900 1000
0 100 200 300 400 500 600 700 800 900 1000
W ith in 5 % LB
Ini5al
W ith in 5 % LB
Ini5al
W ith in 5 % LB
Ini5al
W ith in 5 % LB
Ini5al
W ith in 5 % LB
Ini5al
W ith in 5 % LB
Ini5al
W ith in 5 % LB
Ini5al
0.5 0.55 0.6 0.65 0.7 0.75 0.8
N
um
be
r to
V
ac
ci
nate
Vaccine Efficacy Fairness and Equity Constraints
0 -‐ 4 5 -‐19 20 -‐ 34 35 -‐ 64 > 65 Number to Vaccinate
Figure 2.4: Comparison of Fairness and Equity
2.6
Conclusion
In chapter 2, we assessed the optimal distribution of vaccines in heterogeneous age distributed sub-groups in the population. We developed a model that employs the use of the surface
thresh-old characterization of all vaccine strategies that result in epidemic elimination discovered
by Hill and Longini [28]. Then, in order to minimize the number of vaccines needed, we solved the model via a mixed integer linear programming approach.
Results from this model highlights the significance of incorporating age based rates that
are characteristic of pandemic influenza. For the propagation rates used in this model, the contact rate was the parameter with significant variability based on age. Consequently, the
age groups actually vaccinated were those with the highest contact rates. Furthermore, for
certain lower proportions of vaccine efficacy, vaccinating the entire population did not reduce the basic reproduction number below one. However, a slightly increased vaccine efficacy resulted
in a vaccine distribution strategy that only included the three subgroups with the highest
contact rates. Consequently, this shows that vaccinating those age group with lower contact rates contributes minimally to the decrease of the basic reproduction number below one.
The concern with such vaccine strategies suggested by this model involves fairness and
eq-uity in vaccine distribution. We considered the addition of constraints to alleviate this concern; however, these constraints come at a cost of additional vaccines. Vaccines are added since we
addition of constraints to ensure a minimum of 20 percent of each age group was vaccinated and
the second scenario ensured all vaccination fractions were within 5 percent. Although these con-straints increased equitable distribution, as expected, they significantly increased the minimal
number to vaccinate across all vaccine efficacies. The addition of a lower bound increased the
vaccines needed, averaged over all vaccine efficacies, by approximately 21 percent. Furthermore, the addition of constraints that specify all vaccine fractions should be within five percent
dou-bled the average number of vaccines needed to control the epidemic. Therefore, public health
decision makers must weigh the cost of equitable distribution in pandemic situations.
Nevertheless, this model provides an accurate method to determine optimal vaccine fractions
while achieving the goal of pandemic elimination. It considers the age-based rates of contact,
Chapter 3
A Markov Decision Process for
Vaccine Distribution
3.1
Introduction
Public health decisions regarding the implementation of vaccines to combat an influenza
pan-demic are made under a shroud of uncertainty. In part, this uncertainty is caused by the erratic nature of an influenza outbreak, as evidenced by a statement from the CDC, which provides that
“shifts causing new strains occur at irregular intervals every ten to 40 years [13].” Consequently,
public health officials and decision makers must remain prepared to mobilize at any given time to mitigate the spread of disease through an unsuspecting population in a cost effective manner.
In addition, fluctuating dynamics of an influenza outbreak elevate the levels of uncertainty
faced by public health officials. The influenza dynamics involve the rate at which the disease propagates. The key aspect being an unknown number of susceptible individuals will become
infected in a given interval of time. As a corollary, this same aspect of influenza dynamics applies
to the recovery process for infected individuals. Given a certain stage of disease progression, there are multiple states in which the disease could transition during any given interval of time.
Thus, the dynamics make the selection of optimal actions difficult.
A third significant cause of uncertainty in combating influenza propagation manifests itself in the varied outcomes of using control strategies such as social distancing and isolation of cases.
Based on information from the CDC, vaccination is the primary and preferred control strategy used to prevent influenza spread [9]. Therefore, vaccination remains the exclusive intervention
strategy considered in this study. However, even vaccination as the optimal intervention strategy
contains uncertainty due to the influence of vaccine efficacy, which can only be observed in hindsight. Accordingly, this study incorporates the consideration of uncertain vaccine efficacy
Moreover, in this environment of uncertainty, policy and decision makers must also balance
certain objectives to achieve the optimal intervention policy regarding vaccination. These con-flicting objectives are disease elimination and minimization of costs. Compounding the
consider-ation of these objectives is the fact that influenza, if left uninhibited, will spread throughout the
entire population. Consequently, this causes infection related costs, such as diagnosis and treat-ment, to spiral out of control. In addition, infected individuals suffer health related consequences
measured in quality adjusted life years. Thus, the key components to the implementation of
a vaccination policy must consider both infection based expenditures and those expenditures which directly flow from the vaccines themselves. An intervention policy that omits from
con-sideration vaccine costs can only lead to a policy that would require immunizing all susceptibles
and thus eliminating all infection related expenses. This is clearly not a cost effective analytical solution to a pandemic. Therefore, a well-balanced implementation strategy must minimize all
costs related to the combination of infection and treatment during a pandemic.
Accordingly, with the aforementioned costs and uncertainties taken into consideration, a method is needed to develop strategies of intervention that prepare for an uncertain but eminent
pandemic. The optimal method will model the behavior of the disease, including consideration
of prior uncertainties, with the ability for behavior of the disease to be influenced through selection of courses of action. Ideally, the method will have the ability to incorporate updated
pandemic dynamics to select the actions that manage behavior of the pandemic in an optimal way. Through development of this method, policy and decision makers will be prepared to select
an optimal course of action to allow for rapid response when a pandemic suddenly emerges.
To this end, we consider a Markov Decision Process (MDP) model which describes the natural behavior of the disease and allows for optimal intervantions to be identified based on the current
degrees of disease progression in the population.
In section 3.2, we review literature pertaining to Markov Chains and MDP, which allow for characterization of a portion of this uncertainty. The next section, 3.3, provides a review of
the important mathematical concepts that pertain to this chapter. In this section, we use the
MDP formulated in R. Yaesoubi [45], except in regards to the actions. We let the actions be the percentage of susceptibles that should be vaccinated at each decision epoch. Additionally, in
section 3.5, we use this MDP to implement a linear programming solutions approach and further
consider uncertainty by formulating a stochastic programming model with vaccine efficacy as the uncertain variable. In section 3.5, we provide results of the optimization. Finally, in 3.6 we
3.2
Literature Review
Markov processes have been influential in analyzing the stochastic behavior of a variety of
sys-tems including infectious disease propagation and control. Although these models have diverse features and immense applicability, they all contain the Markov property. The Markov
prop-erty declares that future states of the system are dependent only on the present state. Further,
the progression of past states to arrive at the present has no bearing on the probability of transitioning to future states. Analysis of the probability of transitioning states is performed
on a discrete or continuous time scale with the modeling of infectious diseases being
consid-ered in both arenas. Next, we present some models that have considconsid-ered Markov chains in the application of infectious diseases.
R.Yaesoubi [46] studies discrete time Markov chains and is highly relevant to the research conducted in this chapter. This work formulates a group of infectious disease models that have
the ability to select optimal dynamic health policies. Furthermore, they address two problems
that prevent the use of dynamic optimization techniques, namely, prohibitively large state spaces and unobservable states. To overcome the problem of large states spaces, they propose
an aggregation method using a grid to group states together based on similar proportions of
event classes. The predicament of unobservable states is alleviated through maximum likelihood estimates that have the ability to be updated over the course of the epidemic. Finally, they
illustrate the susceptible-infectious-recovered (SIR) Markov chain with an example of influenza
moving through an English boarding school. The critical focus of this work is the capability of the infectious disease model to select health policies using dynamic optimization techniques.
Using dynamic optimization techniques in selection of optimal dynamic health policies is a
motivation for this work. Specifically, we are interested in developing a MDP. Problems modeled by an MDP involve an agent or decision maker challenged with manipulating the performance
of an evolving and probabilistic system through selection of optimal actions or decisions [44].
According to I.C. White [30], MDPs are indispensable in characterizing problems which contain the following characteristics: (1) uncertainty in the environment, (2) multiple or conflicting
objectives and (3) decisions with future impact. Additionally, MDPs are beneficial in problems
where the intent is to optimize a system or situation [30].
These problem characteristics are readily identified in the discussion of pandemic influenza in
section 3.1 and lead to development of an MDP to consider decision making in this environment.
Explicitly, the characteristics of influenza that naturally lend themselves to use of an MDP include: ambiguity in the number of individuals infected and recovered, conflicting disease
and intervention costs, and influence of decisions on future propagation of the disease and expenditures. Furthermore, optimization is imperative as we are interested in finding the course
These considerations were prevalent in the work of R. Yaesoubi [45], which examines
dy-namic health policies to make real time recommendations on public health intervention strate-gies through the use of a Markov Decision Process (MDP). Furthermore, the MDP shows how
dynamic policies allow for updated decisions in regards to changing disease dynamics,
pop-ulation characteristics and resource constraints. This method associates a reward with each possible action to determine the optimal policy at each possible state of disease progression. An
influenza pandemic is considered as an example to portray the dynamic optimization techniques
described.
This study will advance the work of R. Yaesoubi [45] in the example of pandemic influenza.
Initially, we utilize the MDP formulated by R. Yaesoubi [45] which is based on a SIR
com-partmental model; however, we change the actions and consider the percentage of susceptibles to vaccinate in each state. The MDP formulation provides for an efficient linear programming
solutions approach to find the optimal intervention strategy. From this linear program, we
intro-duce uncertainty in regards to vaccine effectiveness by creating a two stage stochastic program. Optimal policies are then developed with this additional ambiguity realized to strengthen the
dynamic policies. Results are studied for the case of the English boarding school presented
in [41] and considered in [45] and [16].
3.3
Previous Mathematical Contributions
Public health policy and decision makers face numerous challenging decisions when employing an optimal number of vaccines to control disease spread in a cost effective manner. In order
to inform this difficult situation, we use an MDP. To that end, we need to define several
components to adequately characterize the MDP including: decision epochs, states, actions, transition probabilities, and rewards [44]. The work of R. Yaesoubi [45] forms the basis for this
section. We model the decision epochs, states, transition probabilities, and rewards in the same
manner as [45]; however, we are looking to determine the optimal percentage of susceptibles to vaccinate in each state as our action. In this section, we will discuss each component in the
order presented above and determine its formulation for the problem of cost effective vaccine
distribution in pandemic influenza as given by R. Yaesoubi [45].
3.3.1 Decision Epochs
Initially, we must determine when policy and decision makers are able to influence the natural
behavior of the system through action selection. In an MDP, these actions are selected at points of time known as decision epochs. Furthermore, decision epochs are classified as either