NON LINEAR MODELING OF A TORSION SENSITIVE BUILDING
UNDER NEAR-FIELD AND FAR
Thi-Liên Do1, Sebastien Fayolle
1
Engineer – EDF Nuclear Engineering Division, Lyon, France 2
Research Engineer – EDF R&D AMA, Clamart, France 3
Expert – EDF Nuclear Engineering Division, Paris, France 4
Engineer – EDF DPIH, Civil Work Department, Savoie, France
ABSTRACT
The peak ground acceleration (PGA)
damaging potential, may be misleading when comparing near 2011). On the basis of transient non linear analyses carr
building, the purpose of this paper is to illustrate the
motion considered in the design process of NPP buildings, the damaging potential of input motions with the same PGA is
INTRODUCTION
For a given PGA, near-field seismic input motions are deemed to be less damaging than far inputs, as discussed by the IAEA (IAEA 2011). In the spirit of this IAEA publication, the
present paper is to discuss the relative damaging capac
comparison to the implicit damaging capacity of conventional seismic input motions such as considered in the design process of NPP buildings.
With this objective the case of an existing French NPP building is co design criteria for a conventional, far
conventional beyond design earthquake analysis is carried out with means a 50% increase). In a second step, a realistic near
0.18 g PGA, and then this near field input is also increased by 50%
For the sake of comparison of damaging capacities of these respective input motion
linear behavior of the building is represented, which implies that all the outputs presented here were obtained from time history analyses.
DESCRIPTION OF THE STUDY
Building modeling
The global size of the studied structure
height. The building is made up of six floors and its foundations are at a depth of 3.7m. made of reinforced concrete elements and masonry.
Using elements of 0.5m size, a plate and beam mo
nodes is 36841 and the number of degree of freedom is 201966. The mass of the model is 4134.75 tons.
NON LINEAR MODELING OF A TORSION SENSITIVE BUILDING
FIELD AND FAR-FIELD SEISMIC INPUT MOTIONS
Sebastien Fayolle2, Ilie Petre-Lazar3, Nicolas Humbert4, and Pierre Labbé
EDF Nuclear Engineering Division, Lyon, France EDF R&D AMA, Clamart, France EDF Nuclear Engineering Division, Paris, France
EDF DPIH, Civil Work Department, Savoie, France
peak ground acceleration (PGA), commonly used as an indicator of seismic input motion may be misleading when comparing near-field and far-field
On the basis of transient non linear analyses carried out on an existing French Nuclear Power Plant purpose of this paper is to illustrate the fact that, as compared to typical far
motion considered in the design process of NPP buildings, the damaging potential of with the same PGA is generally much lower.
field seismic input motions are deemed to be less damaging than far inputs, as discussed by the IAEA (IAEA 2011). In the spirit of this IAEA publication, the
paper is to discuss the relative damaging capacity of realistic near
comparison to the implicit damaging capacity of conventional seismic input motions such as considered in the design process of NPP buildings.
With this objective the case of an existing French NPP building is considered, which fulfils the design criteria for a conventional, far-field type, input anchored at a 0.126 g PGA. In a first step a conventional beyond design earthquake analysis is carried out with a similar input anchored at 0.18
In a second step, a realistic near-field input motion is selected, with the same g PGA, and then this near field input is also increased by 50%, up to a 0.27 g PGA
For the sake of comparison of damaging capacities of these respective input motion
linear behavior of the building is represented, which implies that all the outputs presented here were obtained from time history analyses.
DESCRIPTION OF THE STUDY
studied structure is approximately 12.4 m width, 30 m length and 25 m height. The building is made up of six floors and its foundations are at a depth of 3.7m.
made of reinforced concrete elements and masonry.
Using elements of 0.5m size, a plate and beam model is generated (Figure
nodes is 36841 and the number of degree of freedom is 201966. The mass of the model is 4134.75 tons.
NON LINEAR MODELING OF A TORSION SENSITIVE BUILDING
SEISMIC INPUT MOTIONS
and Pierre Labbé3
, commonly used as an indicator of seismic input motion field input motions (IAEA, ied out on an existing French Nuclear Power Plant , as compared to typical far-field input motion considered in the design process of NPP buildings, the damaging potential of realistic near-field
field seismic input motions are deemed to be less damaging than far-field inputs, as discussed by the IAEA (IAEA 2011). In the spirit of this IAEA publication, the purpose of the ity of realistic near-field input motion in comparison to the implicit damaging capacity of conventional seismic input motions such as considered
nsidered, which fulfils the field type, input anchored at a 0.126 g PGA. In a first step a input anchored at 0.18 g (it field input motion is selected, with the same
g PGA.
For the sake of comparison of damaging capacities of these respective input motions, the non-linear behavior of the building is represented, which implies that all the outputs presented here were
is approximately 12.4 m width, 30 m length and 25 m height. The building is made up of six floors and its foundations are at a depth of 3.7m. The building is
Figure 1. Different views of the mesh of the building.
The nonlinear behavior of walls and slabs is taken into account through a macroscopic damaging constitutive model developed for reinforced concrete plate elements. This model has been developed according to the theory of generalized standard materials and named GLRC_DM (Markovic et Al, 2007). In this model, it is assumed that the R-bars play such a role that softening steps due to concrete degradation are avoided, which is leading to computing efficiency and robustness. A drawback of this constitutive model is that the behavior is assumed to be isotropic which implies that the same quantity of rebar should be used in all directions. To overcome this limitation, we add some grid elements in the model to obtain an anisotropic behavior. These grid elements have an elastoplastic behavior with linear kinematic hardening. The number of plate elements is 31716 and the number of grid elements is 72307.
Those masonries walls that are regarded as not participating in the rigidity of the structure are modeled by additional masses on the slabs. Masonry walls with significant stiffness are represented by two linear elastic truss elements arranged in diagonal.
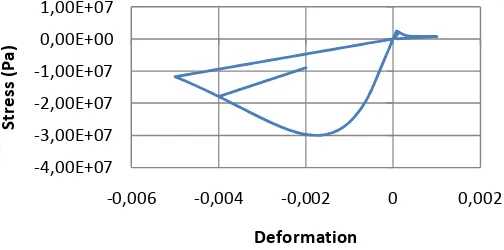
Reinforced concrete columns and beams are modeled with multifiber beams following Euler-Bernoulli hypothesis (Kotronis et Al, 2005).The multifiber beam approach requires the definition of the sections of the beam through a mesh representing the different fibers of steel and concrete. Our model contains 235 different sections. Constitutive law used for concrete fibers is based on the principles of damage mechanics. We use a modified one-dimensional Mazars model (Mazars, 1986) which is able to take into account cyclic loadings and crack closure effect. The stress–strain response curve predicted by this model is given in Figure 2. To reproduce the behavior of reinforcement bars, we choose a classical plasticity model accounting for the linear kinematic hardening.
Figure 2. Concrete fiber behavior law. -4,00E+07
-3,00E+07 -2,00E+07 -1,00E+07 0,00E+00 1,00E+07
-0,006 -0,004 -0,002 0 0,002
S
tr
e
ss
(
Pa
)
Deformation
Soil modeling
The building is based on strip foundation to a depth of -3.7 m in sandy and gravelly alluvia. The thickness of the alluvial deposit ranges from 150 m to 200 m. The cross-hole sounding shows shear wave velocity values between 538 m/s and 682 m/s, indicating a homogenous soil behavior. In this study, the soil is considered homogeneous with an equivalent dynamic modulus of deformation of 2000 MPa and a Poisson coefficient of 0.475.
Soil structure interaction is performed by the use of soil springs distributed among the nodes of the foundation. Soil spring calibration is derived from impedance functions calculated according to the methodology developed by Nieto Ferro et al. (2013), based on the coupling of two software packages, Code_Aster® and MISS3D.
Damping
Damping is modeled using a modal damping (Craig Jr et Al, 2006). The damping coefficient calculation is performed by the post-treatment of a modal analysis of the structure on springs. A conservative damping of 2% is defined for the structural elements having a non-linear dissipative behavior. A 7% damping is considered for masonry walls represented by truss elements. The modal damping combines damping of sub-structures of the building, internal damping of soil and radial damping in accordance with French design rules. The values associated to the first three modes amounts to 3.7%.
Modal analysis
The building is subjected to torsion due to its limited bracing at the north side, in opposition to the south side with a shear wall from the bottom to the top. As shown in
Figure 3 the first three mode shapes of the building amounts to 1.35 Hz, 3.40 Hz and 4.41 Hz, which involve respectively 43% (X direction), 55% (Y direction) and 22% (X direction) of the total mass.
Seismic input motion
Two types of input motion are considered. The first one is a conventional far-field beyond design input motion, denoted SL. It consists of a series of five artificial accelerograms, generated from a response spectrum representative of a magnitude 7.2 event at a distance of 34 km. According to the current practice in France (RFS 2001) the corresponding PGA is 0.18 g.
The second one, denoted SP1, is natural signal of the l’Aquila 2009 event. Its characteristics (RESORCE) are shown in the Table 1. It is a typical near-field earthquake according to the IAEA definition: “Short duration, relatively high frequency content input motions generated by low–medium magnitude earthquakes, particularly in low-seismicity areas” (IAEA 2011). Its PGA in the W-E direction is also 0.18 g. For sensitivity studies, this input motion has been scaled up by a factor of 1.5. This new input is denoted SP2.
Response spectra of SL, SP1 andSP2 are presented in the Figure 4.
Table 1: Characteristics of near-field earthquake motion SP1.
Magnitude 4.7
Epicentral distance (km) 3.9
Direction North - South Up - Down West - East
Amax (m/s²) 0.96 0.51 1.84
Vmax (m/s) 0.029 0.008 0.034
Dmax (m) 0.003 0.003 0.004
A/V (s-1) 32.8 61.7 53.9
Strong phase duration (s) 3.6 3.8 2.6
CAV (m/s) 1.059 0.577 1.409
SEISMIC RESPONSE
Transient non linear calculations were performed with Code_Aster®. Regarding the far-field input, SL, five combinations of accelerograms were considered. For the purpose of comparison of damaging capacities, the mean of the five outputs was calculated. For the purpose of identifying margins encompassed in the current French regulatory practice (ASN 2006) the mean value ± 95% of the standard deviation was also calculated. Regarding the near-field inputs, SP1 and SP2, horizontal signals have been permuted so as to consider the most demanding combination. Corresponding results are summed up in the Table 2.
As shown in the Figure 5, the columns and the beams located at the north side exhibit a non linear response with the formation of plastic hinges under SL input. On the contrary, as presented in the Figure 6, damages under SP1 and even under SP2 are scarce.
Figure 5. Views of damage of the building under SL.
Figure 6. Damage of the building under SP1 (left) and SP2 (right).
Another indicator is also considered to characterize structural damage: the frequency drop. Regarding the first three eigenfrequencies of the considered building, the frequency drop is limited to 1.5 % under SP1. This value reaches 2.03% under SP2. In absolute values, the difference amounts to 0.02 Hz. This is negligible and indicates that no actual damage has occurred in the building. Under far-field input motion SL the frequency drop amounts to 24%. In this regard, it is interesting to point out the influence of modeling columns with non-linear multifiber beams, while the use of linear beams would have resulted in a limited frequency drop of only 5.1%. The relative frequency drop can also be estimated on the basis of the frequency content of the building response. Considering for instance the top floor response, an indicator of its central frequency can be derived from the computed response as follows:
π
= /2
nt displaceme relative top imum max on accelerati absolute top imum max fˆ 2 / 1 (1)
Outputs of this calculation, presented in the Table 2, confirm that the structure undergoes a much more significant non-linear response under the SL input than it does under either SP1 or SP2.
Table 2: Summary of results.
SL (mean ± 95% σ) SP1 SP2
PGA (g) 0.18 0.18 0.27
Maximum top displacement
(m) in x direction 0.076 ± 0.013 0.007 0.011
Drift in x direction (mm/m) 8.28 ± 1.61 0.91 1.37
fˆ(Equation 1) (Hz) 1.98 ± 0.49 2,84 2,82
CONCLUSION
This paper has presented the results of transient non linear calculations performed on a torsion sensitive building under various seismic input motions. The outputs illustrate the general conclusion already established by the IAEA (2011) that, for a given PGA, a near-field input motion is generally much less damaging than a far-field input. In the case under consideration here, for a 0.18 g PGA the near-field input is approximately 10 times less damaging than the conventional, far-field type, input such as used in the design process of nuclear facilities. The near-field input scaled at 0.27 g is still significantly less damaging than the far-field type input scaled at 0.18 g.
REFERENCES
D. Markovic, P. Koechlin, F. Voldoire (2007). Reinforced concrete structures under extreme loading: Stress resultant Global Reinforced Concrete Models (GLRC), COMPDYN 2007, CMSDEE,
Paper 1319, 2007.
A. Nieto Ferro, N. Greffet, G. Devésa, D. Clouteau (2013). Accounting for non linear dynamic soil-structure interaction in earthquake engineering, COMPDYN 2013, Greece, 12-14.
Craig Jr, R. R., Kurdila, A. J. (2006). Fundamentals of Structural Dynamics, 2th ed., John Wiley & Sons.
Mazars, J (1986). “A description of micro- and macroscale damage of concrete structures” J. Engrg. Fracture Mech., 25(5/6), 729-737.
IAEA (2011) “ Non linear response to a type of seismic input motion ”, International Atomic Energy Agency TECDOC 1655, Wien
Code_Aster® , “Reference documentation”, www.code-aster.org
ASCE (2005) ASCE/SEI 43-05 – American Society of Civil Engineers – Seismic design Criteria for Structures, Systems and Components in Nuclear Facilities
RFS (2001) “Basic safety rule - Fundamental safety rule n°2001-01 concerning basic nuclear installations”, French Safety Authority, www.french-nuclear-safety.fr
RESORCE “Reference database for Seismic ground motion pRediCtion in Europe”, www.resorce-portal.eu