DOI: 10.1534/genetics.107.077644
Note
An Exact Sampling Formula for the Wright–Fisher Model and
a Solution to a Conjecture About the Finite-Island Model
Sabin Lessard
1De´partement de Mathe´matiques et de Statistique, Universite´ de Montre´al, Montre´al, Que´bec H3C 3J7, Canada
Manuscript received June 14, 2007 Accepted for publication July 26, 2007
ABSTRACT
An exact sampling formula for a Wright–Fisher population of fixed sizeN under the infinitely many neutral alleles model is deduced. This extends the Ewens formula for the configuration of a random sample to the case where the sample is drawn from a population of small size, that is, without the usual large-Nand small-mutation-rate assumption. The formula is used to prove a conjecture ascertaining the validity of a diffusion approximation for the frequency of a mutant-type allele under weak selection in segregation with a wild-type allele in the limit finite-island model, namely, a population that is subdivided into a finite number of demes of sizeN and that receives an expected fraction mof migrants from a common migrant pool each generation, as the number of demes goes to infinity. This is done by applying the formula to the migrant ancestors of a single deme and sampling their types at random. The proof of the conjecture confirms an analogy between the island model and a random-mating population, but with a different timescale that has implications for estimation procedures.
W
AKELEY (2003) has provided a theoretical framework for statistical inference about muta-tion, selecmuta-tion, and divergence time made from molec-ular data at unlinked nucleotide sites as in Sawyerand Hartl (1992) but in the case of a population subdi-vided into many subpopulations or demes. Assuming an island model of migration (Wright 1931; Moran 1959) but with a finite number of finite demes, it has been argued that the frequency of a mutant allele seg-regating with a wild-type allele at the same locus in the whole population should be governed in the limit of a large number of demes by a diffusion process that is identical to the standard diffusion approximation used for a panmictic population (see,e.g., Ewens2004, Chap. 4), with the exception that it occurs on a longer timescale. More precisely, consider a haploid population sub-divided intoDdemes withNindividuals in each deme and suppose discrete, nonoverlapping generations. At the beginning of each generation, every individual in every deme produces the same large number of off-spring, which then disperse independently and ran-domly among all the demes with probabilitym(0,m#1) or stay in their original deme with probability 1m.
In other words, mis the fraction of offspring in each deme that come from a deme chosen at random. Two alleles at a single locus are segregating in the popula-tion, a mutant allele A and a wild-type allele B, and viability selection takes place among the offspring within each deme (what is known as soft selection) such that the mutant type has fitness 11g/(ND) compared to 1 for the wild type. The population structure is re-stored before the beginning of the next generation by samplingNsurvivors within each deme according to a classical Wright–Fisher model (Fisher 1930; Wright 1931). The frequency of A in all the demes is then described by a multidimensional discrete-time Markov chain. The same chain is obtained in the case of a diploid population with gametic migration followed by random union of gametes and additive selection.
Measuring time in units ofND/(1F) generations, whereFis the fixation index given by
F ¼ ð1mÞ
2
Nmð2mÞ1ð1mÞ2; ð1Þ
it has been shown that the frequency ofAin the whole population in the limit asDgoes to infinity should be described by a diffusion continuous-time process on the interval ½0, 1 having drift and diffusion coefficients given by
aðxÞ ¼gxð1xÞ ð2Þ
1Address for correspondence: De´partement de Mathe´matiques et de
Statistique, Universite´ de Montre´al, C.P. 6128, Succursale Centre-ville, Montre´al, Que´bec H3C 3J7, Canada.
E-mail: [email protected]
and
bðxÞ ¼xð1xÞ; ð3Þ
respectively. This is exactly what is obtained for a panmictic population of sizeND withND generations taken as unit of time (see,e.g., Ewens2004, Chap. 5). Therefore, in the limit of a largeD, the only difference between the two models is the timescale, the unit of time in the island model being longer by a factor 1/(1F). Note that the parameter F represents the probability under neutrality and assuming a large number of demes that the lineages of two individuals chosen at random in the same deme coalesce backward in time before one of them migrates to another deme.
The limit diffusion for the island model results from a separation of timescales as in Ethier and Nagylaki (1980), drift within demes occurring on a faster time-scale than drift between demes and selection pressure. Moreover, a rigorous proof relies on the following assumption:
Conjecture(Wakeley2003):Ifn¼(n0,n1,. . .,nN)
is the probability distribution satisfying
nj¼X
N
i¼0
niPij*; ð4Þ
where
Pij*¼ N
j ð1mÞ
i
N1mx
j
ð1mÞNi
N 1mð1xÞ
Nj
ð5Þ
and x represents the frequency of A in the current generation, then there exist some coefficients r1,. . ., rNsuch that from one
generation to the next
nj9¼nj1
XN
i¼1
riðx9xÞi: ð6Þ
Moreover, these coefficients may depend on N, j, m, and x.
It has been noted that the conjecture is true whenn
is approximated with a hypergeometric distribution
n˜¼ ðn˜0;n˜1;. . .;n˜NÞexhibiting the same mean and var-iance; namely,
n˜j ¼
j1Mx1
j
N j1Mð1xÞ 1
N j
N 1M1
N
; ð7Þ
where
M ¼1F
F ¼
Nmð2mÞ
ð1mÞ2 ð8Þ
and
k1a1
k
¼Gða1kÞ
k!GðaÞ ; ð9Þ
withG(a11)¼aG(a) fora.0 (see,e.g., Feller1968, p. 66, for properties of the gamma function). Such an approximation can be justified by exchangeability properties (Rothmanet al.1974). The accuracy of the approximation has been illustrated by numerical calcu-lations for a deme of size as small as 10 (see Wakeley 2003 for more details). Moreover, numerical simulations in the case of a large deme size have shown little dis-crepancy with the stochastic dynamics predicted from the diffusion approximation (Cherry and Wakeley 2003). This is consistent with analytical results for a large deme size withNmkept constant, in which case bothNn
and Nn˜ approach the density of a beta distribution evaluated aty¼j/N; namely,
nðyÞ ¼ GðMÞ
GðMxÞGðMð1xÞÞy
Mx1ð1yÞMð1xÞ1; ð10Þ
whereMtakes its limit value 2Nm(see,e.g., Moran1962, Chap. 6). This distribution corresponds to the station-ary distribution in a deme of large size that receives an expected fractionmof migrants each generation from an infinite population, possibly subdivided into an infinite number of demes, in which the frequencies of
A and B are kept constant and equal tox and 1 x, respectively (Wright1931).
On the other hand, the hypergeometric distribution
n˜, where
M ¼ Nm
1m; ð11Þ
is the solution of the system of equations
n˜j ¼
XN
i¼0
n˜iP˜ij*; ð12Þ
where
˜ Pi*;i11 ¼
N i
N ð1mÞ
i
N 1mx
; ð13Þ
˜ Pi*;i1¼
i
N ð1mÞ
N i
N 1mð1xÞ
; ð14Þ
˜
Pi*;i ¼1P˜i*;i11P˜i*;i1; ð15Þ
This is also the distribution of allele types in an island population of size N generated by a birth-and-death process with immigration (BDI) from a large mainland population in which the frequencies of allelesAandB
arexand 1x, respectively, ifMis defined as the ratio of the immigration rate over the individual birth rate (Rannala1996).
In the case of infinitely many alleles in the mainland population of a BDI process ( Joyceand Tavare´1987; Tavare´ 1989), the distribution of allele types in an island or a subpopulation is related to the Ewens sam-pling formula. This formula gives the likelihood of the configuration of alleles at a single locus in a small sample drawn at random from a large population as-suming that every mutation leads to a novel type. It was conjectured by Ewens (1972) from the stationary fre-quency spectrum based on a diffusion approximation and proved formally by induction by Karlin and McGregor (1972). The formula holds in the limit of a wide range of exchangeable models, including the Wright–Fisher model and the Moran model, and is a basic tool for estimating the mutation rate and testing neutrality (see, e.g., Ewens 1990). An analogy with a Polya urn model has been pointed out (Hoppe1984, 1987). The formula has been proved by a simple com-binatorial argument (Griffiths and Lessard 2005) based on the coalescent approach as the population size goes to infinity (Kingman1982).
The Ewens sampling formula or any related asymp-totic formula cannot be used, however, to get the dis-tributionnsince the deme size is fixed and finite. What is needed is an exact formula for the neutral Wright– Fisher model. More precisely, the distributionnthat is to be determined corresponds to the stationary distribu-tion in a Wright–Fisher populadistribu-tion of fixed sizeNthat receives an expected fractionmof migrants each gen-eration from an infinite population in which the fre-quencies ofAandBare kept constant and equal toxand 1 x, respectively. Equivalently, this is the stationary distribution in a Wright–Fisher population in which mutation occurs with probabilitymper gene per gen-eration and leads either to an alleleAwith probability
xor to an alleleBwith probability 1x.
In this note, the stationary distributionnis obtained from an exact sampling formula for the Wright–Fisher model under infinitely many alleles mutation that is deduced in the next section (see Fu2006 for a study of the exact coalescent in this model without mutation). The proof of the conjecture and some concluding remarks follow.
EXACT SAMPLING FORMULA FOR THE NEUTRAL WRIGHT–FISHER INFINITELY MANY
ALLELES MODEL
We consider the neutral Wright–Fisher model for a population ofN genes at a single locus with discrete,
nonoverlapping generations and a probability of muta-tion to a novel allelic typeuper gene per generation. We are interested in the probability of having k different types, labeled arbitrarily from 1 to k and represented
n1,. . .,nktimes, respectively, in a sample ofn¼Pini
genes drawn at random without replacement in a given generation (say, generationg0). The sample size satisfies
1#n#N.
Let us assign the labeled types to the sampled genes. There are
n! Qk
i¼1ni!
ð16Þ
possibilities. The probability of the sample configura-tion is obtained by reconstructing the history of the sample genes.
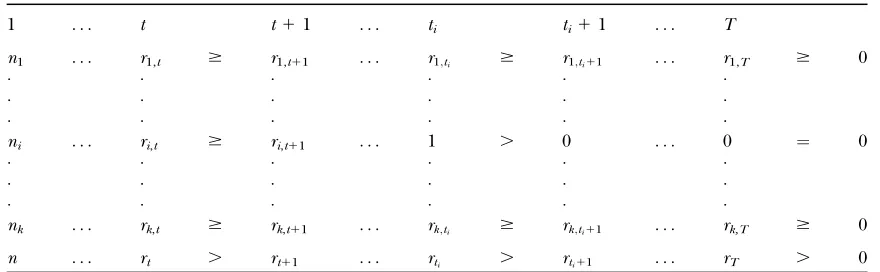
Backward in time, the sampled genes are lost by mu-tation or coalescence. We consider first only the genera-tions with such mutation or coalescence events that define ordered steps of gene loss backward in time. Let steptcorrespond to generationgtfort¼1,. . .,T, where
Trepresents the total number of steps. We introduce the notation ri,t for the number of genes of typei
re-maining at the beginning of step t. This number de-creases fromnito 1 astincreases from 1 toti, this step
corresponding to the loss of typeiby mutation, so that
ri;ti ¼1 and ri,t ¼ 0 for all t . ti. Moreover, define
rt¼Piri;t, the total number of genes remaining at the
beginning of step t, and mt, the number of mutation
events occurring at stept, that is, the number ofisuch thatti¼t. (See Table 1.)
Then, assuming that the parent of each gene in any given generation is a gene chosen at random in the previous generation independently of all others, stept
as defined from the numbers of genes of each type remaining at the beginning of stepstandt11, that is,
ri,t11for alligivenri,tfor alliwith 0#ri,t11#ri,tfor alli
following at least one, and possibly multiple, mutation or coalescence events (see Figure 1 for an example), has probability
umtð1uÞrtmt N ½rt11
Nrtmt
Yk
i¼1
Sri;tri;t11
" #
; ð17Þ
where N½r ¼N(N 1) . . . (N r 1 1), while S
rs
re-presents the number of ways thatrdistinct elements can be partitioned intosnonvoid subsets. This is a Stirling number of the second kind given by the formula
Srs¼1
s! X
j1;. . .;js$1 j11. . .1js¼r
r j1;. . .;js
ð18Þ
(see,e.g., Abramowitzand Stegun1965). Note that, in Equation 17, we use the equalities N½0 ¼1 and
Considering all steps of gene loss from 1 to T ¼ max{t1,. . .,tk} and using the identityk¼
P
tmt, we get
the probability
uN
1u
kYT
t¼1
ð1uÞrtN½rt11 Nrt
Yk
i¼1
Sri;tri;t11
" #
: ð19Þ
On the other hand, the probability of neither mutation nor coalescence in all intermediate generations sepa-rating the generations of gene loss is
YT
t¼1
X‘
gtgt1¼1
ð1uÞrtN
½rt
Nrt
gtgt11
; ð20Þ
which reduces to
YT
t¼1
1 ð1uÞrtN ½rt
Nrt
1
: ð21Þ
Multiplying (16) with (19) and (21) and dividing byk!, which is the number of ways that the mutant types can be labeled, the probability of the sample configuration for the labeled types, denoted byp(n;n1,. . .,nk), is found to
be
n!
k!Qk i¼1ni!
uN
1u
kX
ðri;tÞ
YT
t¼1
ð1uÞrtN½rt11Qk
i¼1Sri;tri;t11 Nrt ð1uÞrtN½rt
" #
;
ð22Þ
whereðri;tÞis an array of nonnegative integers satisfying
ri,t$ri,t11fori ¼1,. . .,kandt$1 with ri,1¼niand
ri;ti ¼1.ri;ti11¼0 for some ti for all i and
rt ¼
P
iri;t.
P
iri;t11 ¼rt11 as long as rt $ 1, which
occurs fort¼1,. . .,T.
PROOF OF THE CONJECTURE
Suppose a neutral Wright–Fisher model for a pop-ulation ofNgenes at a single locus without mutation but in which each gene in each generation, with probability
mand independently of all others, comes from a large surrounding population where two allelesA andBare segregating and maintained at equilibrium frequencies
xand 1x, respectively. In the population of sizeN, it is as if a mutation event to a novel type would occur with probabilityu¼mper gene per generation and that the novel type would be either in classAwith probabilityx
or in classBwith the complementary probability 1x. In the Wright–Fisher population at stationarity, the number of genes in classAcan be expressed as
NA¼N1I11 . . .1NKIK; ð23Þ
whereKis the number of types in the population,N1,. . ., NK are the numbers of times that these types once
labeled from 1 toKare represented in the population, and I1,. . .,IK are independent random variables that
take the value 1 with probabilityxand 0 otherwise. Given thatK ¼k, the numbers N1,. . ., Nk are exchangeable
random variables and the sum I11 . . .1 Ik follows a
binomial distribution with parameterskandx. There-fore, the probability of havingjgenes in classAin the Wright–Fisher population at stationarity is
TABLE 1
Notation and inequalities for the numbers of genes of the different types (i¼1, … ,k) at the beginning of the successive steps of gene loss (t¼1, … ,T)
1 . . . t t11 . . . ti ti11 . . . T
n1 . . . r1,t $ r1,t11 . . . r1;ti $ r1;ti11 . . . r1,T $ 0
ni . . . ri,t $ ri,t11 . . . 1 . 0 . . . 0 ¼ 0
nk . . . rk,t $ rk,t11 . . . rk;ti $ rk;ti11 . . . rk,T $ 0
n . . . rt . rt11 . . . rti . rti11 . . . rT . 0
The number of mutations at stept, represented bymt, is the number of typesisuch thatri,t¼1 andri,t11¼0 and satisfiesPtmt¼k.
nj¼
XN
k¼1
Xk
l¼0
k
l x
lð1xÞklPðN
11 . . . 1Nl¼j;K¼kÞ; ð24Þ
where, using the sampling formula of the previous section for the whole population (n¼N), we have
PðN11 . . .1Nl¼j;K¼kÞ ¼
X
n1;. . .;nk$1
n11. . .1nl¼j
pðN;n1;. . .;nkÞ: ð25Þ
We conclude that
nj¼X
N
l¼0
alxl; ð26Þ
where the coefficients a0, a1,. . ., aN depend on m, j,
andN. Let us write
n9j ¼
XN
l¼0
alðx9x1xÞl ð27Þ
for the probability of having jgenes in class A in the Wright–Fisher population at stationarity when the fre-quency of A in the surrounding population is x9 dif-ferent fromx. Then, the binomial formula
ðx9x1xÞl¼X
l
i¼0
l
i x
liðx9xÞi ð28Þ
and a rearrangement of terms yield the expression
n9j ¼nj1
XN
i¼1
riðx9xÞi; ð29Þ
where
ri¼X
N
l¼i l i alx
li: ð30Þ
This coefficient fori¼1,. . .,Ndepends onN,j,m, and
xand the stated conjecture is established.
CONCLUDING REMARKS
The proof of the conjecture relies on the fact that the probability of having a given number of genes in classA
in a haploid Wright–Fisher population of sizeNwith a backward migration probability ofmper individual per generation is a polynomial of degreeNwith respect to the frequency of A among migrants that is kept con-stant. Note that the proof does not require an exact expression for p(N; n1,. . ., nk), which represents the
probability for the population at stationarity to havek
migrant ancestors labeled from 1 tokand havingn1,. . ., nkdescendants, respectively. However, the analogy with
an infinitely many alleles mutation model with a mu-tation rate u ¼ m per gene per generation and the
importance of sampling formulas for drawing inferen-ces about genetic and demographic parameters make of interest such an expression for any sample size n, in which case the probability is represented byp(n;n1,. . ., nk). The number of terms to sum up to compute this
probability corresponds to the number of ways that the sampled genes can be lost backward in time by mutation or coalescence and this number increases rapidly with the sample size. Unless the population sizeNis large, all these terms have to be considered.
If we letNgo to infinity anduto zero and keepu¼ 2Nu constant, then only the arrays ðri;tÞ for the gene
losses withrt11¼rt1 fort¼1,. . .,nwill contribute
to the probability of the sample configuration since
N½rt11
Nrt ð1uÞrtN½rt¼
2Nrt11rt11
rtðu1rt1Þð11Oð1=NÞÞ: ð31Þ
There aren!=ðQini!Þsuch arrays withri,t11¼ri,t1 for
one and only one typei, denoted byit, for eacht¼1,. . ., n. Then, using the identitySr,r1¼r(r1)/2 forr$2
andS1,0¼1, we find that the probability is the same for
each array and that the probability for all arrays is
n!uk k! Qk
i¼1ni
Qn
r¼1ðu1r 1Þ
: ð32Þ
This is the Ewens sampling formula for labeled types (Ewens1972; Karlinand Mcgregor1972; see Ewens 2004, Section 3.6, for more details on its deduction from a diffusion approximation, and Griffithsand Lessard 2005, for a combinatorial proof based on a coalescent approximation).
The difference between the exact sampling formula for a fixed population size and a fixed mutation rate and the large-N, small-uapproximation comes mainly from the occurrence of simultaneous mutation or coalescence events that cannot be neglected in the general case. This is particularly relevant whenN corresponds to a deme size in a subdivided population, which can be quite small (,10), anduto a migration rate from one deme to any other, which can be very high (.101).
The exact formula has been deduced by considering all generations backward in time and unconditional transition probabilities for the sample configuration from one generation to the previous one. An alternative approach would be to consider only the generations with a change by mutation or coalescence and condi-tional transition probabilities given such a change, but this approach would be equivalent and not simpler.
LITERATURE CITED
Abramowitz, M., and I. A. Stegun, 1965 Handbook of Mathematical Functions.Dover, New York.
Cherry, J. L., and J. Wakeley, 2003 A diffusion approximation for
selection and drift in a subdivided population. Genetics 163:
421–428.
Ethier, S. N., and T. Nagylaki, 1980 Diffusion approximations of
Markov chains with two timescales and applications to popula-tion genetics. Adv. Appl. Probab.12:14–49.
Ewens, W. J., 1972 The sampling theory of selectively neutral alleles.
Theor. Popul. Biol.3:87–112.
Ewens, W. J., 1990 Population genetics theory—the past and the
fu-ture, pp. 177–227 in Mathematical and Statistical Developments of Evolutionary Theory, edited by S. Lessard. Kluwer Academic
Pub-lishers, Amsterdam.
Ewens, W. J., 2004 Mathematical Population Genetics, Ed. 2. Springer,
New York.
Feller, W., 1968 An Introduction to Probability Theory and Its Applica-tions, Ed. 3. John Wiley & Sons, New York.
Fisher, R. A., 1930 The Genetical Theory of Natural Selection.
Claren-don Press, Oxford.
Fu, Y. X., 2006 Exact coalescent for the Wright-Fisher model. Theor.
Popul. Biol.69:385–394.
Griffiths, R. C., and S. Lessard, 2005 Ewens’ sampling formula
and related formulae: combinatorial proofs, extensions to vari-able population size and applications to ages of alleles. Theor. Popul. Biol.68:167–177.
Hoppe, F. M., 1984 Polya-like urns and the Ewens’ sampling
for-mula. J. Math. Biol.20:91–94.
Hoppe, F. M., 1987 The sampling theory of neutral alleles and
an urn model in population genetics. J. Math. Biol. 25:
123–159.
Joyce, P., and S. Tavare´, 1987 Cycles, permutations and the
struc-ture of the Yule process with immigration. Stoch. Proc. Appl.25:
309–314.
Karlin, S., and J. L. McGregor, 1972 Addendum to a paper of W.
Ewens. Theor. Popul. Biol.3:113–116.
Kingman, J. F. C., 1982 The coalescent. Stoch. Proc. Appl.13:235–
248.
Moran, P. A. P., 1958 Random processes in genetics. Proc. Camb.
Philos. Soc.54:60–71.
Moran, P. A. P., 1959 The theory of some genetical effects of
pop-ulation subdivision. Aust. J. Biol. Sci.12:109–116.
Moran, P. A. P., 1962 Statistical Processes of Evolutionary Theory.
Clarendon Press, Oxford.
Rannala, B., 1996 The sampling theory of neutral alleles in an
island population of fluctuating size. Theor. Popul. Biol. 50:
91–104.
Rothman, E. D., C. F. Singand A. R. Templeton, 1974 A model for
the analysis of population structure. Genetics78:934–960. Sawyer, S. A., and D. L. Hartl, 1992 Population genetics of
poly-morphism and divergence. Genetics132:1161–1176.
Tavare´, S., 1989 The genealogy of the birth, death, and
immigra-tion process, pp. 41–56 inMathematical Evolutionary Theory, edited by M. W. Feldman. Princeton University Press, Princeton, NJ.
Wakeley, J., 2003 Polymorphism and divergence for island-model
species. Genetics163:411–420.
Wakeley, J., and T. Takahashi, 2004 The many-demes limit for
se-lection and drift in a subdivided population. Theor. Popul. Biol.
66:83–91.
Wright, S., 1931 Evolution in Mendelian populations. Genetics16:
97–159.