DOI: 10.1534/genetics.106.069740
Highly Variable Patterns of Linkage Disequilibrium in Multiple
Soybean Populations
David L. Hyten,*
,†Ik-Young Choi,*
,1Qijian Song,*
,†Randy C. Shoemaker,
‡Randall L. Nelson,
§Jose M. Costa,
†James E. Specht** and Perry B. Cregan*
,2*Soybean Genomics and Improvement Laboratory, U. S. Department of Agriculture, Agricultural Research Service, Beltsville, Maryland 20705, †Natural Resource Sciences and Landscape Architecture, University of Maryland, College Park, Maryland 20742,‡Department
of Agronomy, U. S. Department of Agriculture, Agricultural Research Service, Iowa State University, Ames, Iowa 50011, §Soybean/Maize Germplasm, Pathology, and Genetics Research Unit and Department of Crop Sciences, U. S. Department
of Agriculture, Agricultural Research Service, University of Illinois, Urbana, Illinois 61801 and**Department of Agronomy and Horticulture, University of Nebraska, Lincoln, Nebraska 68583
Manuscript received December 14, 2006 Accepted for publication February 1, 2007
ABSTRACT
Prospects for utilizing whole-genome association analysis in autogamous plant populations appear promising due to the reported high levels of linkage disequilibrium (LD). To determine the optimal strategies for implementing association analysis in soybean (Glycine max L. Merr.), we analyzed the structure of LD in three regions of the genome varying in length from 336 to 574 kb. This analysis was conducted in four distinct groups of soybean germplasm: 26 accessions of the wild ancestor of soybean (Glycine sojaSeib. et Zucc.); 52 Asian G. max Landraces, the immediate results of domestication from G. soja; 17 Asian Landrace introductions that became the ancestors of North American (N. Am.) cultivars, and 25 Elite Cultivars from N. Am. In G. soja, LD did not extend past 100 kb; however, in the three cultivatedG. maxgroups, LD extended from 90 to 574 kb, likely due to the impacts of domestication and increased self-fertilization. The three genomic regions were highly variable relative to the extent of LD within the three cultivated soybean populations.G. sojaappears to be ideal for fine mapping of genes, but due to the highly variable levels of LD in the Landraces and the Elite Cultivars, whole-genome association analysis in soybean may be more difficult than first anticipated.
L
INKAGE disequilibrium (LD) is the nonrandom association of alleles at different loci, and is af-fected by a number of factors. The processes of domes-tication, population subdivision, founding events, and selection can increase LD throughout the genome or in genomic segments flanking selected loci (Rafalski and Morgante2004). Recombination decreases LD in a population and can eventually restore equilibrium be-tween loci. LD is the basis of genetic association analysis for the discovery and fine mapping of genes or quantita-tive trait loci (QTL) in natural populations (Thornsberryet al. 2001; Wilson et al. 2004). Genetic association analysis measures correlations between genetic variants and phenotypic differences on a population basis and thus depends on LD for the detection of significant associations (Flint-Garciaet al.2003).
LD has been found to have a structure in humans that is best described using a haplotype block model. Hap-lotype blocks are consecutive sites in high LD flanked
by blocks demonstrating historical recombination (Daly
et al.2001; Gabrielet al.2002; Altshuleret al.2005). This type of structure can obscure predictable associa-tion based purely on physical distance between loci. If the structure of LD is unknown, a significant associa-tion of a sequence variant with a trait can place the gene or QTL anywhere within the haplotype block. Phase I of the HapMap project demonstrated that de-termination of the structure of LD in a subset of popu-lations can identify a subgroup of markers (tag SNPs) that can be useful in sampling most common variations (Altshuleret al.2005).
Soybean (Glycine maxL. Merr.) is a major crop plant grown worldwide on 74 million hectares (Wilcox2004) and is a species in which there is the potential to apply genetic association analysis for QTL discovery and fine mapping. Soybean was domesticated3000–5000 years ago from the wild species G. soja (Seib. et Zucc.) (Hymowitz 2004). While cultivated soybean is widely known as an autogamous species with outcrossing rates of,1%, the wild progenitorG. sojahas been reported to have an outcrossing rate as high as 13% (Fujitaet al. 1997). The greater amount of outcrossing inG. soja in-creases the effective recombination rate, leading to the prediction of an 11-fold lower extent of LD inG. sojaas compared to G. max (Flint-Garcia et al. 2003). The
1Present address:Genome Research Laboratory/National
Instrumenta-tion Center for Environmental Management, Seoul NaInstrumenta-tional University, Seoul 151-921, South Korea.
2Corresponding author:Beltsville Agricultural Research Center, 10300
Baltimore Ave., Bldg. 006, Room 100, Beltsville, MD 20705. E-mail: [email protected]
and determined that.86% of the parentage could be traced to only 17 ancestors selected from the introduced landraces. Thus, the current N. Am. soybean germplasm pool, as defined by Gizliceet al. (1994), is the result of several cycles of selection and effective recombination among a relatively small number of selections from the Asian landraces. Our objective was to determine if LD structure and extent varies between different populations of soybean and to determine if the structure and extent of LD is consistent throughout the genome within the individual populations.
MATERIALS AND METHODS
Plant materials: The plant materials included genotypes from four soybean populations described by Hyten et al. (2006) and listed in supplemental Table S1 at http://www. genetics.org/supplemental/. The first population consisted of 26G. sojaplant introductions from China, Korea, Taiwan, Russia, and Japan. The population of Landraces consisted of 52 Asian plant introductions from China, Korea, and Japan. TheG. soja and the Landraces were selected to represent a range of geographic origin and various maturity classes to maximize the diversity sampled. The 17 N. Am. Ancestors were the specificG. maxaccessions that are estimated to contribute at least 86% of the genes present in the gene pool of N. Am. soybean cultivars (Gizliceet al.1994). The population of Elite Cultivars consisted of 25 N. Am. cultivars publicly released between 1977 and 1990, which were selected to maximize diversity on the basis of coefficient-of-parentage estimations by Gizliceet al. (1996). Seeds of all genotypes were obtained from the U.S. Department of Agriculture (USDA) Soybean Germplasm Collection (USDA-Agricultural Resource Service, University of Illinois, Urbana, IL). DNA was extracted from bulked leaf tissue of 8–10G. sojaplants or 30–50G. maxplants as described by Keimet al.(1988).
Source of genomic sequences:Currently, only three regions of contiguous sequence.300 kb in length are publicly avail-able in soybean. Two genomic regions have been deposited in GenBank under accession nos. AX196295, AX196296, AX196297, and AX197417 (http://www.ncbi.nlm.nih.gov). The program bl2seq (http://www.ncbi.nlm.nih.gov) was used for all compar-isons of sequences from GenBank. GenBank accession nos. AX196295 and AX196296 completely aligned with a sequence length of 336 kb and were considered one sequence. AX196295 was placed on the genetic map by aligning it to GenBank accession no. BH126500, which is the microsatellite marker BARC-Satt309 mapping to soybean linkage group (LG) G (Song et al. 2004). BARC-Satt309 is tightly linked to the soybean disease resistance gene for soybean cyst nematode (rhg1) (Creganet al.1999). The genome region AX196295 will be referred to hereafter as chromosomal region G (CR-G). GenBank accession nos. AX196297 and AX197417 have a 50-kb
development. This BAC contig region will be referred to as CR-J.
SNP discovery and genotyping:PCR primers were designed throughout the three chromosomal regions with Array De-signer 2.0 (Premier Biosoft International, Palo Alto, CA). Primers were used to amplify genomic DNA from the soybean genotypes ‘‘Archer,’’ ‘‘Minsoy,’’ ‘‘Noir 1,’’ ‘‘Evans,’’ ‘‘Peking,’’ and PI 209332. In those instances when a single discrete amplicon was produced, the DNA sequence of each product was determined to verify that it was an STS. PCR and amplification conditions were previously described by Zhu et al.(2003). Forward and reverse sequencing reactions were performed on an ABI 3700 or ABI 3730 using ABI Prism BigDye Terminator version 3.1 cycle sequencing (Applied Biosystems, Foster City, CA). Evenly distributed STSs contain-ing one or more SNPs in the six genotypes were selected throughout the three chromosomal regions for genotyping in each of the 120 individuals composing the four populations. Primer information and positions of the STSs on the three chromosomal regions are listed in supplemental Table S2 at http://www.genetics.org/supplemental/. The genotyping was done via forward and reverse sequencing reactions on the ABI 3700 or ABI 3730 as described above.
Sequence analyses: Sequence data from each STS were analyzed with SNP-PHAGE (Matukumalli et al. 2006b), which includes the standard DNA analysis software Phred, which estimates the probability of error in base calling, and Phrap that performs sequence alignment and a machine-learning method for SNP discovery (Matukumalli et al. 2006a) and summarizes all data in a MySQL database. The resulting alignments and SNP predictions were visually veri-fied using the Consed viewer (Gordonet al.1998). SNPs were resequenced if there was any ambiguity as to which allele was present. The pairwise estimatesD9 and r2 (Gautand Long
2003) were calculated using SNPs with a frequency.10% in the individual populations using the software package Haplo-view v. 3.31 (Barrettet al.2005). The aggressive tagger mode in Haploview was used to determine tag SNPs, where all common SNPs had a correlation ofr2$0.8 with one or more
of the tag SNPs. SNP data from Hytenet al.(2006) were used to calculate population structure. This data set included the resequencing of 102 randomly chosen genes in the same germplasm used in this study. The SNP information was converted into haplotypes from the 102 loci in each accession and used for the structure analysis. The results were based on a model with correlated allele frequencies among populations in the program Structure 2.0 (Pritchard et al.2000) with number of populations,K¼2–10, length of burn-in period 50,000, and a run of 500,000 replications of Markov chain Monte Carlo after burn in. Results of Structure were visualized withDistructsoftware (Rosenberg2004).
RESULTS
SNP discovery and coverage:The three regions used
groups. They consisted of a 336-kb sequenced region (CR-G), a 513-kb sequenced region (CR-A2), and a 574-kb BAC contig with available BAC end sequence (CR-J). A total of 309 PCR primer pairs with amplicons ranging from 500 to 800 bp in length were tested from the three CRs, and 167 (54%) produced a robust STS. Overall, 558 SNPs were discovered in 122 (73%) of the STSs in the diverse group of sixG. maxgenotypes. The sequence analysis of these six genotypes has been demon-strated to discover 93% of the common SNPs (frequency
.0.10) in a diverseG. maxgermplasm sample (Zhuet al. 2003). The remaining 27% of the STSs were mono-morphic in the six genotypes. Sequence diversity was not estimated since the elimination of monomorphic STSs would upwardly bias diversity estimates in the four populations. Seventy-four polymorphic STSs were se-lected to give maximum coverage across the three chromosomal regions with an average of one STS every 13.5 kb in CR-A2, 12.4 kb in CR-G, and 57.4 kb in CR-J. The lower frequency of STS in CR-J was due to the incomplete sequence data available for this BAC contig.
Population structure: Population structure is
com-monly evaluated using the software program Structure, which implements a model-based clustering algorithm (Pritchardet al.2000). Determining the true value of
Kfor population structure from the Hytenet al.(2006) data set was difficult, because there was a lack of a plateau of the ln Pr(X jK) value, which is used to test for significance of theKvalue. In this study, our sampling strategy presumed four distinct populations, yet the use of any Kvalue from 2 to 5 still resulted in the N. Am. Ancestors and the Elite Cultivars clustering to-gether (Figure 1). Despite the clustering toto-gether of the N. Am. Ancestors and the Elite Cultivars, we kept these populations separate for all subsequent analyses since the sampling strategy to obtain the two popula-tions was very different. Of course, the largerKvalues with multiple clusters occurring within a single popula-tion also indicate that populapopula-tion structure may occur in any of the three main populations.
LD across population samples: Few summary
statis-tics are available for characterizing LD across large chro-mosomal regions in large data sets (Gaut and Long 2003). The most common methods are to calculate the pairwise comparisonD9andr2between all physically
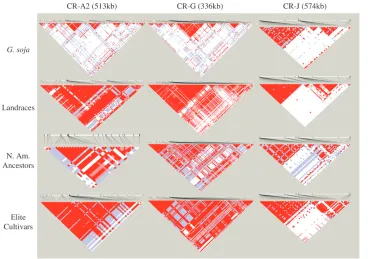
linked polymorphic marker combinations and plot these values against distance or in a matrix form (Gaut and Long2003).D9is a useful measure for detecting historical recombination, since it will have a value ,1 only if all four haplotypes are observed between biallelic loci.
TheD9matrix for the four populations reveals a very different pattern of LD decay between the G. sojaand the three cultivated soybean populations (Figure 2). It is apparent that LD has been degraded throughout the three regions inG. sojawith only small haplotype blocks still remaining. The haplotype blocks in the G. soja
population cover only a small fraction of the three chro-mosomal regions. Using common methods to define haplotype blocks (Gabrielet al.2002; Wanget al.2002; Barrettet al.2005),G. sojahad haplotype blocks with an average block length of 4.8 kb/block that covered 18% of the sequence length (Table 1). The largest hap-lotype block spanned 25 kb with the majority of blocks spanning,1 kb (data not shown).
The Landrace and N. Am. Ancestor populations had similar-size haplotype blocks, which were on average much larger than those of theG. sojapopulation (Table 1). The largest block in the Landraces spanned a dis-tance of 186 kb, but many blocks were ,1 kb in size (data not shown). The largest block in the N. Am. Ancestors spanned 89 kb (data not shown). The average block size and the amount of sequence covered by blocks were the greatest in the Elite Cultivars (Table 1). The average block size in the Elite Cultivars was more than twice that of any of the other populations as esti-mated by each of the three methods of haplotype block determination (Table 1) and there were only a few blocks that were,1 kb (data not shown).
LD across different genomic regions:The limited LD
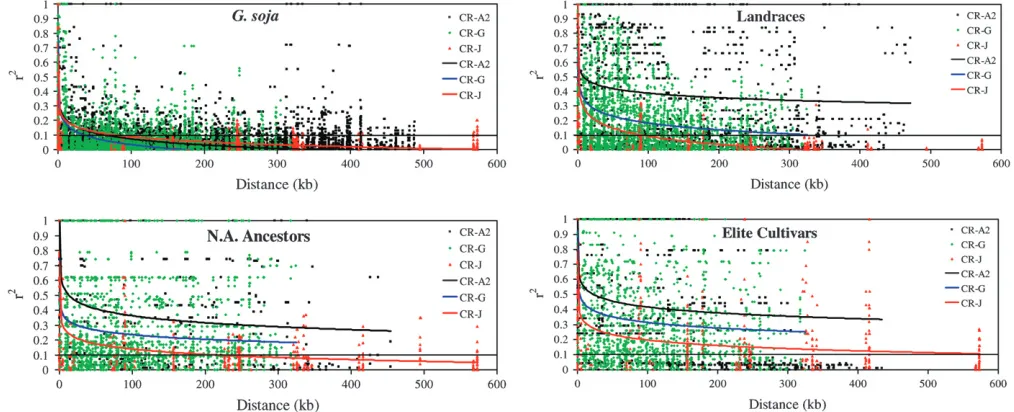
apparent whenr2is plotted against distance (Figure 3).
The average decay of LD inG. sojain the three chromo-somal regions analyzed declined to anr2¼0.1 between
36 and 77 kb (Figure 3). In contrast toG. soja, the other three populations did not demonstrate consistent de-cay of LD across the three fragments (Figure 3). In CR-A2, LD never decayed below r2 ¼ 0.1 throughout
the 513-kb region in the Landraces, N. Am. Ancestors, or the Elite Cultivars. In the CR-G region, LD decay reachedr2¼0.1 at 300 kb in the Landraces but never
reached anr2¼0.1 in the N. Am. Ancestors or in the
Elite Cultivars. In both the N. Am. Ancestors and the Elite Cultivars, the decline of r2 in CR-G was greater
than in CR-A2. In CR-J, LD decayed to r2 ¼ 0.1 at
a distance of 90 kb in the Landraces, 212 kb in the N. Am. Ancestors, and 574 kb in the Elite Cultivars (Figure 3).
Tag SNPs needed for whole-genome association
analysis: Whole-genome association analysis is most
efficient in a population with high LD. It is thus apparent that the three G. maxpopulations are more suited for whole-genome association analysis than the
G. soja population. However, the small number of the N. Am. Ancestors makes this an impractical population in which to conduct association studies. We therefore determined only the number of tag SNPs needed to detect most of the haplotype block variation in the Landraces and the Elite Cultivars (Table 2).
Tag SNPs are defined as a subset of SNPs that capture a large fraction of the allelic variation of all SNP loci (Altshuler et al. 2005). We found that the number of tag SNPs needed to capture 100% of alleles at an
r2.0.8 in the three regions ranged from a SNP every
9 kb to a SNP every 73 kb, reducing the number of Landraces, N. Am. Ancestors, and Elite Cultivars: bright red, D9 ¼ 1 and LOD$ 2; shades of pink/red,D9 ,1 and LOD$2; blue,D9¼1 and LOD,2; white, D9 ,1 and LOD,2.
TABLE 1
Summary of haplotype blocks in four soybean populations estimated by three methods commonly used to define haplotype blocks
G. soja Landraces
N. Am. Ancestors
Elite Cultivars
Blocks estimated using confidence bounds onD9(Gabrielet al.2002)
Average length per block (kb) 2.1 19.0 16.3 56.8
Amount of sequence included in blocks (%) 5 36 18 48
Blocks estimated by four-gamete rule (Wanget al.2002)
Average length per block (kb) 4.3 13.6 21.3 46.0
Amount of sequence included in blocks (%) 19 35 36 65
Blocks estimated by Solid Spine of LD (Barrettet al.2005)
Average length per block (kb) 4.8 21.5 34.9 80.1
SNPs needed for an effective whole-genome association analysis by 69–91% (Table 2). These data imply that a whole-genome association analysis that will test for most of the haplotype variation of the euchromatic DNA, which was estimated by Hymowitz(2004) to be 64% of the genome or 705 Mb, would require 9600–75,600 SNPs, depending on which of the three fragments is the most representative of the soybean genome (Table 2). Wide variation in the estimated number of SNPs needed to conduct a whole-genome association analysis is due to the differences of LD present among the two popula-tions and the differences in the three genome regions as seen on anr2plot (Figure 4). With further sampling
of genomic LD, a better estimate of the number of SNPs needed for a whole-genome association analysis can be obtained.
DISCUSSION
Variable LD between chromosomal regions and
populations: While effective recombination rate does
affect LD decay, many other factors, such as domestica-tion, selecdomestica-tion, founding events, population subdivi-sion, and population stratification, can complicate predictions of the extent of LD (Flint-Garcia et al. 2003). The Landraces resulted from domestication, which would be expected to increase LD throughout the entire genome. Furthermore, loci governing traits directly associated with domestication would be associ-ated with extended levels of LD. A possible example is the level of LD on CR-A2, which is more extensive than that in CR-G or CR-J in the Landraces. CR-A2 contains the Ilocus, which is one of a set of chalcone synthase gene duplications that affect hilum and seed-coat color (Toddand Vodkin1996). It is likely that theIlocus is a gene that was under selection during domestication since nearly allG. soja accessions have completely pig-mented seed coats and most landraces have yellow seed coats. Through a sampling of Landraces that contain the different alleles of theIlocus, it should be possible to determine if the CR-A2 is a region that was affected by a selective sweep during domestication.
Figure3.—Linkage disequilibrium plots ofr2vs.distance for the three chromosomal regions CR-A2, CR-G, and CR-J inG. soja, Landraces, N. Am. Ancestors, and Elite Cultivars.
TABLE 2
Tag SNPs needed to define allelic variation in Landrace and Elite Cultivars
Population
Chromosomal region
Size of chromosomal
region (kb)
No. of common SNPs (frequency.10%)
genotyped
Tag SNPs estimated to capture 100% of allelic variation at
r2.0.8
Distribution of tag SNPs (kb/tag SNP)
Estimated tag SNPs required for whole-genome scana
Landraces CR-A2 513 96 10 51 13,700
CR-G 336 176 36 9 75,600
CR-J 574 52 16 35 19,700
Elite Cultivars CR-A2 513 74 7 73 9,600
CR-G 336 149 14 24 29,400
CR-J 574 51 12 47 14,800
a
A large effect of domestication on LD has been demonstrated in barley. Wild barley has LD levels that are equal to maize (Morrellet al.2005), but the LD in the barley landraces is more extensive and most likely due to domestication (Caldwell et al. 2006). Rice, which has also undergone domestication and is a self-ing species, has extended amounts of LD rangself-ing up to 115 kb (Garriset al.2003). However, in soybean, CR-J had LD decay that was almost identical inG. soja and the Landraces. This could suggest that LD in the Land-races may be similar to that of the wild ancestor and that both CR-A2 and CR-G had been targets of selective sweeps with resultant higher levels of LD. Another pos-sibility is that selective forces have acted upon CR-J, which contains several disease-resistant genes, to rapidly decrease the extent of LD via balancing selection.
Before general conclusions about genomewide LD decay in soybean can be reached, more regions need to be characterized, as has been done in Arabidopsis. The first measurement of LD in Arabidopsis was around the FRI locus and it was concluded that LD extended up to 250 kb (Nordborget al.2002). A further study of the entire genome indicated that the extent of LD is closer to 50 kb (Nordborget al.2005). A similar genome scan of soybean would help determine if the average genome LD is closest to the estimates from the genomic regions CR-A2, CR-G, or CR-J. Such an analysis would greatly as-sist in the design of future association analysis studies.
The N. Am. Ancestors are the founding population for the Elite Cultivars. An analysis of population struc-ture suggested that there is little strucstruc-ture between these two populations. Compared to the Landraces, these two populations show evidence of increased LD in CR-G and CR-J. A previous study characterized LD in 16 direct introductions to N. Am. (of which 12 accessions
were in common with this study) and found LD was extensive and dissipated at 2–3 cM over a 12.5-cM region that encompasses CR-G (Zhuet al.2003). This result is in agreement with this study, where LD did not dissipate below the r2 ¼ 0.1 threshold in the 17
ancestors in CR-G. Further sequence data in the region surrounding CR-G are needed to confirm LD dissipa-tion in 2–3 cM, which is a distance of 800–1200 kb.
The increased LD in the Elite Cultivarsvs.the Land-races and the N. Am. Ancestors may be due to a number of factors. Selection occurring on or near the three chro-mosomal regions could be responsible for the increased LD. Similarly, an increase in LD due to selection and the bottleneck created by the development of elite inbred lines has also been shown in an elite maize population (Tenaillon et al. 2001) and elite barley populations (Caldwellet al.2006; Rostokset al. 2006). Another factor that may have contributed to increased LD in soy-bean is photoperiod sensitivity (maturity), which resulted in population subdivision in elite soybean cultivars. The structure analysis of 102 genes throughout the genome in the Elite Cultivars revealed a subdivision between early maturing and later-maturing cultivars (Figure 1).
Whole-genome association analysis:The variable
pat-tern of LD among fragments and populations provides a range of estimates of the number of tag SNPs that will be needed to capture most haplotype variation for a whole-genome association analysis in soybean. Exten-sive collections of thousands of Asian Landraces and large collections of elite cultivars should provide excel-lent populations to facilitate whole-genome association analysis. Arabidopsis, which is an autogamous species, has LD extending up to 50 kb and would require one marker within 10 kb of a causative polymorphism to provide reasonable power for a whole-genome scan and Elite Cultivars, which are likely candidate populations for whole-genome association analy-sis in soybean: solid,r2¼1; shadings, 0,r2,1;
for QTL discovery (Aranzana et al. 2005). The esti-mates of LD that we have found in the Landraces and the Elite Cultivars are two to seven times higher than in Arabidopsis, except in the case of CR-J, which was similar to Arabidopsis (Table 2). Still, with the greater extent of LD that we estimated for soybean compared to Arabidopsis, the greater size of the soybean genome implies that 9600–75,600 SNP markers would be needed to successfully identify most common haplotype varia-tion (haplotypes with a minimum allele frequency
.10%) in the euchromatic DNA. This result suggests that whole-genome association analysis will require large numbers of markers, even in selfing crop species with high levels of LD. To make such analyses possible, investments in marker discovery as well as in rapid and inexpensive genotyping technologies will be required.
Even with the large number of markers required to assay most of the common variation, there is still likely to be scientific and commercial interest in performing whole-genome scans in soybean. In this regard, an im-portant question is the population in which to attempt such an analysis. While the Elite Cultivars have more ex-tensive LD, thus necessitating fewer markers, we would suggest that the Landraces are the ideal population for whole-genome association studies in soybean. There are an estimated 45,000 unique landraces preserved in soybean germplasm collections around the world, and most have been characterized for many traits (Carter
et al.2004). In contrast, there are only 480 publicly rele-ased N. Am. Elite Cultivars that are likely to be readily available for analysis (http://www.ars-grin.gov). Due to the selfing nature of soybean there is likely to be a high degree of population structure, which will increase the likelihood of spurious marker–trait associations. Case-control studies with selection of a proper control population can help control for population structure, hence reducing the rate of false-positive associations (Aranzana et al. 2005). With the larger sampling of Landraces available, several case-control populations can be created for single traits to perform whole-genome scans to discover and then verify positive associations.
There are currently.1100 putative QTL identified in soybean (http://www.soybase.org). All of these putative QTL have been identified via the traditional linkage mapping techniques, but relatively few have been con-firmed. The genome location of a QTL mapped with traditional mapping populations of 100 individuals generally has a confidence interval of 20–30 cM in size (Stuber et al.1999), which, in soybean, likely encom-passes 8–13 Mb. Given the extent of LD in the Land-races, it should be possible to greatly improve the resolution of QTL position using association analysis. The position of a QTL might be further resolved by fine mapping using a case-control association analysis inG. soja, assuming that genetic variability for the trait in question is available inG. soja. Our results indicate that the resolution of association analysis inG. sojashould be,100 kb.
Conclusion:Our study has determined the level of LD
in three chromosomal regions in multiple soybean pop-ulations. We have found that LD is highly variable not only among populations but also between different re-gions of the genome. We have also determined that a large number of SNPs will be required to perform whole-genome association analysis even in a selfing species with relatively extensive LD. A HapMap of soybean will facili-tate whole-genome association analysis and will expedite the fine mapping of many currently identified QTL.
We thank Tina Sphon, Tad Sonstegard, and the Bovine Functional Genomics Lab–Animal and Natural Resources Institute Beltsville Agricultural Research Center East DNA Sequencing Facility for assistance with the genomic STS sequencing. We thank Charles Fenster, William Kenworthy, and Marla McIntosh for helpful com-ments on this study. This work was partially supported by United Soybean Board Projects 4212 and 5212. The support of the United Soybean Board is greatly appreciated.
LITERATURE CITED
Altshuler, D., L. D. Brooks, A. Chakravarti, F. S. Collins, M. J.
Daly et al., 2005 A haplotype map of the human genome.
Nature437:1299–1320.
Aranzana, M. J., S. Kim, K. Zhao, E. Bakker, M. Horton et al.,
2005 Genome-wide association mapping in Arabidopsis identi-fies previously known flowering time and pathogen resistance genes. PLoS Genet.1:e60.
Barrett, J. C., B. Fry, J. Mallerand M. J. Daly, 2005 Haploview:
analysis and visualization of LD and haplotype maps. Bioinfor-matics21:263–265.
Caldwell, K. S., J. Russell, P. Langridge and W. Powell,
2006 Extreme population-dependent linkage disequilibrium detected in an inbreeding plant species,Hordeum vulgare. Genet-ics172:557–567.
Carter, T. E., R. Nelson, C. H. Snellerand Z. Cui, 2004 Genetic
diversity in soybean, pp. 303–416 inSoybeans: Improvement, Produc-tion, and Uses, edited by H. R. Boermaand J. E. Specht. American
Society of Agronomy, Crop Science Society of America, Soil Sci-ence Society of America, Madison, WI.
Cregan, P. B., J. Mudge, E. W. Fickus, L. F. Marek, D. Daneshet al.,
1999 Targeted isolation of simple sequence repeat markers through the use of bacterial artificial chromosomes. Theor. Appl. Genet.98:919–928.
Daly, M. J., J. D. Rioux, S. F. Schaffner, T. J. Hudsonand E. S.
Lander, 2001 High-resolution haplotype structure in the
hu-man genome. Nat. Genet.29:229–232.
Flint-Garcia, S. A., J. M. Thornsberryand E. S. Buckler, IV,
2003 Structure of linkage disequilibrium in plants. Annu. Rev. Plant Biol.54:357–374.
Fujita, R., M. Ohara, K. Okazakiand Y. Shimamoto, 1997 The
ex-tent of natural cross-pollination in wild soybean (Glycine soja). J. Hered.88:124–128.
Gabriel, S. B., S. F. Schaffner, H. Nguyen, J. M. Moore, J. Royet al.,
2002 The structure of haplotype blocks in the human genome. Science296:2225–2229.
Garris, A. J., S. R. McCouchand S. Kresovich, 2003 Population
structure and its effect on haplotype diversity and linkage dis-equilibrium surrounding thexa5locus of rice (Oryza sativaL.). Genetics165:759–769.
Gaut, B. S., and A. D. Long, 2003 The lowdown on linkage
disequi-librium. Plant Cell15:1502–1506.
Gizlice, Z., T. E. Carter, Jr. and J. W. Burton, 1994 Genetic base
for North American public soybean cultivars released between 1947 and 1988. Crop Sci.34:1143–1151.
Gizlice, Z., T. E. Carter, Jr., T. M. Gerig and J. W. Burton,
1996 Genetic diversity patterns in North American public soy-bean cultivars based on coefficient of parentage. Crop Sci.36:
753–765.
Gordon, D., C. Abajianand P. Green, 1998 Consed: a graphical
Matukumalli, L., J. Grefenstette, D. Hyten, I.-Y. Choi, P. Cregan
et al., 2006a Application of machine learning in SNP discovery. BMC Bioinformatics7:4.
Matukumalli, L. K., J. J. Grefenstette, D. L. Hyten, I. Y. Choi, P. B.
Creganet al., 2006b SNP-PHAGE: High throughput SNP
dis-covery pipeline. BMC Bioinformatics7:468.
Morrell, P. L., D. M. Toleno, K. E. Lundy and M. T. Clegg,
2005 Low levels of linkage disequilibrium in wild barley (Hordeum vulgare ssp. spontaneum) despite high rates of self-fertilization. Proc. Natl. Acad. Sci. USA102:2442–2447. Nordborg, M., J. O. Borevitz, J. Bergelson, C. C. Berry, J. Chory
et al., 2002 The extent of linkage disequilibrium in Arabidopsis thaliana. Nat. Genet.30:190–193.
Nordborg, M., T. T. Hu, Y. Ishino, J. Jhaveri, C. Toomajianet al.,
2005 The pattern of polymorphism in Arabidopsis thaliana. PLoS Biol.3:e196.
Pritchard, J. K., M. Stephensand P. Donnelly, 2000 Inference of
population structure using multilocus genotype data. Genetics
155:945–959.
Rafalski, A., and M. Morgante, 2004 Corn and humans:
recombi-nation and linkage disequilibrium in two genomes of similar size. Trends Genet.20:103–111.
Rosenberg, N. A., 2004 DISTRUCT: a program for the graphical
display of population structure. Mol. Ecol. Notes4:137–138.
Natl. Acad. Sci. USA98:9161–9166.
Thornsberry, J. M., M. M. Goodman, J. Doebley, S. Kresovich, D.
Nielsenet al., 2001 Dwarf8 polymorphisms associate with
vari-ation in flowering time. Nat. Genet.28:286–289.
Todd, J. J., and L. O. Vodkin, 1996 Duplications that suppress and
deletions that restore expression from a chalcone synthase multi-gene family. Plant Cell8:687–699.
Wang, N., J. M. Akey, K. Zhang, R. Chakraborty and L. Jin,
2002 Distribution of recombination crossovers and the origin of haplotype blocks: the interplay of population history, recom-bination, and mutation. Am. J. Hum. Genet.71:1227–1234. Wilcox, J. R., 2004 World distribution and trade of soybean, pp. 1–14
inSoybeans: Improvement, Production, and Uses, edited by H. R. Boerma
and J. E. Specht. American Society of Agronomy, Crop Science
Society of America, Soil Science Society of America, Madison, WI. Wilson, L. M., S. R. Whitt, A. M. Ibanez, T. R. Rocheford, M. M.
Goodmanet al., 2004 Dissection of maize kernel composition
and starch production by candidate gene association. Plant Cell
16:2719–2733.
Zhu, Y. L., Q. J. Song, D. L. Hyten, C. P. Van Tassell, L. K.
Matukumalli et al., 2003 Single-nucleotide polymorphisms
in soybean. Genetics163:1123–1134.