A Microsatellite-Based Multilocus Screen for the Identification of
Local Selective Sweeps
Christian Schlo
¨tterer
1Institut fu¨r Tierzucht und Genetik, Veterina¨rmedizinische Universita¨t Wien, 1210 Wien, Austria Manuscript received July 19, 2001
Accepted for publication November 5, 2001
ABSTRACT
With the availability of completely sequenced genomes, multilocus scans of natural variability have be-come a feasible approach for the identification of genomic regions subjected to natural and artificial selection. Here, I introduce a new multilocus test statistic, ln RV, which is based on the ratio of observed variances in repeat number at a set of microsatellite loci in two groups of populations. The distribution of ln RV values captures demographic history of the populations as well as variation in microsatellite muta-tion among loci. Given that microsatellite loci associated with a recent selective sweep differ from the re-mainder of the genome, they are expected to fall outside of the distribution of neutral ln RV values. The ln RV test statistic is applied to a data set of 94 loci typed in eight non-African and two African human populations.
I
T is well understood that genetic change provides phenotypic trait of potential adaptive relevance must be known. Limited information is available, however, the basis for adaptation processes in natural anddomesticated populations. Hence, the identification of about the traits that are responsible for the adaptation of natural populations to their environment. Thus, QTL those genetic changes causing a phenotype with an
in-creased fitness has been of long-standing interest in mapping has only limited potential for the identification of the genes that are involved in the adaptation process biological sciences.
Three different approaches to identify targets of selec- of natural populations.
tion (and thus adaptation) have been pursued: (1) the The key for a multilocus screen is the idea that differ-candidate gene approach, (2) QTL mapping, and (3) ent forces act in characteristic ways on the genome. While the multilocus screen. genetic drift, migration, and inbreeding affect all loci The candidate gene approach is based on ana priori to the same extent, selection is targeted to a few loci knowledge about the function of a given gene. The ease only. Hence, a locus, which shows a significantly differ-of PCR amplification and DNA sequencing, combined ent pattern from the remainder of the genome, is ex-with the availability of several test statistics to evaluate pected to reside in a genomic region that has been the the statistical significance of the observed and expected target of selection. This idea was first used by Cavalli-patterns of DNA sequence variation (Otto2000), has re- Sforza(1966), who calculatedFvalues over several hu-sulted in numerous studies using a candidate gene ap- man groups. Later, Lewontin and Krakauer(1973) proach. Despite the unquestionable importance of these proposed a formal test statistic to identify loci that devi-studies in understanding the partitioning of genetic vari- ate from a neutral pattern. This test statistic is based on ation in natural populations, this approach is limited the variance of the inbreeding coefficientF, which is to a small number of candidate genes. Hence, a screen proportional to the square of its mean value averaged for genes involved in adaptation is difficult to pursue across loci. This test has been subsequently criticized for as neither the traits nor their genetic basis are known. several reasons. In particular, correlations in allele fre-QTL mapping (Lynch andWalsh 1998) is a more quencies, which could be caused by stepping-stone mi-general approach. On the basis of the idea that many gration and phylogenetic history, will inflate the vari-traits are of quantitative nature, QTL mapping aims to ance in F relative to the expectations. Furthermore, partition the phenotypic variance into a genotypic and skewed allele frequencies will also affect the Lewontin-environmental component. While this approach is be- Krakauer test (Nei andMaruyama 1975;Robertson coming increasingly popular to identify genes contribut- 1975). Despite some recent improvements (Tsakasand ing to a given trait, it suffers from the problem that the Krimbas 1976; Bowcock et al. 1991; Beaumont and Nichols1996;Vitalis et al.2001) these test statistics have never been widely used to infer selection from multilocus data.
With the recent progress in genomics, various new
1Address for correspondence:Institut fu¨ r Tierzucht und Genetik,
Veteri-markers, which are distributed over the genome at a
na¨rmedizinische Universita¨t Wien, Josef Baumann Gasse 1, 1210 Wien,
Austria. E-mail: [email protected] high density, have become available. In combination with
and the Rondonian Surui from Brazil. More information about the (almost) complete genomic sequence of various
orga-these populations is available at http://info.med.yale.edu/ nisms, multilocus screens should be reconsidered.
genetics/kkidd/pops.html.
While the high density of available single nucleotide Genetic markers used:Data from a total of 94 microsatellite polymorphisms (SNPs) makes them the marker of choice loci were used. The loci are part of the ABI linkage panels 8–11 and 13–16 covering the chromosomes 5–11. All data were for various studies, such as linkage disequilibrium
map-taken from the Kidd lab webpage: http://info.med.yale.edu/ ping, they are biallelic markers with a limited
informa-genetics/kkidd/abiinfo.html. GenBank searches were per-tion content of a single marker. Microsatellites, on the
formed before March 2001.
other hand, are less dense, but offer the advantage of Test of neutrality (ln RV test):Assuming the stepwise muta-a multimuta-allelic mmuta-arker, which is highly informmuta-ative. tion model (OhtaandKimura1973), neutrality, and muta-tion drift equilibrium, the variance in repeat number (V) is In this study I explore the potential of microsatellites
a good estimator of microsatellite variability (Moran 1975; to serve as a genetic marker for the identification of
ge-Goldsteinet al.1995;Slatkin1995b): nomic regions that have been subject to selection. While
microsatellites are unlikely to be the target of natural se- E[V]⫽4N
e. (1)
lection, linkage to a genomic region that has been the
Ne is the effective number of diploid individuals andthe
target of selection is expected to cause a deviation from
microsatellite mutation rate. Given that microsatellite muta-neutral expectations. The spread of a novel beneficial tion rates differ substantially among loci (
Di Rienzo et al. mutation through a population results in a reduction 1998; Harr et al.1998), it is difficult to compare variances of natural variability at the selected locus and flanking among loci directly. This problem can be circumvented by calculating the ratio of the variance in repeat number in two regions (Maynard Smith and Haigh 1974; Slatkin
populations, which is independent of the mutation rate. It 1995a). The extent to which flanking sequences are
has to be noted that the expectation of RV is not identical to affected by such a selective sweep depends largely on the the ratio of the expectations of V
Pop1 and VPop2. Computer
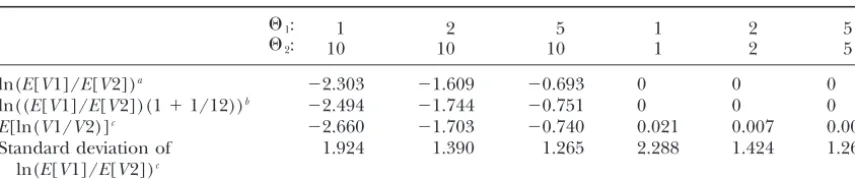
strength of selection and the recombination rate. Hence, simulations, however, indicate that over a reasonable range a microsatellite locus linked to a beneficial mutation is of parameters the two expectations are very similar (Table 1): expected to have a reduction in variability below neutral
expectations (Slatkin1995a;Schlo¨ ttereret al.1997; E[RV]⫽E
冤
VPop1VPop2
冥
⬵4NePop1
4NePop2
. (2)
PritchardandFeldman1998;Wiehe1998;Schlo¨ t-tererandWiehe 1999). Thus, a multilocus screen for
A better approximation is provided by the delta method genomic regions subjected to selection could take
advan-(LynchandWalsh1998):
tage of this reduction in variability.
This conceptionally simple approach is significantly
E[RV]⬵4NePop1
4NePop2
冢
1⫹ V(VPop2) (4NePop2)
2
冣
⬵4NePop1
4NePop2
冢
1⫹ 1
12
冣
. (3) hampered by the observed differences in variability amongmicrosatellite loci. In neutrally evolving populations
dif-Higher-order approximations given in Lynch and Walsh
ferent coalescent times and variation in mutation rates
(1998) are not included because of the large term1⁄ 12.
Com-are responsible for those differences. Hence, the goal
puter simulations show that (3) provides a better fit than (2) of a multilocus test for selected genomic regions is the (Table 1).
identification of those microsatellite loci that deviate Given the close fit of the approximation, it can be assumed that RV is independent of the mutation rate and all loci have from the neutrally evolving genome. While the variation
approximately the same expectation for a comparison of two in coalescent time can be estimated under certain
as-populations. Nevertheless, historic sampling causes variation sumptions of population history, the mutation rate of
in the coalescent times at the loci studied. Hence, a distribu-a microsdistribu-atellite locus remdistribu-ains distribu-an unknown pdistribu-ardistribu-ameter. tion of RV values is expected. To determine the shape of this Here, I introduce a new test statistic, ln RV, which ac- distribution, I used computer simulations (see below) and found that for neutrally evolving microsatellite loci the ln RV counts for neutral variation in coalescent times and
values follow a Gaussian distribution. different microsatellite mutation rates. A microsatellite
Hence, it is possible to design a test statistic to identify data set is used to evaluate the usefulness of the ln
individual microsatellite loci that deviate from neutral expec-RV test statistic to identify genomic regions that differ tations. Assuming that most loci are evolving neutrally, the between African and non-African human populations. mean and standard deviation of the observed ln RV values could be used to describe the corresponding Gaussian distri-bution. Using the density function of the Gaussian distribu-tion, it is possible to assign aPvalue to the ln RV value of each MATERIALS AND METHODS
locus. ThePvalues give the probability that a given ln RV value is consistent with the null hypothesis of a neutral evolution.
Population samples:Microsatellite data from 10 different
populations were analyzed. African populations were repre- Test for normal distribution:Visual inspection of the distri-bution of ln RV values from computer simulations suggested sented by Biaka Pygmies from the Central African Republic
and the Mbuti Pygmies from northwestern Zaire. Non-African that they are normally distributed. For a formal test, two differ-ent strategies were pursued. First, the nonparametric Kolmo-populations included a sample of unrelated Danish blood
donors, a moslem community from Northern Israel, Han Chi- gorov-Smirnov test was used to evaluate the distribution of 1000 simulated ln RV values. Because the tail of the distribu-nese living in the United States, native Japadistribu-nese from the
TABLE 1
Verification of approximations by computer simulation
⌰1: 1 2 5 1 2 5
⌰2: 10 10 10 1 2 5
ln(E[V1]/E[V2])a ⫺2.303 ⫺1.609 ⫺0.693 0 0 0
ln((E[V1]/E[V2])(1⫹1/12))b ⫺2.494 ⫺1.744 ⫺0.751 0 0 0
E[ln(V1/V2)]c ⫺2.660 ⫺1.703 ⫺0.740 0.021 0.007 0.003
Standard deviation of 1.924 1.390 1.265 2.288 1.424 1.268
ln(E[V1]/E[V2])c
aCorresponds to Equation 2. bCorresponds to Equation 3.
cEach simulation is based on 10,000 loci and 50 individuals.
ties of a normal distribution. First, the distribution is symmetri- linked to a genomic region subjected to directional selection. I assumed an instantaneous selective sweep, which was simu-cal with the same number of data points in the upper and
lower tail. Second, 95% (99%) of the values of a standardized lated as a bottleneck occurring at the selected locus only. Hence, one locus in one of the two populations was simulated distribution are expected to fall within the interval between
⫺1.96 (⫺2.58) and 1.96 (2.58). Hence, Fisher’s exact test under the selection model, while all other loci were simulated under the constant population size model.
could be used to test whether or not the number of observa-tions falling in the tail fits the expectaobserva-tions. I determined the significance from 1000 simulated ln RV values using the 1 and 5% tail. A distribution was considered to be normally
RESULTS distributed if the Kolmogorov-Smirnov test and the two-tail
tests were not significant (P⬍0.05).
Verification of the test statistic:To explore the
behav-Computer simulations: The coalescent process, which
de-ior of the ln RV test statistic computer simulations were scribes the genealogical history of chromosomes, provides a
performed under the following assumptions: neutrality, very simple approach to simulate population samples (
Hud-son1990). I made the standard assumptions associated with a constant population size, random mating, mutation the coalescent process including neutrality, constant popula- drift equilibrium, no linkage of the microsatellite loci, tion size, and panmixia.
and independence of the two populations. Using stan-If not stated otherwise, between 100 and 10,000 loci were
dard coalescent simulations (Hudson1990), I obtained simulated for two independent populations using the
unbi-the variance in repeat number for a set of microsatellite ased stepwise microsatellite mutation model (Ohta and
Kimura 1973; Goldstein et al. 1995). For each simulated loci. If not stated otherwise, computer simulations
as-locus, the ln RV test statistic was calculated. When variation sumed the unbiased stepwise mutation model (Ohta in microsatellite mutation rates was incorporated in the
com-andKimura1973;Goldsteinet al.1995). puter simulations, mutation rates varied by a factor 10 drawn
Dependence on the mutation rate:Using a wide range of from a uniform distribution. For these simulations the mean
⌰-values are reported. For a restricted set of parameters, com- ⌰-values (2–100) consistently resulted in a distribution puter simulations were run with a two-phase mutation model of ln RV values, which was very similar to a Gaussian of microsatellites (Di Rienzoet al.1994). In addition to single distribution (Figure 1, A and B). Based on 1000 loci and repeat changes, a given fraction of microsatellite mutations
a sample of 100 chromosomes, no significant deviation was allowed to mutate by more than one repeat unit. The
from normality could be detected (Kolmogorov-Smir-size change for such mutations was drawn from a uniform
distribution ranging from 1 to a specified maximum. nov and tail test,P⬎0.1). This observation is consistent The influence of demographic events, such as bottleneck with previous computer simulations (Goldstein et al. and population expansion, was studied by a modification of 1996; Pritchard and Feldman 1998) and empirical the constant population size model. All demographic events
reports (Harret al.1998), which demonstrated that ln affect the entire genome; therefore all loci were simulated
Vgenerally approximates a normal distribution. using the same algorithm. A bottleneck was modeled as
sug-gested byHudson(1990). For the computer simulations of Microsatellite mutation rates vary by more than one the population expansion, an instantaneous rise in population order of magnitude (Di Rienzoet al.1998;Harret al.
size was assumed. 1998). To account for this, microsatellite mutation rates
To study the effect of admixture, I modified a recently
were drawn from a uniform distribution, resulting in proposed method (Pritchardet al.2000) and simulated 100
an up to 10-fold variation in mutation rate (Figure 1C). chromosomes from three independent populations each. A
set of randomly selected chromosomes was taken from popula- Simulations of 1000 loci for 100 chromosomes each tion one and replaced the same number of chromosomes in did not result in statistically significant deviations from population two. Rather than simulating two additional genera- normality (Kolmogorov-Smirnov and tail test,P⬎0.1). tions for the admixed populations, the ln RV test statistic was
Finally, I also tested the influence of differences in popu-directly calculated for populations two and three.
lation sizes among the groups compared (Figure 1D). The neutral coalescent simulations could be modified to
Figure 1.—Distribution of ln RV values as obtained from coalescent simulations of 10,000 independent microsa-tellite loci and 100 sampled chromosomes. The parameters used for the simulations are
⌰-population1/⌰-population2/ variation in mutation rate among loci (in percentages): (A) 5/5/0; (B) 500/500/0; (C) 5/5/1000; (D) 5/500/0. The variation in mutation rate was simulated on the basis of a uni-form distribution.
(from 1:1 to 1:100) and no deviation from a normal Given the large uncertainty for each of these parame-ters, I used the reduction in variability (r) at the marker distribution could be detected for 1000 simulated
micro-satellite loci (Kolmogorov-Smirnov and tail test, P ⬎ locus as a compound parameter in the computer simula-tions. A strong reduction in variability could result from 0.1, 100 chromosomes). Hence, using a wide range of
parameters, the ln RV test statistic can be approximated a large selection coefficient, tight linkage to the selected site, or both. Consistent with expectation, a more pro-by a Gaussian distribution. This greatly facilitates the
design of a statistical test to detect deviation from neu- nounced reduction in variability resulted in larger num-bers of simulation runs with significant (P ⬍ 0.05) ln trality, as noa prioriknowledge about the mutation rate
or population size of the tested populations is required. RV values (Table 3). Also, the mean ln RV of the selected locus was higher and had a lower variance when a large Deviation from stepwise mutation model:Inference from
population data (Di Rienzoet al.1994) and direct obser- r was used. Hence, for a recent and strong reduction in variability, a large fraction of the selected loci will be vations (Wierdl et al. 1997; Brinkmann et al. 1998;
HarrandSchlo¨ tterer2000) indicated that microsa- identified by the ln RV statistic. Some differences could be detected between the simulations using different tellite mutations are not confined to single repeat unit
changes, but could also encompass larger gains and ⌰-values (Table 3). In comparison to the large effect ofr, the influence of⌰was found to be moderate. losses. To investigate whether such a modification of
the mutation process affects the ln RV test statistic, I Table 4 indicates that the power of the ln RV statistic simulated 1000 microsatellite loci for two populations
and a sample size of 100 chromosomes. No deviation
TABLE 2
from the normal distribution could be detected
(Kolmo-gorov-Smirnov and tail test,P⬎0.3, Table 2). The only Variance of the ln RV test statistic based on computer simula-notable difference was an increase in the variance of ln tions of 1000 loci in two neutrally evolving populations under
RV values with both a larger step size and a higher the two-phase microsatellite mutation model
proportion of loci not evolving by single repeat unit
K⫽0 K⫽0.2 K⫽0.4 changes (Table 2).
Power of the ln RV test statistic:To assess the power of S⫽5 1.44* 1.98* 1.90*
the ln RV test statistic I simulated the variance in repeat S⫽10 2.66* 1.99* number for 100 microsatellite loci of which one
microsa-Kis the probability of a mutation encompassing more than tellite locus was associated with a selective sweep. The
one repeat unit, andSis the upper boundary of size change rates of recombination between the selected site and by a single mutation event.⌰ ⫽5 (in both populations). *No the microsatellite as well as the strength of selection are deviation from normal distribution by Kolmogorov-Smirnov
TABLE 3
Power of the ln RV test statistic in dependence ofr
⌰ ⫽3 ⌰ ⫽6 ⌰ ⫽30
ln RV Variance FS ln RV Variance FS ln RV Variance FS
r⫽0.1 ⫺1.92 2.45 0.41 ⫺2.03 1.86 0.46 ⫺1.65 0.81 0.34 r⫽0.05 ⫺2.51 2.55 0.56 ⫺2.48 1.95 0.63 ⫺2.10 0.84 0.53 r⫽0.01 ⫺3.17 2.24 0.79 ⫺3.24 1.83 0.86 ⫺2.75 0.65 0.83
One locus was subjected to directional selection and 99 loci evolved neutrally.r, fraction to which variability was reduced due to linkage to a selected site; FS, fraction of significant (P⬍0.05) simulations; ln RV, mean ln RV value of the selected locus over 1000 simulation runs; Variance, variance of ln RV at the selected locus over 1000 simulation runs witht(time elapsed since the selective sweep in 2Ne) set to 0.02Ne.
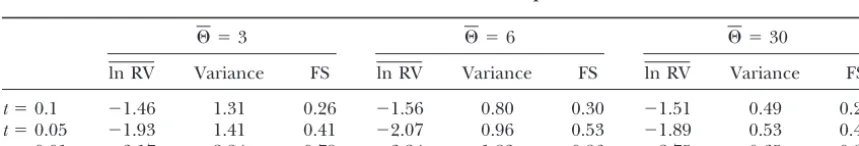
significantly decreases with the time elapsed since the were used to investigate the influence of common demo-graphic events (population expansion, bottlenecks, and selection (t) occurred. Only recent selective sweeps
could be detected reliably. This observation is fully con- admixture) on the distribution of ln RV values in neu-trally evolving populations. In all simulations one popu-sistent with previous analytical results (Wiehe 1998).
Similar to the simulations for whichrwas varied,⌰had lation was kept at a constant size, while for the other population either a change in size or admixture was only a moderate influence on the power of thelnRV
test. simulated.
Despite that computer simulations covered quite radi-Influence of the sample size:Despite the continuous
im-provement in screening technologies, the analysis of cal population size changes, for most simulations the ln RV values were not found to deviate significantly from large sample sizes is still an important hurdle in
popula-tion genetics. Therefore, it is interesting to determine a normal distribution. The most notable exceptions were recent and strong bottlenecks in combination with the influence of the number of sampled chromosomes
on the ln RV test statistic. The power of the ln RV test a low⌰(Table 6). Under such extreme scenarios, micro-satellite loci did not recover variability, resulting in an statistic is dependent on the shape of the distribution
of ln RV values. A larger variance in ln RV values requires excess of loci with low variability in the bottlenecked population. Interestingly, a bottleneck occurring 0.1Ne
a more extreme reduction in variability to obtain
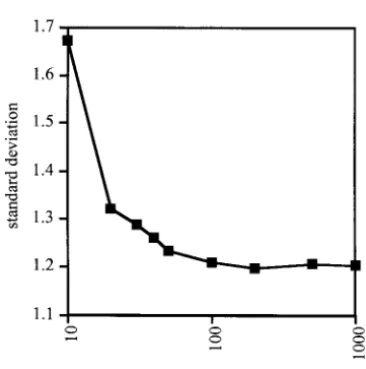
sig-nificance (Table 5). Therefore, I calculated the stan- generations ago resulted in a significant tail test (P⫽ 0.038) for the population with a large⌰(Table 6). For dard deviation of ln RV over 10,000 loci. Each ln RV
value was simulated for different sample sizes (10–1000 expanding populations only the combination of large ⌰-values with an older population expansion resulted chromosomes). Figure 2 clearly indicates that⬍30
chro-mosomes result in a large standard deviation, which in a significant deviation from a normal distribution (Table 7). This deviation is most likely the result of a will, in turn, result in a lower power of the ln RV test
statistic. On the other hand, samples of⬎50 chromo- large diversity generated in those samples, which was not adequately sampled with 100 chromosomes. When somes will not significantly improve the test statistic.
Hence, only a moderate number of individuals need to the sample size was increased to 200 chromosomes, no significant deviation from normality could be detected be typed to determine the significance level of the ln
RV test statistic. (data not shown). No significant deviation from a
nor-mal distribution was observed for various admixture pro-Influence of demographic events: Computer simulations
TABLE 4
Power of the ln RV test statistic in dependence oft
⌰ ⫽3 ⌰ ⫽6 ⌰ ⫽30
ln RV Variance FS ln RV Variance FS ln RV Variance FS
t⫽0.1 ⫺1.46 1.31 0.26 ⫺1.56 0.80 0.30 ⫺1.51 0.49 0.26 t⫽0.05 ⫺1.93 1.41 0.41 ⫺2.07 0.96 0.53 ⫺1.89 0.53 0.42 t⫽0.01 ⫺3.17 2.24 0.79 ⫺3.24 1.83 0.86 ⫺2.75 0.65 0.83
One locus was subjected to directional selection and 99 loci evolved neutrally.t, time point at which selection occurred (in 2Negenerations); FS, fraction of significant (P⬍0.05) simulations; ln RV, mean ln RV value of the
TABLE 6 TABLE 5
Power of the ln RV test statistic in relation Variance of ln RV when one population had passed through a bottleneck
to the variance of ln RV across loci
Variance in ln RV ⌰ ⫽3 ⌰ ⫽6 ⌰ ⫽30
No bottleneck 1.56 1.58 1.97
r 2.7 1.7 1.5
t⫽0.1 1.60 1.20 1.26**
0.01 0.76 0.84 0.90 t⫽0.05 2.48*** 1.32 1.30
0.1 0.35 0.42 0.48 t⫽0.01 5.98*** 2.02 1.48
The power is expressed as the fraction of simulations that A total of 10,000 microsatellite loci were simulated for two identified a locus linked to a selective sweep as a significant populations andrwas set to 0.1.t, time (in 2N
e) elapsed since
(P⬍0.05) outlier.r, fraction to which variability was reduced the bottleneck. Significant deviations from normal distribu-due to linkage to a selected site; the variance in ln RV was tion: **P⬍0.05, tail test; ***P⬍0.05, Kolmogorov-Smirnov determined over 1000 replicate simulations of 99 microsatel- test and tail test.
lite loci. One locus was assumed to be linked to a selected site. Different sample sizes in the computer simulations were used to obtain the differences in ln RV.
duced a wider distribution of ln RV when one population recently (t⫽0.01) went through a bottleneck. For those simulations, which are based on large⌰-values, a bottle-portions as well as different effective population sizes
neck resulted in a more narrow distribution of ln RV. of the source population (Table 8).
Population expansions were simulated using a wide The power of the ln RV test statistic depends strongly
range of times since expansion (t) and factors (r) by on the behavior of the neutrally evolving loci. If the ln
which the population size changed. Irrespective of the RV values have a broad distribution (large variance of
parameters used, population expansions always resulted ln RV), then the identification of a selected locus is
in a smaller variance of ln RV values (Table 7). more difficult. On the other hand, a very narrow
distri-Various proportions of admixture from a third popu-bution of ln RV values makes the identification of
se-lation were simulated. As expected, admixture increased lected loci easier (Table 5). Given that the power of
the variability in the admixed population, resulting in the ln RV test varies with the parameters used for the
a shift of mean ln RV values (Table 8). This was also computer simulation (see above), a systematic power
observed if immigrants from a population with a smaller assessment is difficult. Therefore, I use the variance of
effective population size replaced a large fraction (0.25) the ln RV values as an indication for the power of the
of the population (Table 8). The variance in ln RV ln RV test under various demographic scenarios.
values, however, was largely unaffected by admixture. Table 6 indicates that population bottlenecks could
Hence, the power of the ln RV test statistic is not signifi-have quite complex effects on the behavior of the ln
cantly influenced by admixture. RV test statistic. Simulations based on⌰-values of six
pro-Screening for adaptive mutations in the human ge-nome: Data from mtDNA and microsatellites suggest that human populations left Africa about 100,000 years ago to colonize the rest of the world (Jordeet al.1998). This migration challenged human populations in the form of a novel environment. Hence, a comparison of African and non-African populations could potentially
TABLE 7
Variance of ln RV with one recently expanded population
⌰ ⫽3 ⌰ ⫽6 ⌰ ⫽30
No expansion 1.56 1.58 1.97
t⫽0.1,f⫽10 0.97 0.95 1.36*
t⫽0.1,f⫽100 1.16 1.06 1.24*
t⫽0.01,f⫽10 1.33 1.29 1.95
t⫽0.01,f⫽100 0.91 0.91 1.34
Figure2.—Influence of the sample size (in chromosomes)
on the standard deviation of the ln RV test statistic. Standard A total of 10,000 microsatellite loci were simulated for two populations.t, time (in 2Ne) since the expansion;f, factor by
deviations were measured on 10,000 independently simulated
TABLE 8
Mean ln RV values of computer simulations with one population experiencing admixture from a third population
(variance of ln RV over 1000 loci)
Proportion of admixture
⌰ 0 0.05 0.10 0.25
5 0.04* 0.22* 0.28* 0.45*
(1.57) (1.20) (1.37) (1.48)
20 0.47* 0.72* 1.08*
(1.48) (1.17) (1.46)
2 0.11* 0.14* 0.18*
(1.43) (1.39) (1.33)
⌰of the two test populations was set to 5, while⌰from the source population from which admixture occurred was varied. Simulations were based on 100 chromosomes per population. *P⬎0.3, no deviation from normal distribution by Kolmo-gorov-Smirnov and tail tests.
identify genomic regions that were involved in adapta-tion processes in the two groups. Using the ln RV test statistic, it should be possible to identify some candidate regions bearing an adaptive mutation. In this report I used a data set consisting of 94 microsatellite loci, which were typed in 10 human populations, 2 African and 8 non-African. To apply the ln RV test statistic, I averaged the observed variances in repeat number in the non-African and non-African groups for each locus. The distribu-tion of the ln RV values of the 94 microsatellite loci followed a Gaussian distribution (Kolmogorov-Smirnov test,P⫽0.94). Out of the 94 loci analyzed, 4 loci had a ln RV value located outside the 95% confidence interval. Two loci had more variation in the non-African popula-tions than expected by the level of variation detected
Figure3.—Allele frequency distribution at the two microsa-in African populations (D10S249,P ⫽ 0.002; D6S305, tellite loci with the most extreme ln RV values in African and P⫽0.023). Microsatellite loci D6S462 (P⫽0.007) and non-African populations. ( ) Africa, (䊏) non-Africa. D10S197 (P⫽0.018) had a reduced variability in
non-African populations. Because the number of outliers is
fully consistent with the neutral expectations, I evalu- multiple pairs of independent populations are com-ated the allele distribution of the two loci, which showed pared, neutral outliers are expected to be confined to the strongest deviation from the remainder of the ge- one comparison, but selected loci should be significant nome (D10S249 and D6S462). Figure 3 shows the allele in all comparisons. Despite that neither African nor distribution of both loci in the pooled African and non- non-African populations are independent, I compared African populations. Consistent with expectations un- all African populations against each non-African popu-der the selective sweep hypothesis, each locus showed lation. In 16 pairwise comparisons of 94 microsatellite a strongly peaked allele distribution in the population loci, 72 significant outliers were marked by the ln RV with reduced variability, while the other population had test. The probability of observing x significant ln RV a scattered allele distribution. tests for a given locus could be calculated by a binomial Until now, populations were jointly analyzed as Afri- distribution. Loci D6S462 and D10S249 were significant can or non-African groups. An alternative approach for in 9 and 16 comparisons, respectively, which would be the identification of loci that differ between African and extremely unlikely in 16 independent comparisons (P⬍ non-African populations would be to make individual 0.0000001). While thePvalues should not be taken at comparisons of all African against all non-African popu- face value, given that the comparisons were not indepen-lations. Even under neutrality, 5% of the loci will be dent, Figure 4 clearly indicates that both loci are
at a genomic region may be detected by a deviation from the remainder of the genome. Computer simula-tions have been used to study population expansion, bottlenecks, and admixture. Two different aspects of the ln RV test were examined under those demographic scenarios: first, whether ln RV remains normally distrib-uted, and second, the power of the ln RV statistic.
Distribution of ln RV:For some extreme demographic events, such as a recent and strong bottleneck, ln RV is no longer normally distributed (Table 6). This deviation is caused by a large number of microsatellite loci, which have lost almost all variability. It is obvious, however, that a data set containing a large number of loci with no or very little variability cannot be informative to infer a recent selective sweep at one or a few loci by the reduction in variability. Therefore, I do not consider this deviation as a major limitation for the application of the ln RV test. More serious is the deviation from normality that was observed for an old population
Figure 4.—Frequency distribution of the number of sig- expansion for highly variable loci (large ⌰). While a
nificant (P⬍0.05) pairwise comparisons for all possible com- larger sample size could solve this problem, these simu-parisons of African and non-African populations.
lations indicated that it may be advisable to test the obtained ln RV values for normality before applying the ln RV test.
DISCUSSION
Overall, the distribution of ln RV values could be The interpretation of natural variability has been of approximated by a normal distribution for most of the long-standing interest in population genetics. Natural parameters of the demographic scenarios considered, variability at a given locus is governed by various factors: suggesting that the ln RV test could also be applied for mutation rate, effective population size, historic sam- a wider range of demographic events than just constant pling, population demography, and selection. Any at- population sizes.
tempt to identify targets of selection in the genome In this article I did not consider the effect of popula-is challenged by the need to account for the pattern tion substructure within each of the two populations expected under neutrality. In principle, each site in the compared. While further computer simulations are re-genome may have its own specific neutral mutation rate. quired to determine influence of population structure On the other hand, effective population size, demo- on the distribution of ln RV values, it has to be noted graphic history, and historic sampling variation are that the effective population sizes can be determined shared across sites (at least for autosomes). Hence, it for any hierarchical level of population structure ( Ches-would be desirable to have a joint estimator of the pa- ser et al.1993). As under neutrality all autosomal loci rameters common to all loci and to adjust for differences have the same effective population size, the ln RV test in mutation rate. statistic is most likely not affected by population
sub-The central variable of the new test statistic is ln RV. structure.
puter simulations of the joint effects of selection and a thermore, a comparison of the allele distribution will also be informative (see below).
given demographic event. While this may lead to slightly
different power estimates, the overall picture is unlikely The ln RV test statistic uses the mean and standard deviation of the observed ln RV values to identify those to be affected.
For all parameters evaluated population expansion loci that deviate from the remainder of the genome. The probability for each locus to deviate from the expec-resulted in a more narrow distribution of ln RV values
(Table 7), suggesting a higher statistical power to detect tation can be directly inferred from the density function of the normal distribution. A larger number of loci local selective sweeps in growing populations.
Admix-ture from a distantly related population (not included results in a more accurate estimate of the mean and standard deviation, but also a larger number of loci with in the analysis) increases variability at all loci, resulting
in a broader distribution of ln RV values (Table 8). ln RV values located in the tail of the normal distribu-tion. A generally accepted solution to this problem is Hence, admixture reduces the power of the ln RV test
statistic. The effect of bottlenecks was less clear. For the use of a smaller␣-value, which reduces the number of false positives. Hence, the identification of loci sub-high⌰-values a bottleneck consistently resulted in a lower
variance of ln RV when compared to a constant popula- jected to selection becomes more difficult and the type 2 error increases. Computer simulations indicated that tion size. Simulations based on intermediate ⌰-values
showed an increased variance of ln RV for very recent even an␣-value of 0.05 results in a considerable type 2 error (Tables 3 and 4). A more practical approach is bottlenecks only (Table 6).
Limitations of the ln RV test statistic: Historic sam- to use the ln RV test statistic as a first pass analysis for the identification of candidate regions. Whether or not pling is an important source of fluctuating variability in
the genome. The ln RV test statistic uses the ratio of the an identified region has been subject to a selective sweep could then be further investigated by the analysis of observed variability at a given locus in two populations.
Given that both populations are subjected to historic flanking microsatellite loci, which are also expected to show the signature of a selective sweep (Wiehe1998). sampling, the ln RV test statistic has a considerable
vari-ability determined by historic sampling. The computer Also, sequence analysis at the candidate locus could provide further evidence for a selective sweep when simulations assumed two completely unrelated
popula-tions, which maximizes the variation in ln RV due to test statistics specific for sequence polymorphism are applied (Otto2000). Additional evidence for a selec-historic sampling. Hence, less pronounced selective
sweeps are very difficult to identify. This is reflected by tive sweep could be obtained from those loci that have already recovered some variability after the sweep. The the requirement of a strong recent reduction in
variabil-ity to identify a selected locus with the ln RV test statistic. allele distribution of a locus that starts accumulating variation after the fixation of a single allele is strongly One possible approach to improve the power of the ln
RV test statistic would be the comparison of two closely peaked. The more mutations occurred after the fixa-tion, the broader the distribution becomes, until the related populations. Closely related populations share
a large fraction of their genealogy at each locus; hence, random loss of alleles decays the single peaked distribu-tion. Hence, after a sweep, the allele spectrum should the variance of ln RV is expected to be significantly
smaller than for distantly related populations. Thus, loci be tighter than in nonsweep populations. Following the same rationale, multilocus test statistics based on the that have been exposed to a different selection regime
in the two closely related populations should be easier allele frequency distribution have been suggested to infer population size changes (Beaumont1999;Reich to detect than in a comparison of two distantly related
populations. Nevertheless, further simulation studies et al.1999;Garza andWilliamson2001). The power of an allele frequency distribution for a single locus, are required to verify the behavior of the ln RV test
statistic for closely related populations or populations however, is generally weak and could only be used as confirmatory evidence.
connected by gene flow.
The ln RV test statistic makes the important assump- Finally, the analysis of independent pairs of popula-tions could serve as an additional tool for the verification tion of constant mutation rates across populations. This
assumption could be easily violated given the strong of an identified deviation from neutral expectations. While outliers are expected to occur in a single compari-correlation between microsatellite mutation rate and
repeat number (Schlo¨ tterer et al. 1998; Harr and son only, selected loci should be detected in most of the pairwise comparisons. Assuming independence among Schlo¨ tterer2000). Furthermore, interruptions in the
microsatellite repeat also reduce microsatellite muta- the populations the probability of observing multiple significant tests could be tested on the basis of the bino-tion rates (Weber1990). If the two populations differ
in the average repeat number or an interruption in the mial distribution. In reality, however, populations are rarely independent, as they share a common history. repeat structure is more frequent in one population
than in the other, this could result in a significant ln Nevertheless, our analysis indicated that most of the significant ln RV tests between African and non-African RV test statistic. Experimental evidence, such as
compari-sons only. Out of 19 loci for which a significant ln RV (GDB) search did not indicate known genes mapping to D6S462. Further analysis has to await the progress of test was recorded, 11 loci were found to be significant
in 1 or 2 comparisons only. While it is impossible to the analysis of the human genome.
In contrast to the expectations for a selection event rule out that some form of local selection has acted on
those loci, the more likely explanation is that they are associated with the human habitat expansion out of Africa, the locus that deviates most from the remainder false positives. In any case, out of 16 tests the two
candi-date loci D6S462 and D10S249 had a significant ln RV of the genome, D10S249, harbored a surplus of variabil-ity in non-African populations. Based on the allele spec-value in 9 and 16 comparisons, respectively.
Much of the theory of the ln RV test is based on the trum at locus D10S249 (Figure 3), it is very likely that this locus has been subjected to a recent selective sweep. variance in repeat number at mutation drift
equilib-rium. While the high mutation rate of microsatellites A BLAST search of the human subset of GenBank failed to identify locus D10S249 in the published draft of the requires less time to reach mutation drift equilibrium,
most natural populations are not expected to meet this human genome sequence. Thus, no information about flanking sequences is available. A GDB search indicated condition. Computer simulations indicated that the
nor-mal distribution of ln RV seems to be quite robust to that locus D10S249 is located in the amplimer AFM207-wd12. The gene mapping closest to microsatellite D10-demographic events. Furthermore, no deviation from
normality could be detected for the ln RV values of S249 is called Severe Combined Immunodeficiency, Athabaskan type (SCIDA), a genomic region associated human populations. Further studies, in particular
ex-perimental ones with a large number of loci analyzed, with both T-cell and B-cell immunity (Murphy and Stringer1986). V(D)J recombination, which accounts will provide further insight into the behavior of the ln
RV test statistic in natural populations. for the diversity of T-cell receptor and immunoglobulin-encoding genes, is initiated by a specific double-strand Genomic regions associated with selective sweeps in
human populations:The simple model of out-of-Africa- break. The general DNA repair machinery is responsible for the resolution of this break. Previously, it was shown associated adaptive mutations would have predicted
more loci with significantly reduced variability in non- that an essential DNA repair/V(D)J recombination gene lies in the same region as SCIDA (Moshouset al. African populations than in African populations. In the
human data set of 94 microsatellite loci, however, the 2000). While it remains purely speculative until further proof (which will become feasible with the availability same numbers of outliers were observed on both sides
of the ln RV distribution. of the genomic sequence of this region), it is conceiv-able that a gene involved in immune defense is a poten-Locus D6S462 showed the strongest reduction in
vari-ability in the non-African populations, suggesting that tial target for adaptive mutations. Populations are con-stantly challenged by pathogen pressure and one way this locus may have been linked to a genomic region that
has swept in non-African populations. The approach to counter this pressure is the acquisition of novel muta-tions to control pathogens.
to combining populations in African and non-African
groups requires a consistently low level of variation Perspective: The introduced test statistic provides a means to search multilocus data to identify those loci across populations to result in a significant ln RV value.
A separate analysis of the eight non-African populations that show a deviation from neutral expectations in one population (group). Given the inherent problem of a against the pooled African populations indicated that
multilocus test statistic and the high type 2 error of the each of the non-African populations had a reduced
vari-ln RV test statistic, it is obvious that loci identified as ability at locus D6S462 (P⬍0.065, one-sided test). Given
outliers by the ln RV test are no final proof of selection, that the eight non-African populations covered a wide
but could serve as a starting point for subsequent range of human diversity outside of Africa, the strong
studies. reduction in variability in the non-African populations
is best explained by a selection event that coincided I am particularly grateful to K. Kidd for making the data public on with the colonization. Further evidence for a recent the web. Many thanks go to the C.S. lab, C. Haley, and R. R. Hudson for helpful discussions. R. Harding, B. Harr, M. van Staaden, and G.
selective sweep at D6S462 could be gleaned from the
Muir provided comments on the manuscript. Special thanks to T.
allele distribution. While the African population showed
Wiehe for pointing out the glitches of the expectation of the ratio
a scattered allele distribution, the non-African popula- of two random variables. R. Bu¨ rger is acknowledged for his help in tions had a highly peaked allele distribution (Figure 3), approximating the expectation of the ratio of two random variables. Three anonymous reviewers provided helpful comments, which
im-a pim-attern thim-at would be expected for im-an im-allele thim-at him-as
proved the manuscript. W. Schlo¨tterer helped with the C code. C.S.
swept through the population and is starting to
accumu-is supported by grants from the Fonds zur Fo¨rderung der waccumu-issenschaf-
wissenschaf-late new mutations.
tlichen Forschung (FWF).
The recently published draft of the human genome (International Human Genome Sequencing
Con-sortium 2001; Venter et al. 2001) could potentially LITERATURE CITED indicate genes flanking the two candidate regions.
Andolfatto, P., J. D. WallandM. Kreitman, 1999 Unusual
haplo-While for D6S462 several flanking expressed sequence type structure at the proximal breakpoint ofIn(2L)tin a natural
population ofDrosophila melanogaster.Genetics153:1297–1311.
profile. Theor. Popul. Biol.8:318–330. using microsatellites. Genetics153:2013–2029.
Beaumont, M. A., andR. A. Nichols, 1996 Evaluating loci for use Moshous, D., L. Li, R. Chasseval, N. Philippe, N. Jabadoet al., 2000 A new gene involved in DNA double-strand break repair in genetic analysis of population structure. Proc. R. Soc. Lond.
Ser. B263:1619–1626. and V(D)J recombination is located on human chromosome 10p. Hum. Mol. Genet.9:583–588.
Bowcock, A. M., J. R. Kidd, J. L. Mountain, J. M. Hebert, L.
Caro-tenutoet al.1991 Drift, admixture, and selection in human Murphy, K. E., andJ. R. Stringer, 1986 RecA independent recom-bination of poly[d(GT)-d(CA)] in pBR322. Nucleic Acids Res. evolution: a study with DNA polymorphisms. Proc. Natl. Acad.
Sci. USA88:839–843. 14:7325–7340.
Nei, M., andT. Maruyama, 1975 Letters to the editors:
Lewontin-Brinkmann, B., M. Klintschar, F. Neuhuber, J. HuhneandB. Rolf,
1998 Mutation rate in human microsatellites: influence of the Krakauer test for neutral genes. Genetics80:395.
Ohta, T., andM. Kimura, 1973 A model of mutation appropriate structure and length of the tandem repeat. Am. J. Hum. Genet.
62:1408–1415. to estimate the number of electrophoretically detectable alleles in a finite population. Genet. Res.22:201–204.
Cavalli-Sforza, L., 1966 Population structure and human
evolu-tion. Proc. R. Soc. Lond. Ser. B164:362–379. Otto, S. P., 2000 Detecting the form of selection from DNA se-quence data. Trends Genet.16:526–529.
Chesser, R. K., O. E. Rhodes, D. W. SuggandA. Schnabel, 1993
Effective size for subdivided populations. Genetics135: 1221– Pritchard, J. K., andM. W. Feldman, 1998 A test for heterogeneity of microsatellite variation, pp. 47–56, inProceedings of the
Trina-1232.
Depaulis, F., 1998 Neutrality tests based on the distribution of hap- tional Workshop on Molecular Evolution, edited byM. K. Uyenoyama
andA. von Haeseler. Duke University Publications Group, Dur-lotypes under an infinite-site model. Mol. Biol. Evol.15:1788–
1790. ham, NC.
Pritchard, J. K., M. StephensandP. Donnelly, 2000 Inference
Di Rienzo, A., A. C. Peterson, J. C. Garza, A. M. Valdes, M. Slatkin
et al., 1994 Mutational processes of simple-sequence repeat loci of population structure using multilocus genotype data. Genetics
155:945–959. in human populations. Proc. Natl. Acad. Sci. USA91:3166–3170.
Di Rienzo, A., P. Donnelly, C. Toomajian, B. Sisk, A. Hillet al. Reich, D. E., M. W. FeldmanandD. B. Goldstein, 1999 Statistical properties of two tests that use multilocus data sets to detect 1998 Heterogeneity of microsatellite mutations within and
be-tween loci and implications for human demographic histories. population expansions. Mol. Biol. Evol.16:453–466.
Robertson, A., 1975 Remarks on the Lewontin-Krakauer test. Ge-Genetics148:1269–1284.
Garza, J. C., andE. G. Williamson, 2001 Detection of reduction netics80:396.
Schlo¨ tterer, C., and T. Wiehe, 1999 Microsatellites, a neutral in population size using data from microsatellite loci. Mol. Ecol.
marker to infer selective sweeps, pp. 238–248 inMicrosatellites— 10:305–318.
Evolution and Applications, edited byD. GoldsteinandC. Schlo¨ t-Goldstein, D. B., A. Ruiz Lineares, L. L. Cavalli-SforzaandM. W.
terer. Oxford University Press, Oxford.
Feldman1995 An evaluation of genetic distances for use with
Schlo¨ tterer, C., C. VoglandD. Tautz, 1997 Polymorphism and microsatellite loci. Genetics139:463–471.
locus-specific effects on polymorphism at microsatellite loci in
Goldstein, D. B., L. A. Zhivotovsky, K. Nayar, A. Ruiz Lineares,
natural Drosophila melanogasterpopulations. Genetics146:309–
L. L. Cavalli-Sforza et al.1996 Statistical properties of the
320. variation at linked microsatellite loci: implications for the history
Schlo¨ tterer, C., R. Ritter, B. HarrandG. Brem, 1998 High of human Y chromosomes. Mol. Biol. Evol.13:1213–1218.
mutation rates of a long microsatellite allele inDrosophila
melano-Harr, B., andC. Schlo¨ tterer, 2000 Long microsatellite alleles in
gaster provide evidence for allele-specific mutation rates. Mol.
Drosophila melanogasterhave a downward mutation bias and short
Biol. Evol.15:1269–1274. persistence times, which cause their genome-wide
underrepresen-Slatkin, M., 1995a Hitchhiking and associative overdominance at tation. Genetics155:1213–1220.
a microsatellite locus. Mol. Biol. Evol.12:473–480.
Harr, B., B. Zangerl, G. BremandC. Schlo¨ tterer, 1998
Conser-Slatkin, M., 1995b A measure of population subdivision based on vation of locus specific microsatellite variability across species: a
microsatellite allele frequencies. Genetics139:457–462. comparison of twoDrosophilasibling speciesD. melanogasterand
Tsakas, S., andC. B. Krimbas, 1976 Testing the heterogeneity of
D. simulans.Mol. Biol. Evol.15:176–184.
Fvalues: a suggestion and a correction. Genetics84:399–401.
Hudson, R. R., 1990 Gene geneologies and the coalescent process.
Venter, J. C., M. D. Adams, E. W. Myers, P. W. Li, R. J. Muralet
Oxf. Surv. Evol. Biol.7:1–44.
al., 2001 The sequence of the human genome. Science291:
International Human Genome Sequencing Consortium, 2001
1304–1351. Initial sequencing and analysis of the human genome. Nature
Vieira, J.,andB. Charlesworth, 2000 Evidence for selection at
406:860–921. the
fusedlocus ofDrosophila virilis.Genetics155:1701–1709.
Jorde, L. B., M. BamshamandA. R. Rogers, 1998 Using
mitochon-Vitalis, R., K. DawsonandP. Boursot, 2001 Interpretation of drial and nuclear DNA markers to reconstruct human evolution. variation across marker loci as evidence of selection. Genetics BioEssays20:126–136. 158:1811–1823.
Kohn, M. H., H. J. PelzandR. K. Wayne, 2000 Natural selection Weber, J. L., 1990 Informativeness of human (dC-dA)
n·(dG-dT)n
mapping of the warfarin-resistance gene. Proc. Natl. Acad. Sci. polymorphisms. Genomics7:524–530.
USA97:7911–7915. Wiehe, T., 1998 The effect of selective sweeps on the variance of
Lewontin, R. C., andJ. Krakauer, 1973 Distribution of gene fre- the allele distribution of a linked multi-allele locus-hitchhiking quency as a test of the theory of the selective neutrality of polymor- of microsatellites. Theor. Popul. Biol.53:272–283.
phisms. Genetics74:175–195. Wierdl, M., M. DominskaandT. D. Petes, 1997 Microsatellite
Lynch, M., andB. Walsh, 1998 Genetics and Analysis of Quantitative instability in yeast: dependence on the length of the microsatel-Traits.Sinauer Associates, Sunderland, MA. lite. Genetics146:769–779.
Maynard Smith, J., andJ. Haigh, 1974 The hitch-hiking effect of