ABSTRACT
SKIDMORE, MATTHEW BRIAN. Predicting and Improving the Dewaterability of Waste Activated Sludge Through Moisture Distribution Analysis. (Under the Direction of Francis L. de los Reyes III).
The dewatering of waste activated sludge is one of the most costly and least understood
operations in wastewater treatment. While much effort has been put into streamlining
operation of sludge dewatering equipment to maximize moisture removal, until recently,
little attention was paid to the water within sludge. Sludge water molecules can be
subdivided into several categories according to various properties with efforts made to
convert sludge water from one category to another with the goal of making it easier to
remove. This thesis tests two different ideas. First, that a dewaterability prediction test can
be developed that is based on the distribution of moisture within activated sludge. Second,
that sludge water can be converted from one form to another thereby improving sludge
dewatering.
A centrifugal dewatering test was developed based on the idea that as centrifugal forces
approach infinity, all of the free, or easily removable, water is withdrawn leaving only bound
water. The centrifugal dewatering test consisted of centrifuging a 24-ml sample of waste
activated sludge at ~150,000 x g for 30 minutes. Following centrifugation, the samples were
inverted and supernatant was removed. The water remaining in the pellet was considered to
be the bound water and represented the portion of sludge water that cannot be removed by
mechanical dewatering equipment. Comparisons were made between the centrifugal
dewatering test and full-scale wastewater treatment plant data. Significant positive
involved in the study. The tests value is that it could be used to predict trends in sludge
dewaterability in advance of solids handling equipment. The purpose of developing the test
was to demonstrate that investigations into sludge dewatering operations should include the
entire wastewater treatment process, as well as, solids handling equipment.
The second part examines the idea that sludge moisture present as bound water can be
converted to free water thereby improving the dewatering process. It was hypothesized that
an input of disruptive energy could change the distribution of moisture within activated
sludge. Heat treatment (40, 60, and 80°C), sonication, alkaline treatment, and cation addition
were each evaluated alone, and in combination, for their ability to alter moisture distribution.
Results indicated that only sonication, both alone and combined with cation addition, led to
increased dewaterability and compactibility, as well as, decreased bound water. Cation
Predicting and Improving the Dewaterability of
Waste Activated Sludge Through Moisture
Distribution Analysis
by
MATTHEW BRIAN SKIDMORE
A thesis submitted to the Graduate Faculty of North Carolina State University in partial fulfillment of the requirements for the Degree of Master of Science
Civil Engineering
Raleigh 2005
APPROVED BY:
______________________________
Dr. Francis L.de los Reyes III Chair of Advisory Committee
______________________________ ______________________________
BIOGRAPHY
Matthew Brian Skidmore was born April 14, 1975 (same day in history that the Titanic sank
and Abraham Lincoln was shot). He grew up in Wheaton, MD before his family moved one
hour north to Finksburg, MD prior to high school. Matthew, or Matt, as most people call
him, was never an ideal student. He was often in trouble, spent many days in detention and
was suspended on more than one occasion for disciplinary reasons. He was a constant fixture
in the Principal’s office. Upon graduating from Westminster Senior High School, he was
surprised to discover he was accepted to Towson University in Towson, MD (the only school
he applied to). Being an avid drummer, he decided to study music education but soon soured
on the idea of teaching. As a sophomore, he changed his educational focus to environmental
science and quickly discovered that he not only liked the subject, but excelled at it. After his
sophomore year, he transferred to the University of Maryland at College Park to pursue a
Bachelors degree in natural resources management (where he met his future wife Lori).
After a surprisingly fast two and a half years he graduated with a BS in natural resources
management, concentration in plant and wildlife management. After getting hitched in 1999,
Matt and Lori decided to move to Cary, NC since neither one really enjoyed life in the
Washington DC metropolitan area. Matt accepted a job working for the soil science
department at North Carolina State University while Lori accepted a consulting job paying
twice as much. Since Matt worked for NC State University he was able to take courses for
free. He soon tired of the work he did for the University. While it was rewarding in its own
way, it never really challenged him and he knew he could do better. Therefore in 2000, he
complete, he joined the research group of Francis L. de los Reyes III to earn his Masters
degree. Matt and Lori currently live in Cary, NC where they have no children, but one crazy
part German Shepherd, part Siberian Husky, part something else mutt named Tybalt. Matt is
currently working for ARCADIS, a consulting firm in the Durham, NC area where he hopes
to make enough money to send Lori back to school to earn her PhD. After 9.5 years of
college experience Matt is finally ready to call it quits and cheer on Lori whom he wises the
TABLE OF CONTENTS
List of Tables . . . vi
List of Figures. . . . vii
Chapter 1. Introduction and Literature Review . . . . 1
Chapter 2 Centrifugal Dewatering Test: Development and Correlation to Full-Scale Plant Dewatering Performance ABSTRACT . . . 15
2.1 INTRODUCTION . . . 15
2.2 METHODS . . . 19
2.2.1 Centrifuge . . . 19
2.2.2 Samples . . . 19
2.2.3 Test procedure . . . 22
2.2.4 Correlations . . . 22
2.3 RESULTS AND DISCUSSION . . . . 22
2.3.1 Test Development . . . 22
2.3.2 Test Verification . . . 24
2.4 CONCLUSIONS . . . 31
Chapter 3 Disruption of Cellular and Floc Structures to Improve Dewaterability of Activated Sludge Through Changes to Moisture Distribution – Theory and Application ABSTRACT . . . 33
3.1 INTRODUCTION . . . 34
3.2 METHODS . . . 39
3.2.2 Samples . . . 39
3.2.3 Disruption . . . 39
3.2.4 Disruption Measurements . . . 40
3.2.5 Cation Addition . . . 42
3.2.6 Bound Water . . . 43
3.2.7 Dewaterability . . . 46
3.2.8 Compactibility. . . 47
3.2.9 Time-to-Filter . . . 47
3.3 RESULTS AND DISCUSSION . . . . 48
3.3.1 Alkaline Treatment . . . 48
3.3.2 Heat Treatment . . . 50
3.3.6 Combination Study – Sonication and Cation Addition . 76
3.4 CONCLUSIONS . . . 80
REREFENCES . . . 83
APPENDIX 1 . . . 90
List of Tables
Table 1.1. Methods for measuring bound water in activated sludge systems. References are for method use in activated sludge systems only . 7
Table 2.1. Characteristics of wastewater treatment plants participating
in dewatering study . . . 21
Table 2.2. Results of centrifugal dewatering test and plant dewatering
performance. Averaged over two-month period . . . 30
Table 3.1. Dilatometry calculations for bound water measurement . . 45 Table 3.2. Summary of results following heat treatment for 120 minutes . 57 Table 3.3. Summary of results following sonication for 60 seconds . . 65
List of Figures
Figure 1.1. Disposal cost by landfilling as a function of dewatered cake solids 2 Figure 1. 2. Thermal drying energy cost as function of dewatered cake solids 2 Figure 1.3. Layering of water molecules following surface attachment.
Figure taken from Pollack (2001) . . . 6
Figure1.4 Visual presentation of four categories of sludge water as defined
by Vesilind (1994) . . . 11
Figure 2.1. Preliminary results of centrifugal dewatering test Effects of
centrifugal force on dewaterability . . . 23
Figure 2.2, McDowell Creek wastewater treatment plant. Correlation of
centrifugal dewatering test . . . 25
Figure 2.3, James A. Loughlin wastewater treatment plant, correlation of
centrifugal dewatering test . . . 25
Figure 2.4, South Cary water reclamation facility, correlation of
centrifugal dewatering test . . . 26
Figure 2.5, Town Creek wastewater treatment plant, correlation of
centrifugal dewatering test . . . 26
Figure 2.6, Neuse River wastewater treatment plant, correlation of
centrifugal dewatering test . . . 27
Figure 2.7, Archie Elledge wastewater treatment plant, correlation of
centrifugal dewatering test . . . 27
Figure 2.8, North Cary wastewater reclamation facility, correlation of
centrifugal dewatering test . . . 28
Figure 2.9, South Durham wastewater reclamation facility, correlation of
centrifugal dewatering test . . . 28
Figure 3.1. Dilatometers used in study . . . 44
Figure 3.2. Soluble protein release due to alkali treatment . . . 48 Figure 3.3. Compactibility test – Alkali treatment (error bars represent
one standard deviation) . . . 49
Figure 3.4. Disruption due to heat treatment as measured by soluble
protein analysis . . . 50
Figure 3.5. Increased cell lysis due to heat treatment as measured by
LIVE/DEAD imaging . . . 51
Figure 3.6. Time-to-filter values resulting from heat treatment . . 53
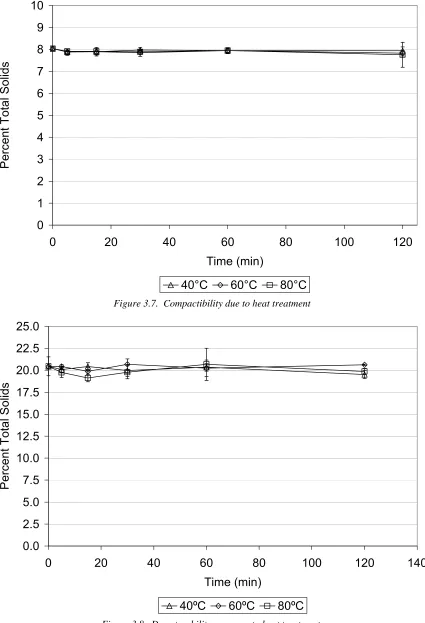
Figure 3.7. Compactibility due to heat treatment . . . . 54
Figure 3.8. Dewaterability response to heat treatment . . . 54
Figure 3.9. Bound water response to heat treatment as measured by
Dilatometry . . . 55
Figure 3.10. Disruption due to sonication as measured by soluble
protein analysis . . . 59
Figure 3.11. Cell lysis due to sonication as measured by LIVE/DEAD
Figure 3.12. Time-to-filter results from sonication . . . . 61 Figure 3.13. Compactibility results following sonication. Error bars
represent one standard deviation . . . 62
Figure 3.14. Dewaterability results following sonication. Error bars
represent one standard deviation . . . 63
Figure 3.15. Bound water content following sonication. Error bars
represent one standard deviation . . . 64
Figure 3.16. Time-to-Filter results following cation addition. Error
bars represent one standard deviation . . . 67
Figure 3.17. Compactibility following cation addition. Error bars
represent one standard deviation . . . 68
Figure 3.18. Dewaterability following cation addition. Error bars
represent one standard deviation . . . 69
Figure 3.19. Change in bound water content following cation addition.
Error bars represent one standard deviation . . . . 69
Figure 3.20, Compactibility measurements, heat treatment combined
with sodium addition . . . 73
Figure 3.21, Compactibility measurements, heat treatment combined
with magnesium addition . . . 73
Figure 3.22, Compactibility measurements, heat treatment combined
with iron addition . . . 74
Figure 3.23. Bound water results, heat treatment combined with
cation addition . . . 75
Figure 3.24. Dewaterability measurement, sonication combined
with sodium addition . . . 77
Figure 3.25. Dewaterability measurement, sonication combined
with magnesium addition . . . 77
Figure 3.26. Dewaterability measurements, sonication combined
with iron addition . . . 78
Figure 3.27. Bound water results, sonication combined with
Chapter 1. Introduction and Literature Review
There are generally two end-products associated with the treatment of domestic wastewater;
effluent, which is released into a receiving body of water, and waste sludge, which is treated
for pathogen reduction and removal of excess moisture prior to final disposal. Sludge
disposal is one of the most costly aspects of wastewater treatment. The estimated cost of
sludge handling facilities is approximately 30-40% of the total investment in wastewater
treatment facilities (NRC, 2002). Furthermore, operating costs associated with sludge
dewatering equipment can represent as much as 50% of a facility’s operating and
maintenance costs (NRC, 2002).
Waste sludge is a mixture of organic, inorganic, and dissolved solids contained in a slurry
that may be anywhere from three to fifty percent solid material (following thickening and
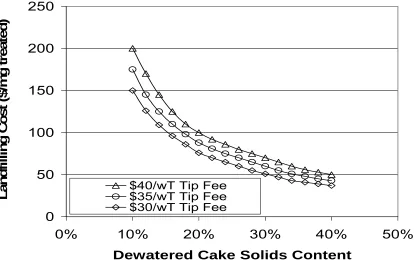
dewatering). Sludge is commonly disposed of by incineration, landfilling, or application to
cropland. Whichever method is chosen, the cost of disposal is a function of the water content
of the sludge. In the case of landfilling or land-application, the cost is usually based on the
volume of sludge to be disposed. Removing as much water as feasible reduces the sludge
volume and subsequent cost. In the case of incineration, the presence of excess moisture will
require an expenditure of energy for evaporation. The more water that is removed in prior
steps, the lower the energy input will be. Figures 1.1 and 1.2 (data provided by C. Michael
Bullard of Hazen and Sawyer, personal communication, July 2003) show the disposal costs
0 50 100 150 200 250
0% 10% 20% 30% 40% 50%
Dewatered Cake Solids Content
L a n d fillin g C o s t ( $ /m g t re a te d )
$40/wT Tip Fee $35/wT Tip Fee $30/wT Tip Fee
Figure 1.1. Disposal cost by landfilling as a function of dewatered cake solids.
0 20 40 60 80 100 120 140
0% 10% 20% 30% 40% 50%
Dewatered Cake Solids Content
Since removal of excess moisture in sludge can lead to considerable reductions in disposal
costs, sludge dewatering has become a highly important operation for many wastewater
treatment plants looking to reduce financial costs.
With the high cost of solids disposal, many wastewater treatment facilities have invested time
and money in the sludge dewatering process. Many wastewater treatment plants have
installed mechanical dewatering equipment to remove excess moisture from sludge. Sludge
polymer has become widely used for its ability to increase water removal efficiency.
Polymer itself does not remove water, but when combined with mechanical dewatering
equipment has been shown to improve sludge dewatering processes (Spellman, 1997).
Belt-filter presses (BFP) consist of a series of rollers and belts where the sludge is squeezed
between the belts and the rollers, expelling moisture. Centrifuges apply centrifugal force to
the sludge by rotating at high speeds separating solid material from liquid based on density.
Plate-and-frame presses rely on the pressure of two plates squeezing a volume of sludge in
between the plates, and where excess moisture is pushed through a filter on one plate. Each
of these methods relies on the application of pressure to separate water and solid matter.
Previous researchers have noted that dewatering activated sludge can be difficult.(Chen et al.,
1996; Erdincler and Vesilind, 2000; Katsiri and Kouzeli-Katsiri, 1987; Vaxelaire and Cezac,
2004). The relationship between solid matter and water molecules is thought to control the
dewaterability of activated sludge. Several properties of activated sludge make it difficult to
dewater. Li and Ganczarczyk (1990) noted highly porous fractal-like structures in the
structures difficult to remove due to strong attractive forces between solids and water
molecules. These forces between solids and water molecules divide sludge water into
different categories based on ease of removal from the sludge matrix. At its most basic level
water is split into free water and bound water. While free water is generally thought to be
easily removed from activated sludge, bound water is considered to be the portion of water
that remains and is not removed, even under high pressures produced by mechanical
dewatering equipment. Correlations between bound water content and sludge dewaterability
have been made (Smollen, 1990). Katsiris and Kouzeli-Katsiri (1987) showed that increased
bound water content led to decreases in sludge dewaterability.
The role of the sludge in dewatering has only recently begun to draw attention. Evidence
that the sludge itself plays a role in dewatering can be seen in the recent study by Leonard et
al (2004). The researchers subjected different sludges to identical drying conditions and saw
that different sludges had different drying rates despite being nearly identical in all other
aspects. Numerous sludge properties have been shown to influence the dewaterability of
sludge. Properties identified include sludge pH, volatile to fixed solids ratio, septicity,
sludge viscosity, compressibility, sludge particle size, and sludge surface charge (Spellman,
1997). Jin et al. (2004) showed that physical properties of sludge (flocculating ability,
surface charge, hydrophobicity, and viscosity) were most important in terms of dewatering
sludge while morphological properties (fractal dimension and filament index) had small
impact on sludge dewaterability. Liao et al (2000) used bench scale reactors and saw that
(1994A) also noted a correlation between bound water content and floc structure in both
filamentous and non-filamentous sludges.
While extensive evidence points to the existence of bound water within activated sludge,
there is uncertainty about how bound water arises. Several theories have been put forth
which describe bound water as a system of layered water molecules closely spaced and
arranged by their polar ends. It is thought that this layering is what gives bound water its
unique properties. Szent-Gyorgyi (1957) suggested that in the presence of solids, liquid
molecules layer themselves. He described the layered molecules as “ice-like” in structure
and physical behavior. While “ice-like” may be an incorrect term for describing bound water
in activated sludge, there is evidence that this layering does occur in the presence of solids.
Previous work has shown that layered water can extend from solid surfaces up to 10
molecular diameters into the bulk liquid (Israelahvili and Kott, 1989). Drost-Hansen, (1981)
noted the existence of “interfacial water” near solid surfaces and that this “interfacial water”
had physical properties different from the corresponding properties of the bulk water.
Several researchers have noted changes in both density and viscosity of bound water (Etzler
and Fagundas, 1987; Etzler and Drost-Hansen, 1983). Vesilind (1994) hypothesized that the
layering of water near solid surfaces was due to hydrogen bonding. He thought that surface
interruption of normal water molecule packing led to a compensation where the molecules
arranged themselves in an orderly fashion on the surface. Other researchers have noted the
existence of layered water molecules near solid surfaces in other systems. Pollack (2001)
argued that water molecules arrange themselves into layers based on charge. One molecule
molecules attach based on their polar charge. This phenomenon is shown below in Figure
1.3 which is taken from Pollack (2001).
Figure 1.3. Layering of water molecules following surface attachment. Figure taken from Pollack (2001)
The fact that bound water has unique properties including density, vapor pressure, viscosity,
and freezing point that are each different from bulk water is what has enabled researchers to
measure bound water in activated sludge. Numerous methods have been developed to
measure bound water by relying on its different properties. Several methods for bound water
measurement in activated sludge are listed below in Table 1.1
Table 1.1. Methods for measuring bound water in activated sludge systems. References are for method use in activated sludge systems only.
Method Principle Reference
Dilatometry Bound water does not freeze at temperatures as low as -20C. Bound water content is calculated by measuring the free water based on expansion measurement and subtracting from total water content.
Heukelekian and Weisburg 1956
Differential Scanning Calorimetry
Bound water does not freeze at temperatures as low as -20C Enthalpy absorbed during freezing is proportional to free water and bound water content is calculated by mass balance.
Lee and Lee 1995
Centrifugation As centrifugal force inceases and approaches infinity all free water will be forced out of floc and only bound water will remain. Bound water can be measured through total solids analysis.
Kawasaki et al 1991
Drying Tests Thin layers of sludge are dried at temperature well below boiling point of water. Sludge weight is measured over time and changes in evaporation rate are considered to indicate different fractions of water
Halde 1979
Differential Thermal Analysis
The temperature difference between a sludge sample and a thermally inert material is measured while both are subject to identical heating and cooling. Sharp differences indicate the adsorption or liberation of heat.
Katsiris and Kouzeli-Katsiri 1987
Expression
Test Sludge is exposed to a constant high pressure (30 MPa). Subsequently all removable water is forced out and only bound water remains. Chu and Lee 1999B
Filtration
Measuring bound water is not without its difficulties. In a study comparing different
methods of bound water measurement, Lee and Hsu (1995) concluded that bound water
was an operationally defined value and therefore the measurement method chosen would
dictate the bound water values measured. Robinson and Knocke (1992) also examined
several methods of bound water measurement and concluded the same although they
stated their personal preference for dilatometry due to its more reproducible results and
the fact that it was less prone to error. An issue with bound water measurement is the
absence of a bound water standard with which to calibrate measurements. Without such
a standard, bound water measurements become comparative where the amount of bound
water is measured before and after treatment.
In an attempt to better understand the concept of moisture distribution in sludge,
researchers have expanded the concept of free and bound water with additional
classification schemes. Several more complex classifications of moisture have been put
forth.
Colin and Gazbar (1995) proposed a moisture classification scheme based on the binding
energy of moisture to activated sludge surfaces. The authors measured dilatometric
bound water as a function of mechanical dewatering strain and divided sludge water into
the following categories; (1) Total bound water. (2) Free water – calculated as the
difference between total water and total bound water. (3) Water not removable
Smollen (1988) classified water by the amount of bonding energy holding the water in
place and developed four categories of sludge moisture; (1) Free moisture – loosely
bound to sludge solids, removed by gravitational thickening. (2) Immobilized moisture –
water that is trapped within floc structures, removed by mechanical dewatering. (3)
Bound moisture – water that is adsorbed onto individual particles, removed by thermal
drying. (4) Chemically bound moisture – water that bound through chemical attraction to
solids, removed under high temperature drying.
Kopp and Dichtl (2000) proposed a similar classification system based on physical
bonding of moisture to sludge particles including; (1) Free water – not bound to
particles. (2) Interstitial water – bound by capillary forces to sludge solids. (3) Surface
water – bound by adhesive forces. (4) Intracellular water.
Similarly Moller (1983) proposed the following classifications based on solid and liquid
components; (1) Interspace moisture – minimally bound to solids, removed by draining.
(2) Capillary water – bound by capillary pressure, can be removed by application of
pressure. (3) Adhesion water – intermediately bound to solids, can be removed by
pressure. (4) Adsorption water – intensely bound by ionic double layer, removed
thermally. (5) Internal water – inside of individual particles, must be converted to
Vesilind (1994) argued similarly that four phases of water exist within activated sludge;
(1) Free or bulk water – not confined to floc structures, free to move about sludge matrix.
(2) Interstitial water – trapped within sludge floc, becomes free water when floc structure
is disrupted. (3) Vicinal water – tightly bound layered water attached to solid surface,
remains with solids following floc breakup. (4) Water of hydration – chemically bound
to floc particles, removed through thermal input.
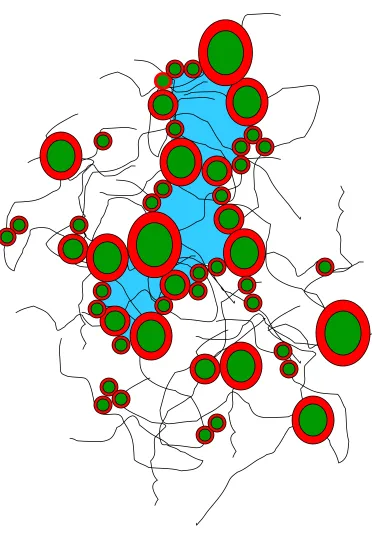
Figure 3.4 shows a visual representation of Vesilind’s four categories of moisture
classification using a simplified 2-dimensional model for a sludge floc particle. Bulk
water can be found all around the floc particle and is free to move towards and away
from the particle. The blue areas represent interstitial water which is constrained within
the floc interior, but is able to move if floc structure is disrupted. The red areas represent
vicinal water which is layered and is held to the floc surface regardless of floc breakup.
The green areas represent the interior structures of floc particles including cells. Water of
hydration is exists within these structures. To simplify nomenclature, the Vesilind (1994)
Figure 1.4 Visual presentation of four categories of sludge water as defined by Vesilind (1994).
Vesilind and Hsu (1997) suggested that bound water actually consisted of water of
bound water contains only vicinal water and water of hydration (Dick and Drainville,
1995). The portions of water removable by mechanical means are also subject to intense
debate. Vesilind (1994) suggests that only the free water and interstitial water can be
removed by mechanical dewatering equipment. Kopp and Dichtl (2001) contend that
only free water is removed by mechanical dewatering equipment.
Research has suggested that bound water can be converted to free water. Katsiri and
Kouzeli-Katsiri (1987) noted a decrease in bound water content with the addition of
chemical coagulants. They hypothesized that coagulant molecules replace water
molecules within bound water. Chu and Lee (1999A) noted that bound water content
decreased with polymer addition until the charge neutralization point was reached and
increased afterwards with the addition of more polymer. They agreed with Smollen
(1990) that excess polymer would adsorb bulk moisture and add to the bound water
content. Erdincler and Vesilind noted an increase in bound water content following heat
treatment, sonication, alkaline treatment, and NaCl treatment. They attributed the
increase to the creation of extra surfaces for bound water formation following disruption.
However, they did suggest that the interstitial water content decreased as a result of floc
disruption.
The idea that bound water can be subdivided different categories and that bound water
can be converted from one form to another have been examined. Vesilind (1994) and
important since this point would represent the maximum theoretical limit of
unconditioned sludge dewaterability. By knowing the maximum dewaterability ahead of
time, one could assess sludge dewaterability not in terms of how much water is removed,
but rather the percentage of free water that is removed. This approach could lead to
different ideas about assessing dewaterability. Currently tests such as specific resistance
to filtration (SRF) and capillary suction time (CST) are used. These tests are used to
measure changes in sludge dewaterability following different treatments. They do not
indicate however the maximum possible dewaterability of that sludge. A study by Chen
et al (1996) showed that bound water content can not be evaluated based on CST results.
The purpose of moisture distribution studies has been to change the way dewatering
efficiency is measured, from a process where the total amount of water removed is
measured to a process where the percentage of removable water is measured.
This approach also creates opportunities for evaluating the theory that various disruption
mechanisms can change the moisture distribution of a sludge and through trial and error,
a method could be developed to reduce the quantity of bound water thereby improving
mechanical sludge dewatering. As mentioned above, research has shown that bound
water quantity can be altered through disruption mechanisms, both alone and in
combination.
This study examines whether or not a test can be developed that can accurately
approximate upper limits of dewaterability by measuring bound water content based on
performance of wastewater treatment plants. It also examines the possibility of changing
this upper limit through disruption mechanisms designed to reduce the quantity of bound
Chapter 2 Centrifugal Dewatering Test:
Development and Correlation to Full-Scale Plant Dewatering Performance ABSTRACT
A centrifugal dewatering test that measured sludge dewaterability based on moisture
distribution was developed. The test is based on the concept that as centrifugal forces
approach infinity, all free water within sludge is removed and only bound water will
remain in the solid pellet. Results showed that centrifugation at ~150,000 x g for 30
minutes led to an asymptotic value of bound water remaining in the centrifuged pellet.
Sludges from eight municipal wastewater treatment plants in the state of North Carolina
were sampled over a two month period and centrifugal dewatering test results were
compared to full-scale plant dewatering results. Significant correlations between test
results and full-scale plant dewaterability results were obtained for six of the eight plants
tested while results were inconclusive for the remaining two. We conclude that the
centrifuge test is able to predict trends in sludge dewaterability prior to sludge dewatering
equipment. Such a test will improve decision making related to solids dewatering
procedures, because it can be used to forecast dewaterability in advance of solids
handling processes.
2.1 INTRODUCTION
An inherent difficulty in biological sludge dewatering is the lack of a reliable test to
predict the performance of dewatering equipment. Current dewatering tests such as
capillary suction time (CST) and specific resistance to filtration (SRF) measure the rate
of release of water from sludge. However, these tests do not indicate the distribution of
water are bound to sludge solids and cannot be removed through existing mechanical
dewatering equipment. This portion of sludge water that cannot be removed was termed
‘bound water’. In biological sludges, one of the most important properties is the bound
water content. Bound water has been shown to positively correlate with full-scale
wastewater treatment plant sludge dewaterability (Katsiris and Kouzeli-Katsiri (1987);
Colin and Gazbar (1995); Kopp and Dichtl (2001); Robinson and Knocke (1992)).
However, correlations between bound water and dewatering tests such as CST and SRF
have not been made. Chen et al (1996) concluded that bound water content cannot be
evaluated based on CST measurements. No direct comparison between SRF and bound
water content has been made.
Previous research has demonstrated that despite increased dewatering effort, there is a
portion of water that remains associated with sludge solids. Using a constant-head piston
press to separate sludge solids and liquid, Chang and Lee (1998) developed a three-stage
model for dewatering. Stages one (bulk water removal) and two (interstitial water
removal) correlated with previously developed models for the relationship between
inorganic particulate sludge particles and sludge water. However, a third stage also
existed that could not be predicted with existing models. They concluded that this third
stage, seen only in biological sludges, was due to the presence of large amounts of bound
water in biological sludge which would require increased pressure to remove. Chu and
Lee (1999B) later obtained additional data showing that a portion of sludge water
also concluded that some portion of water was not removable by mechanical means.
Vesilind and Hsu (1997) stated that accurate measurement of sludge bound water content
would provide insight into the practical limit of sludge dewaterability.
One method for measuring bound water content in biological sludge is centrifugation.
Centrifugation at high speeds may separate sludge into free removable water and bound
water that remains with the sludge solids. In centrifugation the rotational speed is related
directly to the centrifugal force. Chu and Lee (2002) identified increased rotational speed
as a way to enhance centrifugal dewatering efficiency. Lee (1994B) developed a
centrifuge test to measure bound water content in sludge. Their results indicated that
centrifugation alone was not able to accurately measure bound water content. However,
their test was conducted only at 2000 x g for 30 minutes. Using a similar experimental
set-up, Yen and Lee (2001) noticed a rebound effect for sludge height following
centrifugation. They also noted that a threshold rotational speed existed beyond which
the rebound effect largely deteriorated. Matsuda et al (1992) postulated that if the
centrifugal force goes to infinity, all void spaces within sludge would be collapsed and
only sludge solids and bound water would remain. Barber et al (1995) developed a
centrifugal dewatering test based on this hypothesis and the idea that bound water
represents a practical limit to the dewaterability of sludge. The test was developed as part
of an effort to improve solids dewatering at an industrial wastewater treatment plant, and
consisted of centrifugation at 45,100 x g for ten minutes. Although they never reached
the true mechanical dewatering limit where increased centrifugal force results in no
plant dewatering performance, leading to its use as a decision making tool regarding plant
operations. However, one cannot draw any conclusions about the ability of the test to
predict dewatering trends at other plants.
The objective of this research was to determine if a centrifugal dewatering test could be
developed that could measure the portion of water removable through mechanical
equipment. One of the goals was to determine if there is a point where increasing the
centrifugal force applied to a sludge sample would not increase the percent total solids of
the remaining pellet using centrifugal forces of up to 225,000 x g.. Hypothetically, this
would be the point where only bound water and sludge solids would remain and could
theoretically be considered the maximum unconditioned (without polymer addition)
sludge dewaterability. A secondary objective of the study was to determine if the
developed centrifugal dewatering test could be correlated to full-scale wastewater
treatment plant dewatering performance regardless of solids handling procedures used.
This would demonstrate that sludge dewaterability is a function of moisture distribution
and that at some point, further enhancements to dewatering equipment may not lead to
comparable increases in sludge dewatering. The development of such a test could lead
to: (1) a more fundamental understanding of the relationship between liquid and solids
within sludge and (2) a different approach to dewatering sludge where more effort is
made to control moisture distribution in sludge through operational changes to the entire
2.2 METHODS
2.2.1 Centrifuge
A Sorvall Ultra-80 centrifuge equipped with a Beckman type 50.2-ti fixed-angle rotor
and 30 ml round-bottom polycarbonate centrifuge tubes were used. This centrifuge/rotor
combination was capable of speeds up to 50,000 rpm (~225,000 x g).
2.2.2 Samples
Samples of waste activated sludge (WAS) samples from four municipal wastewater
treatment plants in North Carolina were collected. The plants chosen were the North
Cary Water Reclamation Facility (NCWRF), the South Cary Water Reclamation Facility
(SCWRF), The South Durham Water Reclamation Facility (SDWRF), and the Neuse
River Wastewater Treatment Plant (NRWWTP). Approximately one gallon of sample
was collected from each of the four plants in early November 2004. All of the four plants
use activated sludge systems for the treatment of municipal wastewater. The four plants
were chosen based on their wide variety of reactor configurations, differences in sludge
handling equipment, and geographical proximity.
Verification consisted of correlating centrifugal dewatering test measurements to
full-scale plant dewatering performance. Eight municipal wastewater treatment plants agreed
to submit samples for testing and provide dewatering data for the specified dates. The
eight plants were chosen to represent a variety of solids handling and dewatering
equipment technology. The eight plants chosen included the previously mentioned
(MCWWTP) in Huntersville, the James A. Loughlin WWTP (JLWWTP) in Wilmington,
the Town Creek WWTP (TCWWTP) in Salisbury, and the Archie Elledge WWTP
(AEWWTP) in Winston-Salem agreed to participate and submitted samples.
For test correlation purposes, each plant submitted a total of 24 samples (three samples
per week) over a two month period during November and December 2004. Centrifugal
dewatering tests and total solids analysis were performed on all samples submitted.
Three samples were collected per week and stored at 4°C. At the end of the week, all
three samples were shipped to North Carolina State University for analysis. Previous
researchers have seen changes in sludge properties during storage of samples (Nielsen et
al., 1996; Bruus et al., 1993) so before starting the experiment, preliminary testing was
performed to determine if centrifugal dewatering test results would change as a result of
this storage. No significant changes were seen over a seven day period. Test data and
results are included as Appendix I
All tests were performed in triplicate and centrifugal dewatering test data were compared
to actual plant dewatering data to determine if the test could accurately predict trends in
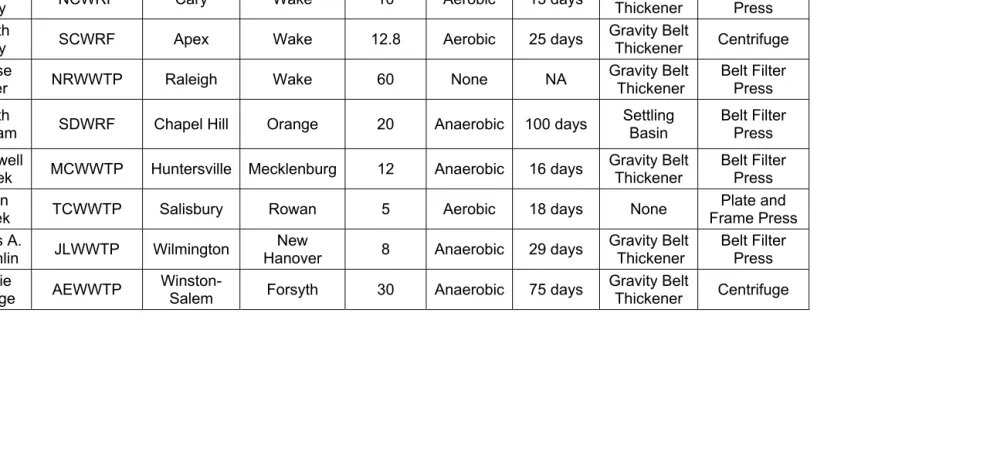
full scale plant dewaterability. Table 2.1 lists the locations, capacities, thickening, and
Table 2.1. Characteristics of wastewater treatment plants participating in dewatering study.
Plant Abbreviation City County
Capacity
(MGD) Digester
Digestion Time Thickening Method Dewatering Equipment North
Cary NCWRF Cary Wake 10 Aerobic 15 days Gravity Belt Thickener Belt Filter Press South
Cary SCWRF Apex Wake 12.8 Aerobic 25 days Gravity Belt Thickener Centrifuge Neuse
River NRWWTP Raleigh Wake 60 None NA Gravity Belt Thickener Belt Filter Press South
Durham SDWRF Chapel Hill Orange 20 Anaerobic 100 days Settling Basin Belt Filter Press McDowell
Creek MCWWTP Huntersville Mecklenburg 12 Anaerobic 16 days Gravity Belt Thickener Belt Filter Press Town
Creek TCWWTP Salisbury Rowan 5 Aerobic 18 days None Frame Press Plate and James A.
Loughlin JLWWTP Wilmington New
Hanover 8 Anaerobic 29 days
Gravity Belt Thickener
Belt Filter Press Archie
2.2.3 Test procedure
The centrifugal dewatering test is based on the method of Barber et al (1995). Initially,
triplicate samples were centrifuged for 30 minutes at increasing speeds up to ~200,000 x g in
increments of 25,000 x g. Immediately following centrifugation the tubes were inverted, the
centrate was poured off, and the centrifuged pellet was carefully scraped out. Total Solids
analysis was performed on the pellets according to Standard Methods (APHA, 1998).
Percent total solids in the remaining pellet was plotted against centrifugal force, and the point
where total solids ceased to increase was determined.
2.2.4 Correlations
Correlation analysis between the percent total solids from the centrifugal dewatering test and
total cake solids from full-scale plant dewatering equipment was performed. Centrifugal
dewatering test data was plotted versus full-scale plant performance and the correlation
coefficient r was calculated. Since centrifugal dewatering tests were conducted on sludges
prior to digestion, the digestion time was added for each centrifugal dewatering test date to
allow accurate comparisons.
2.3 RESULTS AND DISCUSSION
2.3.1 Test Development
Preliminary tests were performed to determine the exact time and force necessary for
establishing a maximum value where increased centrifugal force did not produce any further
dewaterability for unconditioned sludge (Vesilind, 1994). Results of preliminary tests on
sludges from NCWRF, SCWRF, SDWRF, and NRWWTP are shown below in Figure 2.1.
0.00 5.00 10.00 15.00 20.00 25.00 30.00
0 50,000 100,000 150,000 200,000
Centrifugal Force (x g)
Percent
T
otal S
olids
North Cary South Cary
Neuse River WWTP South Durham WRF Figure 2.1. Preliminary results of centrifugal dewatering test
Effects of centrifugal force on dewaterability.
NCWRF sludge indicated no statistically significant increase in percent total solids after
~150,000 x g. Results from NRWWTP indicate no significant increase following ~175,000 x
g. Results from SCWRF and SDWRF showed significant increases at all speeds up to ~
200,000 x g.
Based on the preliminary results, a centrifugal dewatering test was developed, which
consisted of centrifugation at ~150,000 x g for 30 minutes. These values were chosen for
measuring dewatering trends, as well as the upper limits of sludge dewaterability. This point
the four curves where increasing centrifugal force did not result in increased total solids
content in the remaining pellet. Having different plants tested at different centrifugal forces
was considered. However, using different centrifugal force would make comparisons
difficult.
2.3.2 Test Verification
Once the centrifugal dewatering test was developed, samples were collected from the eight
plants participating in the correlation study. Significant correlations were established
between the centrifugal dewatering test and full-scale plant dewatering performance for six
of the plants in the study. Correlation study results for MCWWTP, JLWWTP, SCWRF,
TCWWTP, NRWWTP, and AEWWTP are in Figures 2.2, 2.3, 2.4, 2.5, 2.6, and 2.7,
respectively. Full-scale plant dewaterability data was also provided by the NCWRF and
SDWRF but not enough points were provided to measure correlation. Data for these two
0 5 10 15 20 25 30 35
11/9/04 11/24/04 12/9/04 12/24/04 1/8/05 1/23/05 2/7/05 Date Per cent T ot al Sol ids
Solids Cake Centrifuge Test r = 0.594 Significant Correlation, α = 0.10
Figure 2.2, McDowell Creek wastewater treatment plant. Correlation of centrifugal dewatering test.
0 5 10 15 20 25 30 35
11/9/04 11/24/04 12/9/04 12/24/04 1/8/05 1/23/05 2/7/05 Date
Percent
T
otal S
olids
Solids Cake Centrifuge Test r = 0.443 Significant Correlation, α = 0.10
0 5 10 15 20 25 30 35
11/9/04 11/24/04 12/9/04 12/24/04 1/8/05 1/23/05 2/7/05 Date
Percent
T
otal S
olids
Solids Cake Centrifuge Test r = 0.556 Significant Correlation, α = 0.05
Figure 2.4, South Cary water reclamation facility, correlation of centrifugal dewatering test.
0 5 10 15 20 25 30 35
11/9/04 11/24/04 12/9/04 12/24/04 1/8/05 1/23/05 2/7/05 Date
Percent
T
otal S
olids
0 5 10 15 20 25 30 35
11/9/04 11/24/04 12/9/04 12/24/04 1/8/05 1/23/05 2/7/05 Date
Percent
T
otal S
olids
Solids Cake Centrifuge Test Significant Correlation, α = 0.10
r = 0.352
Figure 2.6,Neuse River wastewater treatment plant, correlation of centrifugal dewatering test.
0 5 10 15 20 25 30 35
1/26/2005 2/4/2005 2/14/2005 2/23/2005 3/5/2005 3/14/2005 3/24/2005 Date Per cent T ot al Soli ds
Solids Cake Centrifuge Test r = 0.523 Significant Correlation, α = 0.05
0 5 10 15 20 25 30 35
11/9/04 11/24/04 12/9/04 12/24/04 1/8/05 1/23/05 2/7/05 Date P erc en t T ota l S olid s
Solids Cake Centrifuge Test
Figure 2.8,North Cary wastewater reclamation facility, correlation of centrifugal dewatering test.
0 5 10 15 20 25 30 35
2/7/2005 2/18/2005 3/2/2005 3/14/2005 3/25/2005 4/6/2005 4/18/2005 Date
Percent
T
otal S
Correlations between centrifugal dewatering tests and plant dewatering performance indicate
that the centrifugal dewatering test could be used to predict full-scale plant dewaterability
trends based on moisture distribution in sludge. Being able to predict dewatering
performance in advance of digestion processes could help plant staff with decisions related to
operational investment in dewatering equipment. In addition, plants may choose to modify
existing design to increase dewatering potential. In the case of Barber et al (1995),
operational changes were made to their activated sludge process based on sludge dewatering
potential measured through their centrifuge test. This resulted in improved belt-filter press
cake solids and decreased cationic polymer usage.
Another aspect of the centrifugal dewatering test is the idea that it can measure the upper
limit of dewaterability for unconditioned sludge. This upper limit represents a sludge where
all bulk and interstitial water has been removed and only bound water remains. Knowing this
value could lead to a change in the approach to evaluating the performance of dewatering
equipment. Instead of measuring dewatering efficiency by the amount of water a device is
removing and adjusting equipment parameters to increase moisture removal, a plant could
measure the percentage of removable water a device is removing. Full-scale dewatering data
showed values that were consistently below centrifugal dewatering test values. This
indicates that the difference between the centrifugal dewatering test and the plant dewatering
results would be interstitial moisture that is not being removed through dewatering
A summary of dewatering results including two-month averages of plant dewatering data and
centrifugal dewatering test results for all eight plants is shown below in Table 2.2. The
percent difference column is the percentage of the maximum unconditioned sludge
dewatering efficiency (as measured by centrifugal dewatering test) that the plants dewatering
equipment achieved. In cases where the percent difference is negative, the plants were able
to remove more water than the centrifugal dewatering test predicted. Since the centrifuge
test measures the dewaterability of unconditioned waste activated sludge it is possible
through the use of sludge conditioners and polymers to increase the amount of water
removable through mechanical dewatering.
Table 2.2. Results of centrifugal dewatering test and plant dewatering performance. Averaged over two-month period.
Two of the eight plants were able to achieve higher sludge dewaterability than the centrifugal Treatment Plant Abbreviation Averge Centrifuge Test Result Standard Deviation Average Plant Dewatering Result Standard Deviation Percent Difference
Neuse River NRWWTP 21.28 0.85 21.72 1.92 -2.10
North Cary NCWRF 20.60 0.75 13.22 3.66 35.84
South Cary SCWRF 22.38 0.84 16.42 0.77 26.64
Archie
Elledge AEWWTP 19.53 0.87 23.26 1.01 -19.09
James A.
Loughlin NSWWTP 21.57 0.89 20.89 1.03 3.15
South
Durham SDWRF 24.59 0.67 13.68 0.24 44.35
Town Creek TCWWTP 29.13 1.22 19.28 2.81 33.79
McDowell
the centrifugal dewatering test can be attributed to any number of reasons including, polymer
optimization, sludge conditioning, and activated sludge basin design and operating
parameters. Not surprisingly, these two plants also had the highest average dewatered cake
solids of the eight plants. The two plants also have the highest treatment capacity of the eight
indicating considerable investment in the sludge dewatering operations of their plants. Each
of the remaining six plants had dewatering results that were less than the centrifugal
dewatering test results indicating that they may not be maximizing sludge dewaterability.
These six plants may be able to benefit from an evaluation of their wastewater treatment
process and dewatering equipment.
When evaluating the differences between the centrifugal dewatering test and plant
dewatering performance, many factors need to be considered. The centrifugal dewatering
test measures dewaterability based on samples of waste activated sludge with the idea that
dewaterability is a function of the entire activated sludge process, as well as dewatering
equipment used. Accordingly, all parameters of the activated sludge process (mixed liquor
suspended solids [MLSS], solids retention time [SRT], aeration basin configuration, clarifier
performance) need to be considered before making any changes in dewatering strategy.
2.4 CONCLUSIONS
A centrifugal dewatering test was developed in an attempt to measure and predict the
were established between the centrifugal dewatering test result and full-scale dewatering
performance. Results indicate that it is possible to use centrifugal dewatering test results to
predict trends in sludge dewaterability in advance of sludge handling processes such as
digestion, thickening, and conditioning. The centrifugal dewatering test is potentially able to
predict trends in plants using anaerobic or aerobic digestion. The test may also be able to
predict trends in plants with a variety of dewatering equipment including centrifuges,
belt-filter presses, and plate-and-frame press. The concept of dewaterability testing based on
moisture distribution shows promise and merits further testing including longer testing time
periods to allow tighter correlations. The concept of measuring the upper limits of sludge
dewaterability needs to be explored further with a specific test developed for each plant being
Chapter 3 Disruption of Cellular and Floc Structures to Improve Dewaterability of Activated Sludge Through Changes to Moisture Distribution – Theory and Application
ABSTRACT
The ability of disruption techniques to improve the dewaterability of waste activated sludge
was examined. Heat treatment, sonication, alkaline treatment, and cation addition were used
alone, and in various combinations, to alter the distribution of moisture within waste
activated sludge as measured by centrifugation and dilatometry. Disruption of sludge
structure was measured by soluble protein content and cell lysis was measured by
LIVE/DEAD epifluoresent stain. Sonication at 50 and 160 watts, as well as, heat treatment
at 40, 60, and 80°C were evaluated for cell lysis, floc disruption, compactibility,
dewaterability, and bound water content. Cation addition (Na+, Mg2+, and Fe3+) was
evaluated for changes in compactibility, dewaterability, and bound water content.
Combinations of heat treatment-cation addition and sonication-cation addition were
evaluated for compactibility, dewaterability, and cation addition. Sonication led to
significant changes in moisture distribution of samples as evidenced by increased
dewaterability and compactibility. Heat treatment led to insignificant changes in moisture
distribution and no changes to compactibility or dewaterability. Cation addition alone led to
changes in moisture distribution. The addition of cations had no additional effect, when used
after heat treatment or sonication. Disruption techniques used in this study did not lead to
large increases in cell lysis as was hypothesized, but rather, led to increases in soluble protein
due to EPS breakup. The measurement of moisture distribution for assessing sludge
3.1 INTRODUCTION
One of the least understood aspects of sludge dewatering is the structure of water within
sludge. At the most basic level, water in sludge is considered free or bound (Vesilind, 1994;
Kopp and Dichtl, 2001). Free water is able to move within floc structures and is unaffected
by sludge solids. On the other hand, bound water is associated with sludge solids and cannot
be removed by mechanical dewatering equipment. An existing hypothesis is that bound
water represents the theoretical maximum limit of unconditioned sludge dewaterability
through mechanical equipment (Vesilind, 1994). Therefore several researchers have
explored the idea that bound water can be converted to free water and therefore removable
through common dewatering operations.
To obtain a better understanding of bound water several researchers have developed
classification systems for the water within sludge. Vesilind (1994) developed a classification
system based on energy required to separate solids and liquids. His definitions are listed
below.
1. Bulk water – water that is not associated with solid material and is easily removed
2. Interstitial water – water that is held within floc structures. Upon deterioration of floc
this water is removed.
3. Vicinal water – water that is structured in layers according to electrostatic charge.
Solid surfaces hold onto water molecules through hydrogen bonding. Upon
4. Water of hydration – water that is chemically bound to sludge particles and
removable only through thermal input.
Accurate measurement of these portions of water within sludge is considered important to
improving sludge dewatering. Techniques that convert bound water to free water can
increase moisture removal by conventional dewatering equipment. Minimization of void
structures within floc structure would lead to a decrease in interstitial water volume. Floc
structure has been shown to be an important part in sludge bound water content and sludge
dewatering (Lee, 1994A; Liao et al., 2000; Guan et al., 2003). Either by destroying floc
structure or by shrinking floc structure to effectively remove pore space, bound water could
be converted to bulk water and expelled from the floc structure.
Polymer conditioning has been shown to reduce bound water content and therefore improve
sludge dewaterability. Chu and Lee (1999A) observed decreasing bound water concentration
with polymer addition up to the charge neutralization point. Beyond that point, bound water
increased as a result of further polymer addition. Katsiris and Kouzeli-Katsiri (1987) noted
decreased bound water content following addition of chemical coagulants FeCl3, AlCl3, and
FeSO4. Wu and Wu (2001) noted decreases in bound water content following conditioning
with cationic polymer. All three research groups hypothesized that bound water was
decreased as water molecules were replaced by polymer molecules on the sludge surfaces.
The addition of cationic salts has been shown to change bound water content and improve
Ca2+, Mg2+, Fe3+, and Al3+. Novak et al. (2001) noted increased floc strength and improved
dewaterability in the presence of iron. Choi and Chung (2000) and Choi et al. (2004) noted
improved dewaterability and decreased bound water following leaching of divalent cations
from humus soil amended activated sludge. Nielsen and Keiding (1998) observed a decrease
in sludge dewaterability due to floc deterioration following the addition of sulfides. They
hypothesized that ferric iron was reduced to FeS and therefore removed from the floc
structure. Similarly, Bruus et al. (1992) saw decreased dewaterability following the removal
of Ca2+ by ion exchange resin.
Tezuka (1969) theorized that divalent cations bridged negatively charged sites on sludge
particle surfaces. He termed this the divalent cation bridging (DCB) theory for floc
formation. Higgins and Novak (1997A, 1997B) discussed the use of the DCB theory for
improved floc properties including sludge dewatering. In their experiments they noted that
addition of monovalent sodium led to deteriorated floc structure and decreased
dewaterability. Addition of divalent calcium and magnesium reversed this deterioration and
improved sludge dewaterability. They concluded that for optimum dewatering the ratio of
monovalent to divalent cations should be 2:1 and that dewatering is deteriorated when this
ratio is exceeded. In a paper examining bioflocculation in the presence of cations, Sobeck
and Higgins (2002) concluded that the DCB theory could best explain the role of cations in
flocculation. They noted that deteriorating floc properties due to sodium addition could not
The physical disruption of sludge structure has been shown to change the partitioning of
sludge water. Katsiris and Kouzeli-Katsiri (1987) observed a 30% decrease in bound water
content following heat treatment of activated and digested sludge at 130°C. Lu et al. (2003)
saw increased dewatering efficiency with the use of Fenton’s reagent, a powerful oxidizing
system. Chu et al. (2001) noted increased bound water content following sonication. Ormeci
and Vesilind (2001) saw increased dewaterability in alum and activated sludges following
freeze-thaw treatment.
Various methods have been developed for disrupting activated sludge structures. Heat
treatment has been used previously to promote hydrolyzation of cellular structure in advance
of digestion processes (Tanaka et al., 1997). Rocher et al. (1999) saw complete cell
deactivation at temperatures above 55°C. Sonication has been shown to disrupt sludge and
cellular structures bytheprocess of acoustic cavitation (Yin et al., 2004). Gas and vapor
bubbles generate, grow, and collapse violently leading to turbulent conditions. High
temperature and pressure develop inside the collapsing bubbles, which break apart floc and
cellular structures. Alkaline treatment of activated sludge has been shown to disrupt cellular
structures (Vlyssides and Karlis, 2004). At high pH values, cell walls lose viability leading
to leakage of intracellular material. Furthermore, high pH values can lead to a cell surface
with an increasing negative charge resulting in the desorption of extracellular polymers
(Katsiris and Kouzeli-Katsiri, 1987).
Disruption in activated sludge is commonly measured by soluble protein content. The main
systems can be both intracellular and extracellular in nature. Sludges in activated sludge
systems are known to contain various amounts of extracellular polymeric substances (EPS), a
gel-like slime layer that surrounds the outside of microbial cells serves as a food source and
is known to promote flocculation. Vallom and McLoughlin (1984) showed that cell lysis led
to a release of intracellular polymers, which in turn became part of the cellular EPS and aided
in flocculation Bura et al (1998) showed that protein accounted for approximately 85% of
extracted EPS. Dignac et al (1998) arrived at a similar conclusion. Any material that resides
inside a cell in an activated sludge system can also reside in the EPS of the cell as well and
protein analysis alone cannot distinguish between the two.
Cell lysis is sometimes employed in wastewater treatment to improve sludge digestion by
expediting the limiting step of cell hydrolysis (Camacho et al., 2002; Egemen et al., 1999;
Sakai et at., 1997). It has been hypothesized that cell lysis can also improve sludge
dewaterability by making intracellular water available for removal by dewatering equipment
(Erdincler and Vesilind, 2000). Since biological sludges contain large numbers of cellular
organisms, there is a great potential for moisture removal following cell lysis.
The purpose of this study was to determine if disruption of cellular and floc structures would
have any affect on the distribution of moisture and sludge dewaterability as measured by
dilatometry and centrifugation. Whereas most previous studies have focused on disruption of
sludge structure to change dewaterability, it was our intent to demonstrate that cell lysis
centrifugal dewatering test, the simultaneous measurement of bound water and dewaterability
would be possible.
3.2 METHODS
3.2.2 Samples
Samples of return activated sludge (RAS, approximately 2 gallons per visit) were collected
from the North Cary Water Reclamation Facility. Samples were stored at 4°C and analyzed
within 48 hours of sampling except in one case where a sample was stored for one week.
Prior to use the samples were removed and allowed to come to room temperature (~24°C).
3.2.3 Disruption
Heat Treatment
Samples were heated to 40ºC, 60ºC, or 80ºC by placing a volumetric flask containing 200 ml
of sample in a pre-heated waterbath (Fisher Scientific Isotemp model 228). The temperature
of the samples was measured using a thermometer inserted into an extra sample. The
samples were allowed to reach equilibrium temperature in the waterbath and held at that
temperature for 5, 15, 30, 60, or 120 minutes. To eliminate variations in density due to
temperature, sludge samples were allowed to return to room temperature following heat
treatment.
Sonication
Sonication was performed using a Fisher Scientific 550 sonic dismembrator at a frequency of
frequencies of 20 – 40 kHz (Chu et al, 2001). Two levels of sonication were used. A low
level sonication, at approximately 50 watts was used. This level represented the point at
which sludge particles were visibly moving around in the sludge during sonication. A high
level sonication at approximately 160 watts was also used. This level corresponded to the
maximum intensity of sonication that could be reached without ejecting the sludge from the
sample container. Each disruption test consisted of sonicating a 200 ml sample of RAS for
time ranging from 10 seconds to 5 minutes. Slight increases in temperature were noted
during extended sonication at 160 watts. All sonicated samples were allowed to return to
room temperature before further tests were conducted.
Alkaline Treatment
Sludge pH was increased from 6.7 to 12.0 using 1M solutions of NaOH and KOH and
samples were collected at pH 7.0, 8.0, 9.0, 10.0, 11.0, and 12.0. Sludge solutions were mixed
constantly during pH adjustment using a stirring plate. To ensure that all disruption was due
to pH and not due to monovalent cations, an equivalent amount of Na+ and K+ was added as
chloride salt solutions to another set of samples. No significant disruption was noticed upon
addition of salt solution indicating that all changes in sludge properties were due to pH
increase.
3.2.4 Disruption Measurements
Soluble Protein Measurement
analysis can be used to measure the degree of disruption in activated sludge systems
(Schmitz et al, 2000). The amount of protein in solution following disruption was measured
in triplicate.
Protein analysis was performed using the Bio-Rad RC-DC assay (Bio-Rad, Hercules CA).
The assay is based on the Lowry method of protein measurement (Lowry et al, 1951) and has
been shown to work well in the presence of numerous reducing agents and detergents that are
commonly found in activated sludge systems. Solid material was separated from the bulk
matrix by centrifugation at 10,000 x g for 5 minutes.
Cell Lysis
To determine if soluble protein released was intracellular or extracellular cell lysis was
measured using the LIVE/DEAD fluorescence microscopy stain. The stain is a combination
of Propidium Iodide and Syto 9. Syto 9 alone will penetrate cells with intact membranes and
cause them to fluoresce green using epifluorescnt microscopy. These cells are termed LIVE.
Cells with disrupted membranes will allow both Syto 9 and Propidium Iodide to penetrate
and will fluoresce red, these cells are termed DEAD. Photographic images were obtained
using a Photometrics Sensys charge-coupled device camera mounted on a Nikon Optiphot II
fluorescence microscope. All images were taken under 400X magnification. Image analysis
was performed using MetaMorph 5.0 software (Universal Imaging Corp., Silver Spring,
MD). LIVE/DEAD stain has been used previously in activated sludge systems (Ramirez et
al, 2000; Riley and Forster, 2001; Vollertsen et al, 2001; Seka et al, 2003). Images of RAS
samples heated to 40, 60, and 80°C at periods of 0, 1, and 2 hours. Images of RAS samples
sonicated at 50 and 160 watts for periods of 1 min, 2 min, and 5 min were also taken. For
each disruption method tested, eight photos were taken from each of four prepared slides for
a total of 32 images for each disruption.
Photographic analysis consisted of manually thresholding each image and measuring the total
pixel area that was LIVE and the total area that was DEAD. The total area was then
calculated by the summation of the two areas, and the percentage of lysed cells was
calculated by dividing the DEAD area by the total area and multiplying by 100. Sample
images for each treatment are included as Appendix II.
3.2.5 Cation Addition
All cations were added as chloride salt solutions. One molar solutions of K+, Na+, Ca2+,
Mg2+, and Fe3+ chloride salt were prepared, and were added to 200 ml batch samples of RAS.
To limit the effects of dilution, samples were allowed to settle for approximately 30 minutes
and a volume of clear supernatant equal to the volume of chloride salt solution to be added
was removed. Cation additions of 5, 15, and 25 meq were used. Following cation addition,
samples were allowed to equilibrate for two hours. In tests where cation addition was
combined with sludge disruption techniques, disruption was performed firs, then cationic
3.2.6 Bound Water
Bound water was measured by the dilatometric method established by Smith and Vesilind
(1995). Dilatometry is based on the principle that the freezing point of bound water differs
from that of bulk water. Dilatometers measure the expansion as bulk water freezes. The
total amount of water in the sample is calculated by measuring the percent total solids
according to Standard Methods (APHA, 1998). The amount of frozen water is calculated by
measuring the increase in volume due to freezing and using a predetermined coefficient of
expansion for freezing water. The amount of bound water is then the difference between the
total water and the frozen water.
Dilatometers (Ace Glass, part no. 6282-10) were modified to match those used in the