Saturation Flow Concept at Signalized
Intersection for Non Lane Based Traffic
Mohammed Ibrahim1, Karanam Madhu Kumar2, Prof. R. Srinivasa Kumar3
M.E Student (Transportation Engineering),University College of Engineering, Osmania University, Hyderabad,
Telangana, India1
M.E Student (Transportation Engineering), University College of Engineering, Osmania University, Hyderabad,
Telangana, India2
Professor, Department of Civil Engineering, University College of Engineering, Osmania University, Hyderabad,
Telangana, India 3
ABSTRACT: The important parameters in the planning, design and control of a signalized intersection are saturation flows, lost times and passenger car units (PCU). These factors have been traditionally measured in most western countries based on the research carried on test tracks and on public roads where traffic is typically car-dominated with vehicles moving in clearly defined lanes. However, the traffic movement in Bangladesh and in other developing countries is rendered more complex due to the heterogeneous characteristics of the traffic stream using the same right of way. Another striking feature of the road traffic operating condition in developing countries is that, despite having lane markings, most of the time lane discipline is not followed no matter whether non-motorized vehicle is present or not. At intersections, there is notable lateral movement and vehicles tend to use lateral gaps to reach the head of the queue. Due to fundamental differences in traffic characteristics, the standard western relationships for predicting the values of saturation flows, lost time, and PCU factors are not appropriate for developing countries. This present work first reviews principle methods of measurement of saturation flow and the selection of a proper method to measure this parameter for the traffic condition prevailing in developing countries. The research establishes that a unified PCU concept is not true for non-lane based traffic conditions and proposes a PCU and flow model for estimating the saturation flow of signalized intersection having no lane discipline.
KEYWORDS: control of a signalized intersection are saturation flows, lost times and passenger car units (PCU)
I. INTRODUCTION
Traffic signals are perhaps the most important traffic control devices for at grade intersection in urban traffic system. Proper installation of traffic signals can reduce the number of accidents and minimize delays to vehicles at intersections. Furthermore, traffic signals can increase intersection capacity. The rapid increase in vehicle ownership in India in general, and Hyderabad in particular has increased the traffic intensity that has created various serious problems such as congestion and formation of long queues ultimately causing heavy delays and increase in the number of accidents at various locations on roadways. In order to solve this problem, it will be necessary to review the traffic signal timing. For a particular intersection, cycle time is an important parameter to minimize delay that ultimately causes formation of long queues and accidents. An important component required for the optimum cycle time is
saturation flow. Direct measurement of saturation flow is obviously desirable to achieve satisfactory results, but in case of new intersection, results from measurements of saturation flow are being estimated from the work of outdated researches. In case of Hyderabad, where no standard values of saturation flow are available pertaining to local traffic conditions, values are being applied from earlier work either carried in U.K or in USA that does not relate to the actual cycle time needed for local traffic.
A. OBJECTIVES OF STUDY
The aim and objectives of the subject study are:
a) To collect traffic data and study the traffic flow characteristics at selected signalized intersections of Hyderabad in general and at Nagole,Kamineni and Chain amber intersections in particular.
b) To measure saturation flow of traffic at several signalized intersections
c) To determine passenger car unit (PCU) for different vehicle types for saturated conditions.
d) To derive general relationship between intersection characteristic (approach width) and saturation flow. e) To measure the lost time at signalized intersections.
f) To compare the subject results with the results of earlier researchers, and to develop empirical relationship to estimate traffic intensity, i.e., saturation flow and lost time.
II. SATURATION FLOW
A. CONCEPT
Saturation flow is a macro performance measure of intersection operation. It is an indication of the potential capacity of an intersection when operating under 'ideal' conditions.
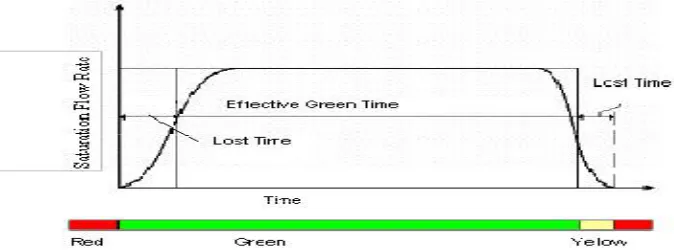
An idealized view of saturation flow at a signalized intersection is illustrated in Figure 1. As the traffic signal aspect shows green, there is first a very short gap as the first driver reacts to the change. The rate of vehicles crossing the stop line then rises at an increasing rate, as vehicles accelerate to the speed determined by the cars they are following. Vehicles soon reach a state where they are following one another across the stop line at a constant gap or headway. This constant rate is represented by the plateau of this flow profile. In a saturated intersection, the queue formed when the lights were at red will be too long to clear in the green period and so cars will be following each other at constant spacing during the green period. The flow rate will only drop as the lights show an amber aspect. Here the rate will decrease at an increasing rate as initially vehicles carry on through the stop line on amber and then stop as the signals show red. The saturation flow is calculated by making the curved profile into a rectangle from which the dimensions can be measured. This is achieved by introducing the idea of lost time and effective green time. The lost time is the time from the start of green to a point where vehicles are flowing at half the maximum flow plus the time from where vehicles are flowing at half the maximum flow at the end of saturation to the beginning of the red period.
To compare flows from different sites with different traffic composition, saturation flows are expressed not in vehicles but in generic units called Passenger Car Units (PCU). These units are an indicator of the space different vehicle types occupy, expressed relative to that of a passenger car.
B. METHODS OF MEASUREMENT
There are three principle methods available for the calculation of saturation flows: The Road Note 34 Method (1963)
The procedure used in this method consists of taking classified counts of vehicles crossing the stop line, within the approach width, in six second intervals during the green and amber period of the cycle under saturated flow condition (Williams et al., 1987). An average number of 30 cycles is recommended to be used for each approach.
The Average Headway Method
This is the most commonly used alternative to the counting method. Based on Scraggs (1964), this method requires data on time headway between vehicles as they cross the stop line. Time headway of a vehicle is measured as the time between the crossing of the stop line by the rear bumper of the vehicle preceding it, and its own rear bumper.
Multiple Liner Regression Methods
In recent years a number of alternative methods of processing the data collected in classified vehicle counts format have been developed, in an attempt to obtain simultaneous estimations of all properties of the discharge process. These methods involved a multiple linear regression technique, which has been used by a number of researchers (Branstonet al ., 1978, 1981; Holroyd 1963).
III. PREVIOUS STUDIES
A number of studies have dealt with saturation flow at signalized intersection and most of them work for lane based traffic condition.
Webster et al. (1958) made an extensive study of intersections in the London area and also in some larger cities, supplemented by controlled experiments at a laboratory test track. He developed a linear relationship between saturation flow and lane width for lane based traffic having no parked vehicles.
Later on the first US Highway Capacity Manual (1965) provided a detailed guideline for signalized intersection capacity analyses and design.
Branston (1977) investigated the variations of saturation flow for different times of a day and he suggested two linear relationships, one for the peak period and the other for the off peak period of traffic flow considering lane width as independent variable. Working on lane width varying from 3.0 - 4.3 meters, he observed that there is a variation of saturation flow with lane width for individual lanes although the values for nearside and offside lanes of two-lane approaches were not significantly different. However, in a full
scale TRRL test track experiment for lane based traffic, Kimber et al. (1983) found no significant difference between nearside,
central and offside lanes at multi-lane approaches. For approach widths ranging from 2.5 m to 12 m and lane width varying from 2.5 m to 4 m, they found that saturation flow per lane for lane based traffic increased non-linearly with lane width. They developed a two degree equation having an intercept term. In order to obtain saturation flow for the whole approach at the stop line they suggested using as many narrow lanes as possible.
In Kimber et al.(1986), based on database from 64 sites throughout UK, they suggested a basic saturation flow of 2080 PCU/hr for a
lane width of 3.25 m and an increase of 100 PCU/hr per meter width in excess of the standard width. They also found a reduction of 140 PCU/hr for the nearside lane. These values were obtained from the mean saturation flow over all sites where gradients were not found to affect flows.
In Australia, Leong (1968) investigated the effect of lane widths on saturation flow for lane based traffic condition. He applied headway ratio method to calculate saturation flow values. The majority of his lane widths were in the range 2.75 m to 3.5 m and he concluded that lane width had very little effect upon saturation flows. Results from subsequent investigations by the Australian Road Research Board confirmed his conclusion.
IV. DATA COLLECTION
As far as data collection is concerned, Video Recording Technique is used to collect data in the field. Video based technique overcomes many difficulties in collecting traffic information. The video camera continuously records the traffic flow. A total of three Kamineni, Nagole and Chainamber intersections were selected in Hyderabad city for the analysis, which images were given below. All intersections were pre-timed signals.
on the experimental data, saturation flow model is developed to suit mixed traffic conditions by regression analysis which simulates local traffic conditions. video traffic data was collected four hour period for day (8-10 am , and 4 -6pm) on three weekdays, Monday, Wednesday and Friday.
V. ANALYSIS AND RESULT
A. GENERAL: To draw meaningful inferences from the data collected from surveys the data has been subjected to statistical
analysis , the frame work for the analysis is to be fixed in the light of objective proposed The method of analysis should be so designed so as to reflect the system apart from fulfilling the objectives
B. CALCULATION OF PCU FACTORS
As already mentioned in the previous chapter that while conducting the field study the vehicular traffic is classified into five categories and the number of vehicles in each category going released during the saturated green time are recorded . while developing a multiple linear regression model these numbers of five categories are taken as dependent variable and saturated green time is treated as independent variable . the multiple linear regression analysis is carried out separately for each location the general form of the resulting equation is as follow
T = a
0 + a 1 x 1 + a 2 x 2 + a 3 x 3 +a 4 x 4 + a 5 x 5
Where, T = saturated green time (sec),
a0 = regression constant ,
x1 = number of motorized two wheelers getting released during saturated saturated green time ,
x2 = number of autos getting released during saturated green time ,
x3 = number of cars getting released during saturated green time ,
x4 = number of buses getting released during saturated green time ,
x5 = number of lorry/truck getting released during saturated green time,
a1,a2,a3,a4,a5 = Regression coefficients of two wheeler,auto,cars,bus,truck
Table.5.25. PCU values at selected intersections
Intersection Lane name Width
Green time in sec
Two
wheler Auto Car Bus Lorry
Kamineni intersection
1 Towards LBnagar 10.5 60 0.6 1.4 1 2.4 2.12
2 Towards Nagole 12 60 0.65 1.68 1 1.8 3.1
3 Towards
Dilsukhnagar 5.25 30 0.32 1.12 1 1.6 2.2
4 Towards Sahara 5 30 0.8 1.25 1 2.2 2.5
Nagole intersection
1 Towards LB
nagar 14.2 70 0.8 1.23 1 2 2.8
2 Towards Uppal 14 70 0.8 1.07 1 2.7 1.95
3 Towards
Kothapet 7.5 35 0.7 2 1 3.4 3.01
4 Towards
Bandlaguda 7 35 0.4 1.45 1 2 1.7
Chainamber intersection
1 Towards Uppal
road 7 60 0.7 1.59 1 2 1.73
2 Towards Shivam
road 7.9 60 0.6 1.3 1 2.2 2.4
3 Towards Uppal 7.5 60 0.43 1.6 1 3.5 1.3
4 Towards
C. ESTIMATION OF SATURATION FLOW (IN PCU/HR)
Saturation flow rate is the maximum rate of vehicular flow that can pass through a given intersection approach, during green period. This is one of the important parameters in capacity analysis of signalized intersections. Knowledge of saturation flow is essential in signal design. Saturation flow depends upon number of different parameters.
Saturation flow is estimated in PCU/hr using the PCU values obtained at each intersection. The following conventional procedure is adopted to determine the saturation flow value for each approach. First, the saturated green time (T sec) is divided by the number of different categories of vehicles that have been converted into passenger car unit to get the headway time. The inverse of headway gives the saturation flow. Thus the saturation flow in PCU/hr is obtained as:
=" × 1 + × 2 + × 3 + × 4 + × 5" × 3600
where S=saturation flow rate (pcu/hr), tw=number of two wheelers , a=number of autos, c=number of cars , b=number of buses, l=number of lorry/truck.
D. DISCUSSION OF RESULTS
After getting the PCU values of different type of vehicles at different intersection the saturation flow will be find out from the above equation. for each intersection having different quantities of saturation flow .the saturation flow is calculated and results were shown in table no 5.23.
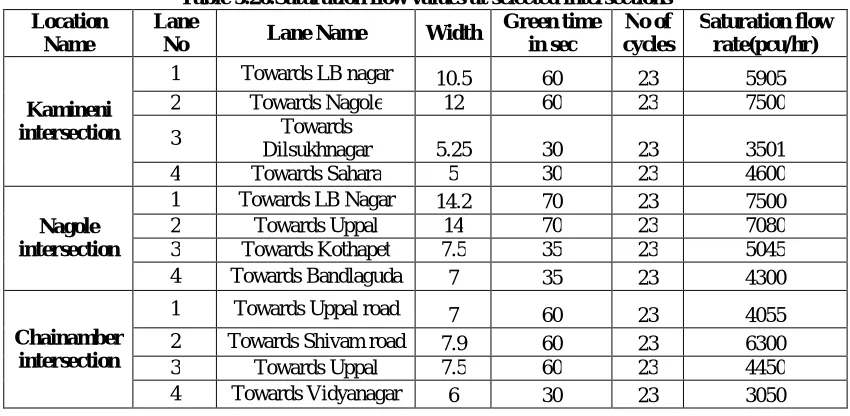
Table 5.26.Saturation flow values at selected intersections Location
Name
Lane
No Lane Name Width
Green time in sec
No of cycles
Saturation flow rate(pcu/hr)
Kamineni intersection
1 Towards LB nagar 10.5 60 23 5905
2 Towards Nagole 12 60 23 7500
3 Towards
Dilsukhnagar 5.25 30 23 3501
4 Towards Sahara 5 30 23 4600
Nagole intersection
1 Towards LB Nagar 14.2 70 23 7500
2 Towards Uppal 14 70 23 7080
3 Towards Kothapet 7.5 35 23 5045
4 Towards Bandlaguda 7 35 23 4300
Chainamber intersection
1 Towards Uppal road 7 60 23 4055
2 Towards Shivam road 7.9 60 23 6300
3 Towards Uppal 7.5 60 23 4450
4 Towards Vidyanagar 6 30 23 3050
E. DEVELOPMENT OF SATURATION FLOW MODEL
It is observed through literature that variation in intersection geometry, vehicle size, traffic conditions, driver behavior and traffic regulations may give different results in the determination of the intersection saturation flow in different countries or cities, even if the same methodology is being used.
A study of the saturation flow of signalized intersections under non-lane based traffic would require a large database from the field over a range of traffic flow and geometric conditions. Such a large database from the relevant situation is not available. In the present study, field data have been collected at three intersection approaches. Using this data, multiple regression analysis has been completed in order to estimate the saturation flow in passenger car units per hour. The flow model is obtained for different intersections are given below
S=447W+1713...[5.2] where S = saturation flow (pcu/hr), W=width(m).
2. Relationship between saturation flow & approach width has been determined for arterials having similar traffic conditions as on Nagoleintersection ;
S=387W+1863...[5.3]
3. Relationship between saturation flow & approach width has been determined for arterials having similar traffic conditions as on Chainamber intersection
S=1514W-6289...[5.4]
4.By putting all the three intersections in one equation the relationship between saturation flow & approach width was developed .that equation was given below
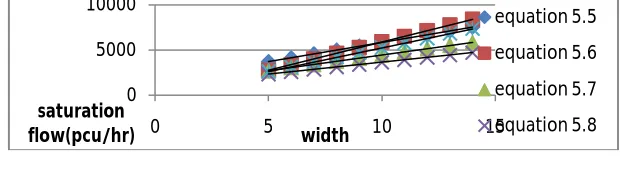
S=428W+1568...[5.5]
F. COMPARISON OF SATURATION FLOW MODEL WITH THE PREVIOUS STUDIES
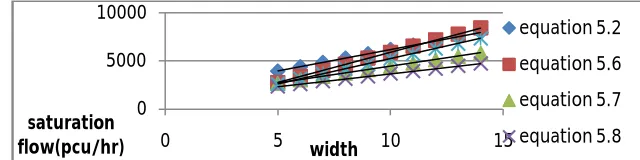
In this section a comparison has been made between present observation and the previous models which were developed for non-lane based traffic condition. Equations5.6 and 5.7represent the regression equation for Javanese cities developed by Sutomo (1992) and Turner et al. (1993) respectively.
S= -376 + 627w... [5.6] S= 964 + 349w... [5.7] In their Malaysian study, Ibrahim et al. (2002) derived the following formula: S = 1020 + 265w... [5.8]
As per IRC.sp.41.1994 The saturation flow(s) expressed in terms of Passenger Car Units (PCUs) per hr. and with no parked vehicles present is given by
S= 525 (w) PCU/ hr... [5.9]
The degree to which equation 5.2 compares with previous studies as stated earlier can be seen in Figure 5.1. From this figure, it can be seen that all the models predict higher saturation flow as a function of the approach width than the present model, though Equation 5.2shows a close prediction of saturation flow up to an approach width of 10 meters. At the same time it is also clear that prediction of saturation flow does not depend only on approach width as considerable differences between saturation flow may be found for the same width from the previous studies and also among all the studies for the non-lane based traffic including the present one
FIGURE 5.1. comparison of saturation flows of kamineni intersection to previous models
The degree to which equation 5.3 compares with previous studies as stated earlier can be seen in Figure 5.2.as shown in given below
0 5000 10000
0 5 10 15
saturation
flow(pcu/hr) width
equation 5.2
equation 5.6
equation 5.7
Figure.5.2. comparison of saturation flows of Nagole intersection to previous models
The degree to which equation 5.4 compares with previous studies as stated earlier can be seen in Figure 5.3.as shown in given below
Figure 5.3 comparison of saturation flows of Chainamber intersection to previous models
The degree to which equation 5.5 compares with previous studies as stated earlier can be seen in Figure 5.4.as shown in given below.
VI. CONCLUSIONS
The following conclusions can be drawn based on the experimental data and statistical analysis of the collected data and developed empirical equation
a) The PCU equivalents for vans (commercial vehicles), bus, light vehicles and motorcycles were different at different intersections as compared to pcu equivalents by Webster and Cobbe. with this present study showed a significant difference. This may be due to the difference of traffic composition, driver behaviour and other environmental conditions.
b) As far as method for data collection is concerned, Camcorder was used for data collection and it showed that this is the easiest method of recording the traffic data. The video recorder permitted the abstraction of data for PCU equivalents as well as for saturation flow. A built-in timer giving fraction of seconds was used to measure number of vehicles passing in each second presentation purposes. Video recorded data collection is much more superior to manual data collection. It requires less manpower. It produces permanent, complete record of the traffic scene; however data extraction is bit tedious.
c) Relationship between saturation flow & approach width has been determined for selected intersections. This relationship is different as compared to previous studies.
d) Many of the approaches found with increased saturation flow in first interval of 10 seconds as compared to other intervals showed significant difference of cycle profile as obtained by various researchers in developed countries. This is because vehicle users tend to form many lanes as much as they can without following the lane discipline or
0 5000 10000
0 5 10 15
saturation
flow(pcu/hr) width
equation5.3
equation 5.6
equation5.7
equation 5.8
0 10000 20000
0 5 10 15
saturation
flow(pcu/hr) width
equation 5.4
equation 5.6
equation 5.7
0 5000 10000
0 5 10 15
saturation
flow(pcu/hr) width
equation 5.5
equation 5.6
equation 5.7
lane marking. The cycle profile so obtained through the data collected in this research, slightly different from the cycle profile given by other researchers.
e) HCM 2000 suggests measurement of saturation period after 10 second of green period. 10 seconds are left considering starting delay which is called start up lost time. In mixed traffic condition this start up lost time is not significant. In this study, it is observed that auto rickshaws and two-wheeler find way in between heavy vehicles and try to come near to stop line. Most of the times these vehicles cross stop line before green starts. During red period large numbers of vehicles accumulate near stop line. This scenario allows large amount of traffic to discharge during initial 10seconds. Hence, it is proposed that count for measurement of saturation flow must start after 10 seconds of green start.
f) Results of this study can be used as base for calculation of saturation flow values in most areas of Hyderabad (For the Intersections having similar traffic conditions).
g) Regression model was developed to estimate saturation flow and it showed good correlation with observed values. This study presents estimation of saturation flow for signalized intersections; further tuning based on observed data is needed to establish reliable parameter estimates for general application, especially for varying geometric, traffic and environmental conditions. However, this model can be used to estimate saturation flow at any other intersections having similar traffic and geometric characteristics.
h) The Relationship between saturation flow & approach width has been determined for arterials having similar traffic conditions as on Kamineni intersection ; (S=447W+1713 )
The Relationship between saturation flow & approach width has been determined for arterials having similar traffic conditions as on Nagole intersection ;( S=387W+1863 )
i) The Relationship between saturation flow & approach width has been determined for arterials having similar traffic conditions as on Chainamber intersection ( S=1514W-6289 )
j) By considering allthe intersections into account then developed relationship between saturation flow & approach width .that equation was given below. This equation represents the generalized equation for all other three intersections. (S=428W+1568 )
REFERENCES
1. Webster, F.V and Cobbe (1966),” Traffic Signals”, Road Research Technical Paper No.56, HMSO, London. 2. HCM (Highway Capacity Manual) 4th Edition (2000). Transportation Research Board, Washington D.C. 3. Leong,G.“A Unified Theory of Saturation Flow”, Paper presented at 85th Annual Meeting in Jan 2006.
4. Akcelik, R. (1981) Traffic signals: capacity and timing analysis. Australian Road Research Board (ARRB) Research Report No. 123 and Appendix, Australian Road Research Board, Melbourne: 12–22.
5. Branston, D.M. and J.H. Vanzuylen. (1978) The estimation of saturation flow, effective green time and passenger car equivalents at traffic signals by multiple linear regression.
6. Transportation Research, 12 (1): 47 - 33.
7. Branston, D.M and P. Gipps (1981) Some experience with a multiple linear regression method of estimating parameters of the traffic signal departure process. Transportation Research, 6A: 445-458.
8. Branston, D.M. (1977) Some factors affecting the capacity of signalized intersections. Traffic Engineering and Control, 20 (August/September): 390-396. 9. Highway Capacity Manual (1965), Transportation Research Board, Washington, D.C.
10. Holroyd, E.M. (1963) Effect of motorcycles and pedal cycles on saturation flow at traffic signals.Roads and Road Construction, 41: 315-316.
11. Hounsell, N.B. (1989) The design and performance of signal controlled intersections. Ph.D. thesis, Department of Civil Engineering, University of Southampton. 12. Ibrahim, W.H.W., L.L. Vien and A.F.M. Sadullah (2002) Determination of ideal saturation flow at signalized intersections under Malaysian road conditions.
Malaysian University Transportation Forum, University of Malaya, Kuala Lumpur: 304 – 311.
13. Kidwai, F.A. and M.W. Tan (2004) Capacity analysis of signalized urban intersection. AWAM-2004, UniversitiSains Malaysia, Pinang: 9H05-1 – 9H05-7. 14. Kimber, R.M. and M.C. Semmens (1983) Traffic signal junctions: a track appraisal of conventional and novel design. Transport and Road Research Laboratory,
Laboratory Report LR – 1063.
15. Kimber, R. M., M. McDonald and N. Hounsell (1986) The prediction of saturation flow for road junction controlled by traffic signal, Transport and Road Research Laboratory Report 67.
16. Kyte, M., Clemow, C., Mahfood, N., Lall, B. K. and Khisty, C. J. (1991).“Capacity and Delay characteristics of Two-way Stop-controlled intersections.” Transportation Research Record 1320, TRB, National Research Council, Washington, D.C., Pp. 160-167.