Different Types and Rates of Genome Evolution Detected by Comparative
Sequence Analysis of Orthologous Segments From Four Cereal Genomes
Wusirika Ramakrishna,* Jorge Dubcovsky,
†Yong-Jin Park,*
,1Carlos Busso,
†John Emberton,*
Phillip SanMiguel
‡and Jeffrey L. Bennetzen*
,2*Department of Biological Sciences, Purdue University, West Lafayette, Indiana 47907,†Department of Agronomy and Range Science, University of California, Davis, California 95616 and‡Purdue University Genomics Core,
WSLR, Purdue University, West Lafayette, Indiana 47907 Manuscript received April 18, 2002
Accepted for publication July 17, 2002
ABSTRACT
Orthologous regions in barley, rice, sorghum, and wheat were studied by bacterial artificial chromosome sequence analysis. General microcolinearity was observed for the four shared genes in this region. However, three genic rearrangements were observed. First, the rice region contains a cluster of 48 predicted small nucleolar RNA genes, but the comparable region from sorghum contains no homologous loci. Second, gene 2 was inverted in the barley lineage by an apparent unequal recombination after the ancestors of barley and wheat diverged, 11–15 million years ago (mya). Third, gene 4 underwent direct tandem duplication in a common ancestor of barley and wheat 29–41 mya. All four of the shared genes show the same synonymous substitution rate, but nonsynonymous substitution rates show significant variations between genes 4a and 4b, suggesting that gene 4b was largely released from the strong purifying selection that acts on gene 4a in both barley and wheat. Intergenic retrotransposon blocks, many of them organized as nested insertions, mostly account for the lower gene density of the barley and wheat regions. All but two of the retrotransposons were found in the regions between genes, while all but 2 of the 51 inverted repeat transposable elements were found as insertions in genic regions and outside the retrotransposon blocks.
T
HE grass (Poaceae) family of plants, including bar- miguelandBennetzen1998;Meyers et al.2001). Inbarley and wheat, it is also clear that much of the ge-ley, maize, millets, oat, rice, rye, sorghum, and
wheat, contributesⵑ60% of the world’s food produc- nome is composed of repetitive DNA and that much of
this repetitive DNA consists of retrotransposons (Pans-tion. Beyond their agronomic importance, these cereals
also serve as a model system for comparative genetics trugaet al.1998;Shirasuet al.2000;Steinet al.2000;
Wickeret al.2001;Sanmiguelet al.2002), but too few
(BennetzenandFreeling1993;Freeling2001), wherein
several species have highly developed molecular and genomic segments have been investigated to identify
any consistent patterns of arrangement. The smaller genetic tool kits plus a long history of detailed
physiolog-ical, developmental, and genetic characterization. grass genomes, including rice and sorghum, appear to
have both a lower amount of repetitive DNA and fewer One of the most significant differences in grass
ge-retrotransposons inserted between genes (Chen et al.
nomes is their nuclear DNA content, ranging from⬍200
1997, 1998; Tikhonov et al. 1999; Klein et al. 2000;
to⬎80,000 Mb (BennettandSmith1976;Bennettet
Tarchini et al. 2000). Further comparative DNA
se-al.2000). Among the cereals, the approximate haploid
quence analysis is needed to determine how these ge-DNA contents of rice, sorghum, maize, barley, and
dip-nomes differ in gene density and in the nature/organi-loid wheat are 430, 750, 2500, 4800, and 5700 Mb,
re-zation of repetitive DNAs in genic regions.
spectively (ArumuganathanandEarle1991). In maize,
Comparative genetic mapping of several cereal
ge-we know that most (⬎60%) of the nuclear genome is
nomes using DNA markers has shown that all can be composed of retrotransposons, often arranged as nested
depicted as simple variants of a single genetic map
insertions within insertions (Sanmiguelet al.1996;
San-(Mooreet al.1995;GaleandDevos1998). However,
a small number of large genomic rearrangements (com-monly full arm translocations or inversions) differenti-Sequence data from this article have been deposited with the
ate many of the genomes, and a certain percentage of EMBL/GenBank Data Libraries under accession nos. AY013246,
AY013245, AY09949, AF503433, and AF459639. DNA markers (perhaps as high as 30%) do not fit into
1Present address:Department of Bio-Resources, National Institute of
any clear colinear pattern (Bennetzen2000). Many of
Agricultural Biotechnology, Suwon 441-707, Republic of Korea.
the large rearrangements mark specific lineages, as in
2Corresponding author:Department of Biological Sciences, Hansen
the case of three translocations that occurred in the Bldg., Purdue University, West Lafayette, IN 47907.
E-mail: [email protected] Panicoideae ancestor that gave rise to maize, sorghum,
pearl millet, foxtail millet, and finger millet after their at very different rates, perhaps due to differences in selective pressure or to different local rates of mutation divergence from a common ancestor with barley, wheat,
and riceⵑ50–60 million years ago (mya;GaleandDevos (Wolfeet al. 1987, 1989a,b;Gaut 1998; Zhang et al.
2001). For instance, adh1 was found to evolve faster
1998).
Despite the general colinearity of their genetic maps, thanadh2 at nonsynonymous sites and at similar rates
at synonymous sites (Gautet al.1999). Overall, little is
we do not yet know the frequency or nature of the small
rearrangements that differentiate cereal genomes. Any known about substitution rate variations among nuclear
genes of grass genomes and how this phenomenon may
rearrangements smaller than a few centimorgans (e.g.,
several megabases) would have been missed by standard be related to local genome organization.
In this study, we present comparative sequence analy-comparative genetic maps. In the grasses, analy-comparative
genomic sequencing studies that involved genomic seg- sis of an orthologous chromosomal region from barley,
rice, sorghum, and wheat. Our analyses indicate the
ments ⬎30 kb have been limited to maize, sorghum,
and rice for thesh2/a1region (Chenet al.1997, 1998), frequency, nature, and lineages of several different types
of genome evolution. These include variation in gene
maize and sorghum for theadh1region (Tikhonovet
al.1999), and barley and rice for a region near theVrn1 order and number, differences in the local rates of
nu-cleotide variation, and patterns of transposable element
gene (Dubcovskyet al.2001). These studies indicated
that only the genes were conserved in these segments, accumulation. These combined studies provide a first
indication of the value of a multi-species analysis of local but that some small rearrangements involving one or
two genes had occurred also. Because so few segments genome structure and evolution in the Poaceae.
and species were investigated in each study, no overall patterns could be discerned.
MATERIALS AND METHODS Comparative sequence analysis of small genomic
re-gions (14–23 kb) at theLrk/Takloci in wheat and homol- BAC selection, restriction mapping, and sequencing:
Re-ogous regions from barley, maize, and rice uncovered striction fragment length polymorphism (RFLP) marker
a high gene density and numerous rearrangements WG644 was used to screen the Morex barley bacterial artificial
chromosome (BAC) library (Yuet al.2000), theHindIII BAC
(Feuillet and Keller 1999). This observation is not
library made from Nipponbare rice DNA (http://www.genome. surprising for disease resistance genes of this type, which
clemson.edu/orders/lib_desc/nippon.html), the HindIII BAC are organized in tandem clusters that tend to undergo
library made from Btx623 sorghum DNA (http://www.genome.
rapid reorganization. clemson.edu/orders/lib_desc/SB_BBc.html), and the HindIII
In all grasses studied, gene density has been higher BAC library made from DV92 diploid wheat DNA (Lijavetzky
et al.1999).The diploid wheat and sorghum libraries were than that predicted for a random dispersal of genes.
also screened with probes corresponding to different genes Because investigators have always begun their studies
of barley and rice BACs (Dubcovskyet al.2001) to identify by selecting a clone that contained a gene, an inherent
the orthologous BAC. Positive BACs were fingerprinted with
bias was present in the gene-density outcome. Regard- restriction enzymeHindIII, transferred to nylon membranes,
less, the observed gene densities in barley and wheat and hybridized to confirm that all BACs contained the
homolo-gous locus. sequences (15–22 and 5–42 kb, respectively) are much
Restriction maps of 36I5 (rice), 635P2 (barley), 116F2 (dip-lower than the 200–250 kb/gene that would be
pre-loid wheat), 115G1 (dippre-loid wheat), and 170F8 (sorghum)
dicted by random dispersal (KellerandFeuillet2000;
were constructed to experimentally validate computer se-Shirasu et al. 2000; Dubcovsky et al.2001; Feuillet quence assembly. This experimental confirmation was impor-et al.2001;Wickeret al.2001). Cytogenetic studies also tant to determine the effect of large retroelements with large
strongly support the existence of gene-rich islands in direct repeats on the assembly algorithms. BACs were
individu-ally digested with the 8-bp specificity restriction enzymesAscI,
barley and wheat (Gillet al.1996a,b;Fariset al.2000;
NotI,PacI,PmeI, andSwaI. All possible single and double diges-Kunzel et al.2000).
tions were analyzed for restriction enzymes with one or more
In dicotyledonous plants, comparative sequence anal- sites within the mapped BAC. Restriction fragments were
sepa-yses involving large genomic segments are restricted to rated by pulsed-field electrophoresis, as described earlier
comparisons withArabidopsis thaliana, a species that has (Dubcovskyet al.2001).
Preparation of shotgun libraries, sequencing, and analysis undergone a very high frequency of ancestral
rearrange-were as described byDubcovskyet al.(2001). For completing ments involving small chromosomal segments, primarily
BAC sequences, gaps were closed by a combination of different
genic deletions (Lagercrantz1998;Blancet al.2000;
approaches, including the use of different sequence chemis-Ku et al. 2000; O’Neill and Bancroft 2000; Vision tries, the thermofidelase enzyme, PCR amplification of gaps, et al. 2000). Extensive chromosomal rearrangement is shotgun sequencing of transposon-inserted subclones that span a gap, and direct sequencing of BAC template. When observed between Arabidopsis and Brassica species
gaps were due to repetitive regions, subclones that either
(O’Neill and Bancroft 2000). However, significant
started or ended in unique regions with the remaining portion residual microcolinearity is observed between
Arabi-in the repetitive region were assembled separately and Arabi-inserted
dopsis and its close relative, Capsella, two species that into the main assembly.
diverged 6–10 mya (Rossberget al.2001). Sequence analysis:Annotation and sequence analysis were
FGENESH (http://www.softberry.com/nucleo.html) with the of the rice BAC were sequenced (accession nos. AY013246, maize training set was used for gene prediction in addition AY013245, AY099491, AF503433, and AF459639) by a to GENSCAN (http://genes.mit.edu/GENSCAN.html) and
shotgun approach like that described earlier (Dubcov-GeneMark.hmm (http://genemark.biology.gatech.edu/Gene
skyet al.2001). The final error rate was⬍1 bp/10 kb Mark/).
Estimation of nucleotide substitution rates and phylogenetic and the consensus sequence was of high quality reconstructions: Genes were aligned using CLUSTALX (PHRED value ofⱖ25). The two diploid wheat (Triticum
(Thompsonet al.1997). Rates of nucleotide substitution were
monococcum) BACs formed a 215-kb contiguous se-estimated using the distance measures ofNeiandGojobori
quence with 20,573 bp of overlap. The genome
se-(1986) and the Jukes-Cantor correction as implemented in
quences from BACs Hv635P2, Sb170F8, and Tm115G1/ the MEGA2 (molecular evolutionary genetic analysis) package
(Kumaret al.2001). Phylogenetic reconstructions were per- 116F2 are 102,433, 142,376, and 215,220 bp,
respec-formed by the neighbor-joining method, with synonymous tively. The insert in BAC Os36I5 isⵑ75 kb. This BAC sites for the analyses. Synonymous and nonsynonymous
substi-has two regions of contiguous sequence of 65.5 and 5.8 tution rates were estimated as described byGautet al.(1996).
kb, with a gap ofⵑ3.7 kb that we have been unable to
Divergence and duplication times (T) were estimated for all
genes, except those shown by relative rate tests to be evolving close (Figure 1). In every case, restriction maps of the BAC at different rates, usingk⫽Ks/2T. kis the absolute rate of clones agree completely with the sequence assemblies.
synonymous substitution/site/year;Ksis the estimated num- Gene content and organization in the sequenced
ber of synonymous substitutions per site between homologous
clones:As previously reported (Dubcovskyet al.2001), sequences and from the neighbor-joining trees generated
us-barley BAC Hv635P2 contains five predicted genes, four ing the MEGA2 package.
Relative rate tests: Relative rate tests were used to assess long terminal repeat (LTR) retrotransposons, a solo heterogeneity in the numbers of substitutions per site esti- LTR ofBAGY-2(Shirasuet al.2000), a LINE retropo-mated from the one-parameter method (JukesandCantor
son, at least nine miniature inverted repeat transposable 1969). Tajima’s relative rate test was used as implemented in
elements (MITEs), and aMutator-like transposable
ele-MEGA2 for testing the molecular clock hypothesis because it
can be applied even when the substitution rate varies among ment (Figure 1). Two inverted repeats flank barley gene different sites (Tajima 1993). We used this test as imple- 2 and a novel transposable element,Inysub, is inserted mented in MEGA2. It compares two sequences with an out- in the rightward inverted repeat.
group sequence and counts the number of unique
substi-Rice BAC Os36I5 has eight predicted genes, one LTR tutions in both lineages. When one of the two sequences
retrotransposon, oneMutatortransposable element, and
accumulates a significantly larger number of substitutions, it
indicates that the molecular clock hypothesis can be rejected. at least 12 MITEs. Gene 6 is a hypothetical gene with no significant similarity to any known gene, protein, or expressed sequence tag (EST), but has been postulated
RESULTS to be a gene by all three gene prediction programs.
The predicted protein product of gene 7 shows highest Isolation and sequencing of orthologous barley, rice,
homology to an Arabidopsis unknown protein (NP189-sorghum, and wheat BACs:To study genomic
organiza-619, 1e-42). Gene 7 of rice is orthologous to sorghum
tion near theVrn1locus, BACs Hv635P2, Os36I5, Sb170F8,
gene 6. The predicted gene 8 protein product shows and Tm115G1/Tm116F2 were selected by their
hybridiza-highest homology to an Arabidopsis ribosomal protein tion to DNA marker WG644. WG644 had been mapped
(NP199657, 3e-45) and was also conserved as sorghum to orthologous regions in rice, barley, and wheat
(Klein-gene 7. However, (Klein-gene 8 appears to be a pseudo(Klein-gene hofs et al. 1993; Dubcovsky et al. 1998; Sarma et al.
in rice because it has a stop codon in the first predicted 1998). Colinearity between the long arm of rice
chromo-coding exon. In addition, exon 4 (the last exon) is some 3 and the long arm of homeologous group 5 in
missing in the rice BAC. Downstream of this region, a the Triticeae has been studied extensively because of
single 1.9-kb segment is repeated four times (94.8–99% the presence of vernalization and frost tolerance genes
sequence identity). A fifth repeat is truncated at the
Vrn1andFr1in wheat and barley and the heading date
end and extends into the unsequenced gap. This 1.9-kb
genehd6in rice (Dubcovsky et al.1998; Sarmaet al.
repeat shows homology to rice small nucleolar RNA
1998;Katoet al.1999;Sutkaet al.1999). The DNA on
(snoRNA) genes that are organized in a cluster (AJ310-the sorghum BAC has not been mapped to (AJ310-the sorghum
377). Each cluster in the rice BAC, Os36I5, has 10 genetic map, but all selected sorghum clones formed a
snoRNA-like genes that show homology (93–99%) to single contiguous set, indicating that there was only one
snoRNA genes ranging from 79 bp (AJ307932) to 188 homologous region in sorghum.
bp (AJ320263). The last cluster contains eight candidate Previously, we reported the sequence of one of these
snoRNA genes. snoRNAs are small in size and essential BACs (barley clone Hv635P2) and part (50 kb) of the
for processing ribosomal RNAs (Leaderet al.1997,1999;
rice BAC Os36I5 (Dubcovskyet al.2001). Transposable
Brown et al. 2001). Plant snoRNA gene clusters are element composition, dinucleotide arrangement, and
transcribed as a polycistronic pre-snoRNA transcript recombination frequencies have also been reported for
(Leaderet al.1997, 1999). A comparable snoRNA gene
the wheat region (Sanmiguel et al. 2002). The three
Figure
1.—Microcolinearity
of
an
orthologous
region
in
barley,
rice,
sorghum,
and
d
iploid
wheat.
Arrows
indicate
genes,
plus
their
size
and
p
roposed
direc
tion
o
f
transcription.
Nested
insertions
of
retrotransposons
are
shown
in
barley
and
d
iploid
wheat.
Asterisks
indicate
simple
sequence
repeats
that
conta
in
tandem
repeat
numbers
of
eight
o
r
more.
MITEs
are
indicated
by
small
triangles.
In
the
rice
BAC,
a
d
ashed
line
represents
a
region
with
homology
to
a
cluster
of
rice
small
nucle
olar
RNA
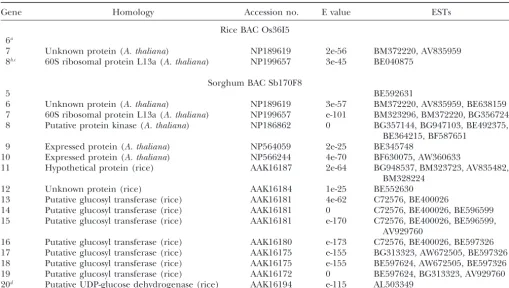
TABLE 1
Predicted genes in BACs Os36I5 and Sb170F8
Gene Homology Accession no. E value ESTs
Rice BAC Os36I5 6a
7 Unknown protein (A. thaliana) NP189619 2e-56 BM372220, AV835959
8b,c 60S ribosomal protein L13a (A. thaliana) NP199657 3e-45 BE040875
Sorghum BAC Sb170F8
5 BE592631
6 Unknown protein (A. thaliana) NP189619 3e-57 BM372220, AV835959, BE638159
7 60S ribosomal protein L13a (A. thaliana) NP199657 e-101 BM323296, BM372220, BG356724
8 Putative protein kinase (A. thaliana) NP186862 0 BG357144, BG947103, BE492375,
BE364215, BF587651
9 Expressed protein (A. thaliana) NP564059 2e-25 BE345748
10 Expressed protein (A. thaliana) NP566244 4e-70 BF630075, AW360633
11 Hypothetical protein (rice) AAK16187 2e-64 BG948537, BM323723, AV835482,
BM328224
12 Unknown protein (rice) AAK16184 1e-25 BE552630
13 Putative glucosyl transferase (rice) AAK16181 4e-62 C72576, BE400026
14 Putative glucosyl transferase (rice) AAK16181 0 C72576, BE400026, BE596599
15 Putative glucosyl transferase (rice) AAK16181 e-170 C72576, BE400026, BE596599, AV929760
16 Putative glucosyl transferase (rice) AAK16180 e-173 C72576, BE400026, BE597326
17 Putative glucosyl transferase (rice) AAK16175 e-155 BG313323, AW672505, BE597326
18 Putative glucosyl transferase (rice) AAK16175 e-155 BE597624, AW672505, BE597326
19 Putative glucosyl transferase (rice) AAK16172 0 BE597624, BG313323, AV929760
20d Putative UDP-glucose dehydrogenase (rice) AAK16194 e-115 AL503349
Predicted protein products of barley, rice, sorghum, and wheat genes 1, 2, 3, and 4 show homology to mitochondrial carrier protein, cleavage stimulation factor subunit 1, serine/threonine kinase, and ABC-transporter-like protein, respectively (Dubcovsky
et al.2001). Genes 7 and 8 of rice are colinear with genes 6 and 7 of sorghum. Genes 11–20 of sorghum are colinear with a segment of a rice BAC (accession no. AC079887) that maps close to Os36I5. Rice BAC Os36I5 has five clusters with homology to snoRNA genes. Each cluster has 10 snoRNA-like genes except the last cluster, which has 8 snoRNA-like genes.
aHypothetical gene. bTruncated genes.
cStop codon in the middle of the truncated gene. dPartial gene located at the end of the BAC.
sorghum BAC, Sb170F8. Identified homologies are shown genes, respectively (Figure 1). Within these genic
re-gions, the average gene density is one gene per 8.4 kb. in Table 1.
The sorghum genomic segment in BAC Sb170F8 con- Mobile DNA organization:The majority of the
retro-transposons in wheat were similar to those previously tains 20 predicted genes, two LTR retrotransposons,
and at least 20 MITEs (Figure 1). At the most-leftward identified in barley and wheat (Panstrugaet al.1998;
Shirasuet al. 2000; Wickeret al. 2001), although we end of the BAC is a partial retrotransposon (Figure 1).
The predicted gene 5 of sorghum shows 100% identity discovered and named six new elements (Eway,Latidu,
Miuse,Nusif,Veju, andWham). We also discovered new to a sorghum EST (BE592631). The sorghum BAC also
has a cluster of putative glucosyl transferase genes (genes retrotransposons in barley (Inav,Ikeros, andSedef), rice
(Alulu), and sorghum (Pyrubu and Unum). Over one-13–19). Interestingly, all but genes 8–11 are in the same
transcriptional orientation on this BAC. In fact, for all half of the retrotransposons in the wheat BACs are
orga-nized in a nested fashion like that seen in the maize BACs investigated, only these 4 genes and gene 2 on
the barley BAC are in the opposite transcriptional orga- genome (Sanmiguel et al. 1996). The 21 LTR
retro-transposons comprise ⵑ160 kb of the 215-kb region.
nization from all other genes (Figure 1).
The contiguous sequence contained on diploid wheat These retroelements were named by the approach
de-scribed inSanmiguelet al.(2002). Nested insertions of
BACs Tm115G1 and Tm116F2 harbors five predicted
genes and 21 intact or partially deleted LTR retrotranspo- LTR retrotransposons were found only on wheat BACs,
except in the case of barley BAC Hv635P2, where one sons. As in barley, gene 4 is tandemly duplicated. Within
the 215-kb wheat sequence, the five genes are arranged BARE-1element was inserted in the opposite orientation
into anotherBARE-1element.
BARE-1-like retrotransposons have been named An- tors but after their divergence from rice and sorghum ancestors. Alternatively, the duplicated gene may have
gelain wheat (Wickeret al.2001) and constituteⵑ11%
of the wheat region. Solo LTRs were not found in any been lost from the rice and sorghum lineages.
Intron-exon and exon-intron boundaries were
ana-of the sequenced regions except a BAGY-2 solo LTR
in barley.Sabrina-like andWhamLTR retrotransposons lyzed for the four genes that were common among the
four genomes. These four genes were also compared constitute 10 and 9% of the sequenced wheat region,
respectively. Overall, there are nine largely intact LTR to the most closely related genes in Arabidopsis. In the
grasses, exon-intron boundaries predominantly exhibit retrotransposons in addition to several partial elements
in the wheat region. Angela elements appear to show the sequence GT/A (56%), followed by GT/G (26%)
as the next most frequent. This compares to 62% GT/A the most recent insertional activity, because none of
them contain another inserted LTR retrotransposon. and 14% GT/G in Arabidopsis. Intron-exon boundaries
are C/AG (78%) or T/AG (22%) in the grass genomes, Five of the identified retroelements (not including the
two partial Angela elements at the ends of the BAC compared to 63% C/AG and 29% T/AG in the putative
orthologous genes in Arabidopsis. Hence, the grasses contig) were partly deleted. Sorghum BAC Sb170F8
con-tains two novel LTR retrotransposons,UnumandPyrubu, show a narrower range of variation in intron splicing
sites than is seen in Arabidopsis. and a partial LTR retrotransposon that together account
forⵑ15% of the 142-kb BAC insert. Rice BAC Os36I5 Expansion of intergenic spaces was largely caused by
LTR retrotransposon insertion in barley and wheat
(Fig-contains a retrotransposon,Alulu. All retrotransposons
except one (Unum inserted in intron 13 of sorghum ure 2). Retrotransposons account forⵑ60, 8, 15, and
70% of the sequenced barley, rice, sorghum, and wheat gene 3) were found in the intergenic regions.
MITEs are equally numerous, relative to genes, in all regions, respectively. However, none of the
retrotrans-posons, MITEs, or other mobile elements were in or-regions. Identified MITEs include 9 in barley, 12 in rice,
20 in sorghum, and 10 in wheat. On average, there are thologous locations, except a small truncated element
of 752 bp in Hv635P2, which was conserved in Tm115G1/ 2 MITEs per gene in barley, rice, and wheat. In sorghum,
the ends of at least eight more MITE-like elements could 116F2 (84% identity; Figure 1) and was similar (84–89%
identities) to parts of the LTR of theBarbaraelement
not be determined. With two exceptions (one each in
barley and wheat), all MITEs were found as insertions (AF326781;Wickeret al.2001). Hence, almost all these
elements were inserted after the ancestors of these spe-in the genic regions. A MITE is spe-inserted spe-in the LTR
retrotransposon Inav in barley, and a second MITE is cies diverged from each other.
Detailed comparison of the homologous barley and inserted in a partial element (downstream of the first
partialAngela) in wheat that has homology toRIRE2. wheat regions:Exons and introns in the five common
genes between wheat and barley were well conserved, Comparison of orthologous barley, rice, sorghum, and
wheat regions:Four predicted genes are conserved across facilitating a comprehensive analysis of these sequences. The coding regions of the five genes were very similar, the four genomes in this study. However, they are
dis-tributed across 102 kb in barley, 30 kb in rice, 35 kb in varying from 95.9 to 97.5% identity at the DNA level.
The 16 predicted exon-intron boundaries found within sorghum, and 215 kb in diploid wheat (Figure 2).
Adjacent to the four conserved genes, the sorghum a codon and the noncanonical 5⬘“GC” splice site at the
end of exon 6 in gene 4 were all conserved between BAC shares two additional genes (6 and 7) with rice BAC
Os36I5 (Figure 2). In addition, the predicted protein barley and wheat, as they were between barley and rice
(Dubcovsky et al. 2001). These perfect alignments of
product (116 amino acids) of a divergent gene (gene
6) in rice has a small stretch of similarity (63% identity barley and wheat exons facilitated the delimitation of
homeologous intron regions. The total intron size for in a region of 19 amino acids) to the predicted protein
product (117 amino acids) of sorghum gene 5. Sorghum these five genes (66 introns) was 16,442 bp in barley and
15,972 bp in wheat, of which 15,182 bp were aligned. genes 11–20 are colinear with a segment of a rice BAC
(AC079887) in the GenBank database. This BAC is down- Introns were very similar in barley and wheat, ranging
from 86.1 to 89.5% identity. stream from Os36I5 and includes RFLP marker R2404,
which is 0.3 cM from marker R2311 located in Os36I5 A different proportion of transitions and
transver-sions was observed between introns and exons. In the on chromosome 3. The cluster of putative glucosyl
trans-ferase genes (genes 13–19) in the sorghum BAC, Sb170F8, exons, 66% of the 273 point mutations were transitions
and 34% were transversions. In the introns, 58.3% of is also present in the rice BAC (AC079887). Sorghum
has seven of these genes, compared to five in rice. the 1284 point mutations were transitions and 41.7%
were transversions. An analysis of variance of the transi-Gene 2 is in inverted orientation in barley relative
to rice, sorghum, and wheat. This indicates that the tion proportions using the five genes as replicates
indi-cated that this difference was significant atP⬍ 0.05.
inversion occurred in the barley lineage after wheat and
barley ancestors diverged. Gene 4 is duplicated in both The unaligned portions of the introns (20%) were
caused by insertions of 10 MITEs or MITE-like elements, barley and wheat, suggesting that this duplication
Figure2.—Comparison of an orthologous region in barley, rice, sorghum, and diploid wheat. The compactness of rice and sorghum genomes is evident compared to barley and diploid wheat genomes. Lines connect the genes that are common among the BACs. Gene 5 of sorghum and gene 6 of rice (connected by a dotted line) show limited sequence homology and may not be truly orthologous. Large transposons are shown as blocks. Arrows indicate genes and their transcriptional orientation.
200 bp), two large indels (395 and 1532 bp), and three are often correlated (Wolfe and Sharp 1993). The
Ka/Ks ratio indicates the level of selective constraint regions of gene 4b (introns 1, 2, and 16) that showed
unusually low levels of conservation and could not be acting on proteins. For most of the comparisons for
genes 1–4, Ka and Ks were also correlated (r ⫽ 0.82,
accurately aligned. The presence of 10 MITEs or
MITE-like elements in these five genes indicates an average P ⬍ 0.0001; Table 2). The data show that gene 4 is
highly constrained in its nonsynonymous substitution insertion rate of approximately one
insertion/gene/evolu-tionary lineage/10 million years. The predicted MITEs rate in rice and sorghum, but only gene 4a is similarly
constrained in barley and wheat (Figure 3). In fact, gene (or remainders of partially deleted MITEs) varied in
length from 17 to 226 bp and all showed duplication 4a shows a decrease in its nonsynonymous substitution
rate in the barley-wheat comparison, resulting in aKa/Ks
of short host sequences (generally TA) and the presence
of perfect or imperfect inverted repeats. These apparent ratio of 0.03 that indicates an increase in purifying
selec-tion. insertions accounted for an increase of 1249 bp in the
size of the introns. To estimate whether the four genes conserved among
the four genomes are evolving at different rates, two-Most of the other indels were small, including 1 bp
(32%), 2 bp (22%), 3 bp (10%), or 4 bp (8%) events. tailedt-tests were performed for different gene pairs.P
values were significant at a 5% level only for compari-However, the largest amount of indel size variation in
these 66 introns was provided by the 19 intermediate sons ofKsvalues of gene 4b with genes 1, 3, and 4a after
correction for multiple tests (P ⬍0.002,␣ ⫽ 0.0051).
(831 bp total) and 2 large (1927 bp total) indels. To
understand the possible origin of these indels, we com- Comparisons of Ka for different gene pairs showed 5
out of 10 comparisons to be statistically significant at a pared their flanking regions. Forty-four percent of the
indels of three or more base pairs included perfect short 5% level after correction for multiple tests (P⬍0.0037,
␣ ⫽0.0051). This suggests more variable
nonsynony-direct repeats in one border of the indel and in the
opposite border of the paired region between barley mous substitution rates than synonymous substitution
rates among these four genes. and wheat. This proportion increased to 65% with the
inclusion of direct repeats with 1 bp difference among To estimate the time of duplication of gene 4 and
the divergence of wheat and barley, the synonymous
repeats (⬎4 bp) or 1–2 bp away from the exact border
of the indel. substitution rates must not differ significantly and the
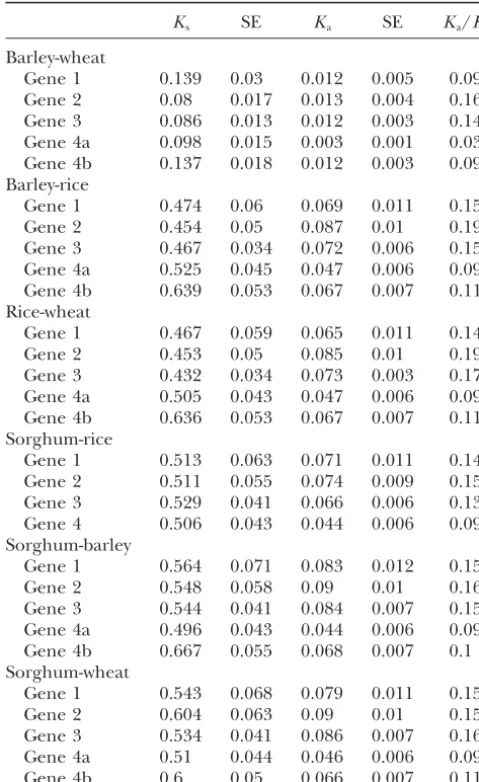
duplicated sequences must evolve at similar rates after Nucleotide substitution rates: Synonymous (Ks) and
TABLE 2 bins (1981). Molecular data indicate that the diver-gence of the rice lineage from the lineages giving rise Number of synonymous (Ks) and nonsynonymous (Ka)
to barley, sorghum, and wheat occurred 50–70 mya substitutions per site among barley, rice, sorghum, and
(Wolfeet al. 1989a). Therefore, 60 mya was taken as
wheat for four genes inVrn1region
the divergence time between rice and barley/wheat. We
Ks SE Ka SE Ka/Ks used average synonymous substitution rates for the rice
and barley/wheat divergence to estimate absolute syn-Barley-wheat
onymous substitution rates. The average synonymous
Gene 1 0.139 0.03 0.012 0.005 0.09
substitution rate of theadh1andadh2genes in grasses
Gene 2 0.08 0.017 0.013 0.004 0.16
was reported to be 6.5⫻10⫺9substitutions/synonymous
Gene 3 0.086 0.013 0.012 0.003 0.14
Gene 4a 0.098 0.015 0.003 0.001 0.03 site/year (Gautet al.1996). The average for six nuclear Gene 4b 0.137 0.018 0.012 0.003 0.09 genes (adh1,adh2,waxy,shrunken1,gapC, and chalcone
Barley-rice synthase) between maize and wheat or barley was
re-Gene 1 0.474 0.06 0.069 0.011 0.15 ported to be 6.1⫻10⫺9substitutions/synonymous site/
Gene 2 0.454 0.05 0.087 0.01 0.19
year (Wolfe et al1989b). Our estimate is 4.2 ⫻ 10⫺9
Gene 3 0.467 0.034 0.072 0.006 0.15
substitutions/synonymous site/year based on genes 1–4
Gene 4a 0.525 0.045 0.047 0.006 0.09
of rice and wheat and a divergence time of 60 mya. On
Gene 4b 0.639 0.053 0.067 0.007 0.11
Rice-wheat the basis of our estimates, the ancestors of barley and
Gene 1 0.467 0.059 0.065 0.011 0.14 wheat diverged from each other 11–15 mya, which is in Gene 2 0.453 0.05 0.085 0.01 0.19 a similar range (10–14 mya) to that estimated byWolfe
Gene 3 0.432 0.034 0.073 0.003 0.17
et al.(1989a).
Gene 4a 0.505 0.043 0.047 0.006 0.09
Using our calculated rate of sequence divergence, we
Gene 4b 0.636 0.053 0.067 0.007 0.11
determined that the duplication of gene 4 in aTriticeae
Sorghum-rice
ancestor occurred 29–41 mya, many millions of years
Gene 1 0.513 0.063 0.071 0.011 0.14
Gene 2 0.511 0.055 0.074 0.009 0.15 after this lineage diverged from ancestral lineages that Gene 3 0.529 0.041 0.066 0.006 0.13 gave rise to rice or sorghum. Hence, our data are more Gene 4 0.506 0.043 0.044 0.006 0.09 consistent with a duplication of gene 4 that occurred
Sorghum-barley specifically in a shared ancestor of barley and wheat
Gene 1 0.564 0.071 0.083 0.012 0.15
than it is with a model proposing deletion of one gene
Gene 2 0.548 0.058 0.09 0.01 0.16
4 copy from the rice/sorghum or rice and sorghum
Gene 3 0.544 0.041 0.084 0.007 0.15
lineages.
Gene 4a 0.496 0.043 0.044 0.006 0.09
Gene 4b 0.667 0.055 0.068 0.007 0.1
Sorghum-wheat
DISCUSSION
Gene 1 0.543 0.068 0.079 0.011 0.15
Gene 2 0.604 0.063 0.09 0.01 0.15
Types and times of genic rearrangement:
Compara-Gene 3 0.534 0.041 0.086 0.007 0.16
tive sequence analysis can provide a wealth of
informa-Gene 4a 0.51 0.044 0.046 0.006 0.09
tion about the nature of sequence arrangement and
Gene 4b 0.6 0.05 0.066 0.007 0.11
evolution, including gene content, order, and orienta-KsandKaare the number of substitutions per synonymous tion. Microcolinearity among grass genomes has been
and nonsynonymous site, respectively (calculated by the method
shown by the sequencing of genomic segments from of Nei-Gojobori using the Jukes-Cantor correction). Genes 4a
orthologous loci from rice, maize, sorghum, barley, and and 4b represent duplicated genes in wheat and barley. SE,
standard error. wheat (Chenet al.1997;Tikhonovet al.1999;
Dubcov-sky et al. 2001; Feuillet et al. 2001). In the present study, comparative sequence analysis of orthologous
ge-was used to scan for substitution rate heterogeneity in nomic segments of barley, rice, sorghum, and wheat
the four genes conserved in the four grass genomes. revealed two small genic rearrangements. Gene 2 was
Rice was taken as an outgroup to estimate relative rates inverted in barley relative to the other three genomes
of genes 1–4 in barley and wheat. Relative rate tests studied, probably by unequal recombination between
showed that synonymous substitution rate variations inverted repeats flanking the gene, after the ancestors
were not significant for genes 1–4. However, highly sig- of barley and wheat diverged from each other. It is
nificant variations in nonsynonymous substitution rates likely that the duplication of gene 4 occurred before the
were observed between genes 4a and 4b. Therefore, divergence of barley and wheat, because the duplicated
synonymous substitutions were used to estimate diver- genes are present in these two genomes but absent in
gence times. Relative rate tests and nucleotide substitu- rice and sorghum.
tion rates show that gene 4b is evolving at a faster rate One dramatic variation between the studied regions
compared to gene 4a (Figure 3 and Table 3). is a difference in the presence of an entire duplicated
gene family in the comparison of rice and sorghum.
Steb-Figure 3.—Nucleotide substitution rates of genes 1–4 among different grass genomes. (A) Synonymous substitution (Ks) rates show
less variation. Bars repre-sentKsfor pairwise
compari-sons between different grass genomes for four or five genes. Line extensions on top of the bars represent standard error values. (B) Nonsynonymous substitu-tion (Ka) rates vary by
sever-alfold. Bars and line exten-sions are as described in A except they are forKavalues.
Rice BAC Os36I5 contains at least 48 candidate snoRNA density of the wheat genome were mostly based on
dis-ease resistance genes (Steinet al.2000;Feuilletet al.
genes in five clusters, none of which are present in the
comparable sorghum region. This lack of colinear loca- 2001;Wickeret al.2001), which are largely exceptional
in their organization and lack of stability (Leisteret al.
tion is also observed with rDNA repeats, storage protein
gene clusters, and tandem disease resistance genes 1998; Hulbert et al. 2001; Richly et al. 2002). The
map position of Vrn1 places it in a region (between
(Dubcovsky and Dvorak 1995; Leister et al. 1998;
Richly et al. 2002; J. Messing, personal communica- breakpoints in deletion lines 5AL-6 and 5AL-17) that
undergoes a moderate level of recombination (Gillet
tion). It is not clear why tandem gene clusters should
be less stable in genomic location. However, when this al. 1996b) and, thus, it should be an average genic
region of the wheat genome. In our study, sorghum property is shared by several different types of clustered
genes, it suggests that this is a consistent and evolved had the highest gene density of one gene per 7 kb,
while rice (excluding the snoRNA loci), barley, and property of higher plant genomes.
Distribution and density of genes and repeats:Gene diploid wheat had gene densities of one gene per 9, 20, and 43 kb, respectively. These observed gene densities
density in species from theTriticeaetribe with large
ge-nomes such as barley and wheat is of immense interest. compare to predicted respective gene densities of one
per 25, 15, 160, and 190 kb for a random gene dispersal The large difference between expected and observed
gene density in barley and wheat (KellerandFeuillet model if each of these species containsⵑ30,000 genes.
Hence, all species show higher-than-random gene densi-2000) and studies based on GC composition (Barakat
et al.1997) and cytogenetics (Gillet al.1996a,b;Faris ties, but this effect is much more pronounced for the large genomes. This result suggests that most of the et al.2000) support the hypothesis that gene-rich regions
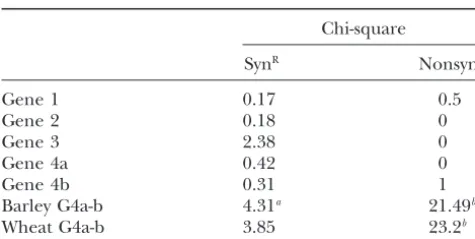
TABLE 3 lineage per 11 million years. If the indels (including the two large indels of uncertain origin) are assumed Tajima’s relative rate tests
to be deletions, they would have removed at least 3.5 kb of an 18.5-kb region of aligned intron sequences Chi-square
in the last 11–15 million years. These deletions could
SynR NonsynR
provide an adequate counterbalance to the increase in size originated by transposon insertion in barley, wheat,
Gene 1 0.17 0.5
Gene 2 0.18 0 and other plant species.
Gene 3 2.38 0 In the present study, we compared the modes and
Gene 4a 0.42 0 rates of evolution of four orthologous genes that are
Gene 4b 0.31 1
next to each other in the four cereal genomes. Our data
Barley G4a-b 4.31a 21.49b
indicate that the synonymous substitutions evolve at a
Wheat G4a-b 3.85 23.2b
more uniform rate than nonsynonymous substitutions, Barley and wheat are ingroups with rice as an outgroup not only among different genes but also in different except in the last two cases where the ingroups are barley lineages.
genes 4a and 4b and wheat genes 4a and 4b, respectively.
Rice-sorghum and wheat-barley (Triticeae) are
sepa-SynR, synonymous substitution rate; NonsynR, nonsynonymous
rately derived from ancestors that diverged 50–70 mya rate.
aSignificant at 5% level. (Wolfeet al.1989a). We used this date and synonymous
bSignificant at 0.1% level.
substitutions to estimate divergence and duplication
times. Genes 1–4 show 4.2⫻10⫺9substitutions per
syn-onymous site per year, which is close to that reported
regions, like paracentromeric heterochromatin, as is previously for grass genomes (Wolfeet al.1989b;Gaut
also suggested by cytogenetic studies (Gillet al.1996a,b; et al. 1996). Our data suggest that the duplication of
Fariset al.2000). gene 4 occurred 29–41 mya. This conclusion is also
We identified numerous novel LTR retrotransposons supported by the absence of the duplicated gene 4 in the
in the sequenced regions and found that retrotranspo- orthologous region in both rice and sorghum. However,
sons constitute⬎70% of the 215-kb region sequenced the duplication may have happened earlier, if it was
in wheat. Retrotransposons and genes are organized in followed by rounds of unequal gene conversion.
separate clusters in wheat and to a lesser extent in barley. Nonsynonymous substitutions tend to be
uninforma-The most striking features in the wheat region are the tive over short evolutionary time periods, partly because
nested insertions of retrotransposons. Hence, the pref- they are subject to positive selection. We found that the
erential insertion of the abundant classes of retro- nonsynonymous substitution rates deviated significantly
transposons into each other reported in maize (Sanmi- from clock-like behavior after duplication of gene 4, as
guelet al.1996) appears to be a general characteristic revealed by relative rate tests. Similar variations were
of the wheat genome. In addition, we found that MITEs observed between the two duplicated grass adh loci
in wheat and barley also show the preferential accumula- (Gautet al.1996). In contrast, several of the 26 groups
tion near genes that has been reported in maize (Bureau of duplicated genes analyzed in zebra fish showed
sig-andWessler1994;Tikhonovet al.1999). As in maize nificant differences in the rate of evolution as measured
(Sanmiguelet al.1998), all of the LTR retrotransposons by bothKaandKs(Van de Peer et al. 2001). In nine
discovered in this study appear to be of recent origin, genomes previously studied (including Arabidopsis and
partly evidenced by the lack of orthologous elements rice), duplicated genes were found to arise at a rate
inserted in the barley and wheat regions. This may re- averaging 0.01 duplications/gene/million years (Lynch
flect a recent explosion in LTR retrotransposon activity and Conery 2000). However, these duplicated genes
in these lineages (accounting for the large overall ge- often have a short half-life, 23.4 million years, for
in-nome size) or may indicate relatively rapid removal of stance, in Arabidopsis (LynchandConery2001).
Bio-older transposon sequences (Devoset al.2002). logical innovation and functional diversification can
Mutation, selection, and drift:Comparison of barley lead to evolution of new functions for duplicated genes.
and wheat genic regions revealed several interesting In fact, gene 4a seems to be the most conserved locus
features. The ubiquitous presence of direct tandem re- of the four genes compared, while gene 4b is the least
peats in the indels suggests that replication slippage, conserved. Thus, these duplicated genes appear to be
illegitimate recombination (Devos et al. 2002), and/ on different evolutionary routes that may lead (or may
or transposable element excision were responsible for have already led) to a new role for gene 4b.
these indels. If all the indels⬎4 bp and flanked by perfect Small-scale gene rearrangements have been found in
repeats were considered scars from transposon activity, other eukaryotic genome comparisons and can be a
the previous estimate of the rate of transposon insertion major factor in speciation and genome evolution (Wolfe
would change from 1 to 2.2 (or 2.6 if imperfect repeats andShields1997;Wagner2001). The very high rate
Feuillet, C., A. Penger, K. Gellner, A. MastandA. Keller, 2001
plant genome comparisons (reviewed in Bennetzen
Molecular evolution of receptor-like kinase genes in hexaploid andRamakrishna2002) indicates that plants have much wheat: independent evolution of orthologs after polyploidization
more unstable genomes than those seen in mammals. and mechanisms of local rearrangements at paralogous loci. Plant
Physiol.125:1304–1313. This instability can provide the extensive haplotype
vari-Freeling, M., 2001 Grasses as a single genetic system: reassessment.
ability characteristic of most plants, providing broad Plant Physiol.125:1191–1197.
opportunities for the action of natural selection. Further Gale, M. D., andK. M. Devos, 1998 Comparative genetics in the
grasses. Proc. Natl. Acad. Sci. USA95:1971–1974. studies are warranted to provide a more comprehensive
Gaut, B. S., 1998 Molecular clocks and nucleotide substitution rates
indication of the nature, mechanisms, rates, and lin- in higher plants. Evol. Biol.30:93–120.
eages of genome rearrangement in plants. Gaut, B. S., B. R. Morton, B. C. McCaigandM. T. Clegg, 1996
Substitution rate comparisons between grasses and palms: synony-This work was supported by the National Science Foundation Plant
mous rate differences at the nuclear geneAdhparallel rate differ-Genome Program (grant no. 9975793) and United States Department ences at the plastid gene rbcl. Proc. Natl. Acad. Sci. USA93: of Agriculture-National Research Initiative grant no. 2000-1678. 10274–10279.
Gaut, B. S., A. S. Peek, B. R. MortonandM. T. Clegg, 1999 Pat-terns of genetic diversification within theAdhgene family in the grasses (Poaceae). Mol. Biol. Evol.16:1087–1097.
Gill, K. S., B. S. Gill, T. R. EndoandE. V. Boyko, 1996a Identifica-LITERATURE CITED
tion and high-density mapping of gene-rich regions in
chromo-Arumuganathan, K., andE. D. Earle, 1991 Nuclear DNA content some group 5 of wheat. Genetics143:1001–1012.
of some important plant species. Plant Mol. Biol. Reporter9: Gill, K. S., B. S. Gill, T. R. EndoandT. Taylor, 1996b
Identifica-208–218. tion and high-density mapping of gene-rich regions in
chromo-Barakat, A., N. CarelsandG. Bernardi, 1997 The distribution some group 1 of wheat. Genetics144:1883–1891.
of genes in the genomes of Gramineae. Proc. Natl. Acad. Sci. Hulbert, S. H., C. A. Webb, S. M. SmithandQ. Sun, 2001 Resis-USA94:6857–6861. tance gene complexes: evolution and utilization. Annu. Rev.
Phy-Bennett, M. D., andJ. B. Smith, 1976 Nuclear DNA amounts in topathol.39:285–312.
angiosperms. Philos. Trans. R. Soc. Lond. B Biol. Sci.274:227– Jukes, T. H., andC. R. Cantor, 1969 Evolution of protein mole-274. cules, pp. 21–132 inMammalian Protein Metabolism, edited by H. N.
Bennett, M. D., P. BhandolandI. J. Leitch, 2000 Nuclear DNA Munro. Academic Press, New York.
amounts in angiosperms and their modern uses: 807 new esti- Kato, K., H. MiuraandS. Sawada, 1999 Comparative mapping of mates. Ann. Bot.86:859–909. the wheatVrn1region with the riceHd-6region. Genome42:
Bennetzen, J. L., 2000 Comparative sequence analysis of plant nu- 204–209.
clear genomes: microcolinearity and its many exceptions. Plant Keller, B., andC. Feuillet, 2000 Colinearity and gene density in Cell12:1021–1030. grass genomes. Trends Plant Sci.5:246–251.
Bennetzen, J. L., andM. Freeling, 1993 Grasses as a single genetic
Klein, P. E., R. R. Klein, S. W. Cartinhour, P. E. Ulanch, J. M.
system: genome composition, collinearity and compatibility. Donget al., 2000 A high-throughput AFLP-based method for Trends Genet.9:259–261.
constructing integrated genetic and physical maps: progress
to-Bennetzen, J. L., andW. Ramakrishna, 2002 Numerous small re- ward a sorghum genome map. Genome Res.10:789–807. arrangements of gene content, order and orientation
differenti-Kleinhofs, A., A. Kilian, M. A. Saghai, R. M. Biyashev, P. Hayes
ate grass genomes. Plant Mol. Biol.48:821–827.
et al., 1993 A molecular, isozyme and morphological map of
Blanc, G., A. Barakat, R. Guyot, R. CookeandM. Delseny, 2000
the barley (Hordeum vulgare) genome. Theor. Appl. Genet.86:
Extensive duplication and reshuffling in theArabidopsisgenome.
705–712. Plant Cell12:1093–1101.
Ku, H.-M., T. Vision, J. LiuandS. D. Tanksley, 2000 Comparing
Brown, J. W. S., G. P. Clark, D. J. Leader, C. G. SimpsonandT.
sequenced segments of the tomato and Arabidopsis genomes:
Lowe, 2001 Multiple snoRNA gene clusters fromArabidopsis.
large-scale duplication followed by selective gene loss creates a RNA7:1817–1832.
network of synteny. Proc. Natl. Acad. Sci. USA97:9121–9126.
Bureau, T. E., and S. R. Wessler, 1994 Mobile inverted-repeat
Kumar, S., K. Tamura, I. B. JakobsenandM. Nei, 2001 MEGA2: elements of the tourist family are associated with the genes of
molecular evolutionary genetics analysis software. Bioinformatics many cereal grasses. Proc. Natl. Acad. Sci. USA91:1411–1415.
17:1244–1245.
Chen, M., P. Sanmiguel, A. C. D. Oliveira, S.-S. Woo, H. Zhang
Kunzel, G., L. KorzunandA. Meister, 2000 Cytologically
inte-et al., 1997 Microcolinearity insh2-homologous regions of the
grated physical restriction fragment length polymorphism maps maize, rice, and sorghum genomes. Proc. Natl. Acad. Sci. USA
for the barley genome based on translocation breakpoints.
Genet-94:3431–3435.
ics154:397–412.
Chen, M., P. SanmiguelandJ. L. Bennetzen, 1998 Sequence
orga-Lagercrantz, U., 1998 Comparative mapping betweenArabidopsis
nization and conservation insh2/a1-homologous regions of
sor-thalianaandBrassica nigraindicates that Brassica genomes have ghum and rice. Genetics148:435–443.
evolved through extensive genome replication accompanied by
Devos, K. M., J. K. M. BrownandJ. L. Bennetzen, 2002 Genome
chromosome fusions and frequent rearrangements. Genetics150:
size reduction through illegitimate recombination counteracts
1217–1228. genome expansion inArabidopsis.Genome Res.12:1075–1079.
Leader, D. J., G. P. Clark, J. Watters, A. F. Beven, P. J. Shawet
Dubcovsky, J., andJ. Dvorak, 1995 Ribosomal RNA multigene loci:
al., 1997 Clusters of multiple different small nucleolar RNA nomads of the Triticeae genomes. Genetics140:1367–1377.
genes in plants are expressed as and processed from polycistronic
Dubcovsky, J., D. Lijavetzky, L. AppendinoandG. Tranquilli,
pre-snoRNAs. EMBO J.16:5742–5751. 1998 Comparative RFLP mapping ofTriticum monococcumgenes
Leader, D. J., G. P. Clark, J. Watters, A. F. Beven, P. J. Shawet
controlling vernalization requirement. Theor. Appl. Genet.97:
al., 1999 Splicing-independent processing of plant box C/D 968–975.
and box H/ACA small nucleolar RNAs. Plant Mol. Biol.39:1091–
Dubcovsky, J., W. Ramakrishna, P. Sanmiguel, C. S. Busso, L. Yan
1100.
et al., 2001 Comparative sequence analysis of colinear barley
Leister, D., J. Kurth, D. A. Laurie, M. Yano, T. Sasakiet al., 1998 and rice BACs. Plant Physiol.125:1342–1353.
Rapid reorganization of resistance gene homologues in cereal
Faris, J. D., K. M. HaenandB. S. Gill, 2000 Saturation mapping
genomes. Proc. Natl. Acad. Sci. USA95:370–375. of a gene-rich recombinant hot spot region in wheat. Genetics
Lijavetzky, D., G. Muzzi, T. Wicker, B. Keller, R. Winget al.,
154:823–835.
1999 Construction and characterization of a bacterial artificial
Feuillet, C., andB. Keller, 1999 High gene density is conserved
chromosome (BAC) library for the A genome of wheat. Genome at syntenic loci of small and large grass genomes. Proc. Natl.
Lynch, M., andJ. S. Conery, 2000 The evolutionary fate and conse- ical contig inTriticum monococcumL. spans the Lr10 resistance locus in hexaploid wheat (Triticum aestivumL.). Proc. Natl. Acad. quences of duplicate genes. Science290:1151–1155.
Lynch, M., andJ. C. Conery, 2001 Gene duplication and evolution: Sci. USA97:13436–13441.
Sutka, J., G. Galiba, A. Vagujfalvi, B. S. GillandJ. W. Snape, 1999 response. Science293:U2–U3.
Meyers, B. C., S. V. TingleyandM. Morgante, 2001 Abundance, Physical mapping of theVrn-A1andFr1genes on chromosome 5A of wheat using deletion lines. Theor. Appl. Genet99:199–202. distribution, and transcriptional activity of repetitive elements in
the maize genome. Genome Res.11:1660–1676. Tajima, F., 1993 Simple methods for testing the molecular evolution-ary clock hypothesis. Genetics135:599–607.
Moore, G., K. M. Devos, Z. WangandM. D. Gale, 1995 Grasses,
line up and form a circle. Curr. Biol.5:737–739. Tarchini, R., P. Biddle, R. Wineland, S. TingeyandA. Rafalski, 2000 The complete sequence of 340 kb of DNA around the
Nei, M., andT. Gojobori, 1986 Simple methods for estimating the
numbers of synonymous and nonsynonymous nucleotide substi- riceAdh1-Adh2region reveals interrupted colinearity with maize chromosome 4. Plant Cell12:381–391.
tutions. Mol. Biol. Evol.3:418–426.
O’Neill, C., andI. Bancroft, 2000 Comparative physical mapping Thompson, J. D., T. J.Gibson, F.Plewniak, F.Jeanmouginand D. G.
Higgins, 1997 The CLUSTAL_X windows interface: flexible of segments of the genome ofBrassica oleraceavar. alboglabra
that are homoeologous to sequenced regions of chromosomes strategies for multiple sequence alignment aided by quality analy-sis tools. Nucleic Acids Res.24:4876–4882.
4 and 5 ofArabidopsis thaliana.Plant J.23:233–243.
Panstruga, R., R. Buschges, P. PiffanelliandP. Schulze-Lefert, Tikhonov, A. P., P. J. Sanmiguel, Y. Nakajima, N. M. Gorenstein, J. L. Bennetzenet al., 1999 Colinearity and its exceptions in 1998 A contiguous 60 kb genomic stretch from barley reveals
orthologousadhregions of maize and sorghum. Proc. Natl. Acad. molecular evidence for gene islands in monocot genome. Nucleic
Sci. USA96:7409–7414. Acids Res.26:1056–1062.
Van de Peer, Y., J. S. Taylor, I. BraaschandA. Meyer, 2001 The
Richly, E., J. KurthandD. Leister, 2002 Mode of amplification
ghost of selection past: rates of evolution and functional diver-and reorganization of resistance genes during recentArabidopsis
gence of anciently duplicated genes. J. Mol. Evol.53:436–446.
thalianaevolution. Mol. Biol. Evol.19:76–84.
Vision, T. J., D. G. BrownandS. D. Tanksley, 2000 The origins
Rossberg, M., K. Theres, A. Acarkan, R. Herrero, T. Schmittet
of genomic duplications inArabidopsis.Science290:2114–2117.
al., 2001 Comparative sequence analysis reveals extensive
micro-Wagner, A., 2001 Birth and death of duplicated genes in completely colinearity in the lateral suppressor regions of the tomato,
Arabi-sequenced eukaryotes. Trends Genet.17:237–239.
dopsis, andCapsellagenomes. Plant Cell13:979–988.
Wicker, T., N. Stein, L. Albar, C. Feuillet, E. Schlagenhaufet
Sanmiguel, P., andJ. L. Bennetzen, 1998 Evidence that a recent
al., 2001 Analysis of a contigous 211 kb sequence in diploid increase in maize genome size was caused by the massive
amplifi-wheat (Triticum monococcumL) reveals multiple mechanisms of cation of intergene retrotransposons. Ann. Bot.82:37–44.
genome evolution. Plant J.26:307–316.
Sanmiguel, P., A. Tikhonov, Y.-K. Jin, N. Motchoulskaia, D.
Zakh-Wolfe, K. H., andP. M. Sharp, 1993 Mammalian gene evolution:
arovet al., 1996 Nested retrotransposon in the intergenic
re-nucleotide sequence divergence between mouse and rat. J. Mol. gions of the maize genome. Science274:765–768.
Evol.37:441–456.
Sanmiguel, P., B. S. Gaut, A. Tikhonov, Y. Nakajimaand J. L.
Wolfe, K. H., andD. Shields, 1997 Molecular evidence for an
Bennetzen, 1998 The paleontology of intergene
retrotranspo-ancient duplication of the entire yeast genome. Nature387:708– sons of maize. Nat. Genet.20:43–45.
713.
Sanmiguel, P., W. Ramakrishna, J. L. Bennetzen, C. S. Bussoand
Wolfe, K. H., W.-H. LiandP. M. Sharp, 1987 Rates of nucleotide
J. Dubcovsky, 2002 Transposable elements, genes and
recom-substitution vary greatly among plant mitochondrial, chloroplast, bination in a 215-kb contig from wheat chromosome 5Am. Funct.
and nuclear DNAs. Proc. Natl. Acad. Sci. USA84:9054–9058. Integr. Genomics2:70–80. Wolfe, K. H., M. Gouy, Y.-W. Yang, P. M. SharpandW.-H. Li, 1989a
Sarma, R. N., B. S. Gill, T. Sasaki, G. Galiba, J. Sutkaet al., 1998
Date of the monocot-dicot divergence estimated from chloroplast Comparative mapping of the wheat chromosome 5AVrn-A1re- DNA sequence data. Proc. Natl. Acad. Sci. USA86:6201–6205. gion with rice and its relationship to QTL for flowering time. Wolfe, K. H., P. M. SharpandW.-H. Li, 1989b Rates of synonymous Theor. Appl. Genet.97:103–109. substitution in plant nuclear genes. J. Mol. Evol.29:208–211.
Shirasu, K., A. H. Schulman, T. LahayeandP. Schulze-Lefert, Yu, Y., J. P. Tomkins, R. Waugh, D. A. Frisch, D. Kudrnaet al., 2000 2000 A contiguous 66 kb barley DNA sequence provides evi- A bacterial artificial chromosome library for barley (Hordeum dence for reversible genome expansion. Genome Res.10:908– vulgare). Theor. Appl. Genet101:1093–1099.
915. Zhang, L. Q., S. K. Pond andB. S. Gaut, 2001 A survey of the
Stebbins, G. L., 1981 Coevolution of grasses and herbivores. Ann. molecular evolutionary dynamics of twenty-five multigene fami-Mo. Bot. Gard.68:75–86. lies from four grass taxa. J. Mol. Evol.52:144–156.
Stein, N., C. Feuillet, T. Wicker, E. SchlagenhaufandB. Keller,