ABSTRACT
ANTONY, GERRY JOHN. Polymer Blending using Cyclodextrins. (Under the direction of Dr. Alan E. Tonelli).
The main objective of this Study is focus on the use of alpha and gamma cyclodextrins in blending of two sets of polymers - polythiophene with polystyrene and polymethyl methacrylate with polyvinyl acetate by exploring the inclusion properties of these polymers with cyclodextrins and its derivatives.
fluorescence imaging, photoluminescence spectroscopy and UV-visible spectroscopy in order to study the polymerization of these materials in cyclodextrin cavity and in the form of blends with polystyrene.
Polymer Blending using Cyclodextrins
by
Gerry John Antony
A thesis submitted to the Graduate Faculty of North Carolina State University
in partial fulfillment of the requirements for the degree of
Master of Science
Textile Chemistry and Materials Science & Engineering
Raleigh, North Carolina 2011
APPROVED BY:
_______________________________ ______________________________
Dr. Alan E. Tonelli Dr. Maury Balik
Committee Chair
ii
DEDICATION
iii
BIOGRAPHY
iv
ACKNOWLEDGMENTS
I would like to thank Dr. Alan E. Tonelli for his constant encouragement and guidance over the course of the Masters program. I would also like to thank other members of my committee Dr. C. Maurice Balik and Dr. Richard Kotek for all their guidance over the past two years.
I would also like to thank Dr. Brad Busche and Jaewook Seok for their help with synthesis and polymer blending. I would also like to thank Dr. Brandon Williamson for his help in making inclusion compounds and in analysis of results. Dr. Birgit Anderson, Judy Elson for their help with analytical instrumentation. I would like to acknowledge Dr. Sabapathy Sankar and Dr. Hanna Gracz for their help as regards to NMR training and characterization. I would like to specially thank Dr. Harald Ade and Jaewook Seok for allowing me to use their UV Exposure setup, and help with analysis of thiophenes. Additionally I would also like to acknowledge other members of my research group Dr. Anushree Mohan, Abhay Joijode, Alper Gurarslan and Ramakrishna Krishnaswamy.
Lastly, I would like to thank my family and friends who through their constant encouragement and support have made all of this possible.
v
TABLE OF CONTENTS
LIST OF TABLES ... viii
LIST OF FIGURES ...ix
1. INTRODUCTION ... 1
1. Cyclodextrins ... 1
1.1. Brief Overview ... 1
1.2. Properties ... 3
1.3. Cyclodextrin Inclusion Compounds ... 4
1.4. Polymer Coalescence from CD Inclusion Compounds ... 7
1.5. Polymer Modification using Cyclodextrins ... 8
1.6. Polymer Compatibilization using Cyclodextrins ... 10
2. Motivation for Studying Polythiophenes ... 12
3. Motivation for Blending PMMA/PVAc using γ‐Cyclodextrin ... 13
2. POLYTHIOPHENE/POLYSTYRENE BLENDING USING CYCLODEXTRINS ... 14
1. Introduction ... 14
1.1. Brief Overview ... 14
1.2. Polythiophene Synthesis Methods ... 15
1.1.1. Chemical Synthesis ... 15
1.1.2. Electrochemical Synthesis ... 16
1.1.3. Photochemical Synthesis ... 17
1.3. Characterization Techniques for Polythiophenes ... 17
1.3.1. Fluorescent Imaging and Photoluminescence Spectroscopy ... 17
1.3.2. UV‐Vis Spectroscopy ... 18
vi
1.3.4. X‐Ray Diffraction ... 19
2. Materials ... 19
3. Experimental Methods ... 20
3.1. Preparation of γ‐CD with polystyrene arms ... 20
3.2. Preparation of Samples for UV Exposure ... 21
3.3. Inclusion Compounds of α‐ and γ‐cyclodextrin with DIT ... 22
3.4. UV Exposure ... 23
4. Characterization Techniques ... 24
4.1. UV‐Visible Spectroscopy ... 24
4.2. Fourier Transform Infra Red Spectroscopy ... 24
4.3. Photoluminescence Spectroscopy... 24
4.4. Wide Angle X‐Ray Diffraction ... 24
4.5. Differential Scanning Calorimetry ... 25
4.6. Nuclear Magnetic Resonance... 25
5. Results and Discussions ... 25
5.1. Characterization of γ‐CD stars ... 25
5.2. UV Exposure of DIT for photo‐initiation ... 27
5.3. Inclusion Compounds between DIT and α‐ and γ‐CD ... 29
5.4. Blending of Oligothiophene into PS using γ‐CD stars ... 38
6. Conclusions ... 50
3. NON‐STOICHIOMETRIC INCLUSION COMPOUNDS OF PMMA, PVAc AND THEIR BLENDS WITH γ‐CYCLODEXTRIN ... 51
vii
2. Experimental Methods ... 51
2.1. Preparation of Non‐Stoichiometric Inclusion Compound ... 51
3. Characterization Techniques ... 53
3.1. Fourier Transform Infra Red Spectroscopy ... 53
3.2. Differential Scanning Calorimetry ... 53
3.3. Nuclear Magnetic Resonance... 53
4. Results and Discussion ... 54
4.1. Non‐Stoichiometric Inclusion Compounds with PVAc or PMMA ... 54
4.2. Non‐Stoichiometric Inclusion Compounds with PVAc/PMMA Blends ... 59
4.3. NMR Analysis of the Non‐stoichiometric Inclusion Compounds ... 62
5. Conclusions ... 63
1. Blending of Polythiophene with Polystyrene using Cyclodextrins ... 65
2. Non‐Stoichiometric Inclusion compounds with PMMA/PVAc with γ‐ Cyclodextrin ... 66
REFERENCES ... 68
viii
LIST OF TABLES
Table 1 - Comparison of the three main CDs7 ... 4
Table 2 – Unexposed thiophene samples for UV exposure ... 22
ix
LIST OF FIGURES
Figure 1 - Graphical and schematic picture of α-cyclodextrin1 ... 1
Figure 2 - Comparison of the sizes of α-, β-, and γ-CD1 ... 3
Figure 3 - Formation of Inclusion Complex of p-Xylene with α-CD in water 12 ... 5
Figure 4 - Different packing structures adopted by cyclodextrin – cage or ... 7
Figure 5 - Polymer-CD inclusion compound formation and coalescence processes40 ... 8
Figure 6 - Synthesis of (a) ATRP initiator and (b) PS-γ-CD star49 ... 9
Figure 7 - Compatibilization of polymer mixture using CD-stars 49 ... 12
Figure 8 - Chemical structure of A-polyaniline, B-polyacetylene and C-polypyrrole ... 14
Figure 9 - Chemical synthesis routes for polythiophene59 ... 16
Figure 10 - 1H-NMR of γ-CD stars (50 g/ml) in d2-methylene chloride ... 26
Figure 11 - Image contrast under UV light between DIT100 exposed to UV light for 3 and 5 min from left to right... 28
Figure 12 - PL for DIT in chloroform exposed to UV for 3 and 5 min. ... 29
Figure 13 - Inclusion compounds of DIT with α- and γ-CD before and after UV exposure. . 30
Figure 14 - FTIR spectra of α-CD, DIT, and α-CD-DIT IC after 10 min UV exposure. ... 31
Figure 15 - X-ray pattern of inclusion compound of DIT with α-CD. ... 32
Figure 16 - X-ray pattern of α-CD-DIT IC exposed to UV for 5 min. ... 33
Figure 17 - FTIR spectrum of unexposed IC between DIT and γ-CD. ... 34
Figure 18 - FTIR spectrum of IC between DIT and γ-CD after 10 min UV exposure ... 35
x
Figure 20 - PL for DIT monomer in THF. ... 37
Figure 21 - PL for α-CD in THF. ... 37
Figure 22 - PL of IC of DIT with α-CD. ... 38
Figure 23 - Samples of DIT/PS with and without CD-star after UV exposure. ... 40
Figure 24 - Effect of heating and time (one week) on UV exposed samples of DIT+PS. ... 41
Figure 25 - Fluorescence contrast between 1:1 DIT/PS(left) and UV-exposed sample(right). ... 42
Figure 26 - Fluorescence contrast between DBT30 samples exposed for 30min(left) and 10min(right). ... 42
Figure 27 - UV-Vis absorption spectra for mixture of PS+DBT, with and without γ-CD ... 44
Figure 28 - FTIR spectrum of DBT. ... 45
Figure 29 - FTIR Spectrum of γ-CD star polymer. ... 45
Figure 30 - FTIR Spectrum of PS+DIT+CDstar after 30 min UV exposure. ... 46
Figure 31 - Comparison of DBT_CDS30 samples after 10 and 30 min UV exposure. ... 46
Figure 32 - FTIR Spectrum of DBT30 after 30 min UV exposure. ... 47
Figure 33 - Comparison of DBT30 samples after 10 and 30 min UV Exposure. ... 47
Figure 34 - DSC thermograms of PS+DBT+CDstar exposed to UV for 10 and 30 min. ... 49
Figure 35 - DSC thermograms of PS+DBT exposed to UV for 10 and 30 min. ... 49
Figure 36 - DSC thermogram of as-recd PVAc. ... 55
Figure 37 - DSC thermogram of 6:1 (n-s) PVAc IC. ... 56
Figure 38 - DSC thermogram of 3:1 (n-s) PVAc IC. ... 56
xi
Figure 40 - DSC thermogram of PMMA as recd. ... 57
Figure 41 - DSC thermogram of 2:1 PMMA IC. ... 58
Figure 42 - DSC thermogram of 3:1 PMMA/PVAc(1:1) IC. ... 60
Figure 43 - DSC thermogram of 3:1 PMMA/PVAc(1:2) IC. ... 61
1
1.
INTRODUCTION
1.
Cyclodextrins
1.1. Brief Overview
An inclusion compound is essentially a complex between a host and guest molecule, without the formation of any covalent bonds. A number of compounds like urea, hydroquinone and deoxycholic acid, crown ethers, cyclodextrins (CDs), and also starch, and enzymes can act as the host. CDs (Fig 1) can include guests within their cavities. Among various hosts, CDs, owing to the combination of its efficiency and efficacy in the formation of inclusion compounds with a wide range of guest molecules, finds itself being applied to myriad fields, in both the biological and physical sciences, and in diverse applications.
Figure 1 - Graphical and schematic picture of α-cyclodextrin1
2
able to isolate several strains of bacteria including bacillus macerans which he observed to be capable of producing two distinct crystalline substances on digesting with starch, identical to Villiers “cellulosines”. He further studied the properties of these crystalline “dextrins”, which laid the foundations for all future research. The ability of these compounds to form inclusion compounds was first identified by Pringsheim et al5. The intrinsic composition of CDs consists of maltose with α-1,4-glucosidic linkages and a cyclic structure, and was postulated by Freudenberg et al. γ-CD was discovered and characterized much later between 1948 and 1950. The preparation, properties and formation of inclusion compounds of CDs were all discovered by the 1960s. Industrial scale production of CDs (mainly β-CD), was started in the 1970s, mainly as fine chemicals. Today, however, several thousand tons of CDs are manufactured annually, and are available in different grades.
3
Figure 2 - Comparison of the sizes of α-, β-, and γ-CD1 α-CD
The CDs were studied using X-ray, and this revealed the secondary hydroxyl groups attached to the C2 and C3 methylene carbons are on the wider edge of the torus, while the primary hydroxyl from the C6 is on the smaller edge. The interior has the oxygen responsible for the 1,4 linkage, and also the hydrogens attached to C3 and C5. The net result is a “micro-heterogeneous environment”, with a hydrophilic exterior and a hydrophobic cavity. Consequently, CDs can include hydrophobic guest molecules in their interior cavities, which could either be small organic or inorganic species, or even macroscopic molecules like oligomers and polymers.
1.2. Properties
-4
CD 6 has been mainly attributed to its rigid crystal structure. This structure is the result of a complete band of hydrogen bonds along the entire CD ring formed between hydroxyl groups of C2 and C3 carbons of adjacent glucopyranose units in β-CD. This does not exist in α- and γ-CD, and, as a consequence, they have relatively higher solubility in aqueous solutions. It is also noteworthy that their water solubility is less than in their acyclic saccharide counterparts. Also their conformations in solution and the solid-state are found to be similar, which has been shown using spectroscopic methods.
Table 1 - Comparison of the three main CDs7
Parameter α-CD β-CD γ-CD
Glucopyranose Units 6 7 8
Molecular Weight 972 1135 1297
CD Core Diameter (Å) 5.7 7.8 9.5
CD Torus Height (Å) 7.8 7.8 7.8
Water Solubility (g/L) 145 20 220
1.3. Cyclodextrin Inclusion Compounds
5
and also the temperature9, 10 at which the inclusion is allowed to take place. The apolar nature of the CD cavity leads to substitution by the guest molecule (polymer or small molecule) of the included water molecules housed in them. This is because the presence of water molecules in the cavity is not favored as the polar---apolar interaction would lead to energetic incompatibility and hence substitution with a less polar guest would be more favorable6, 11-13 (See Fig 3). The complex forming ability of the CD host can thus be attributed to the replacement of polar energetic water molecules by other guest molecule, which in this case would have to be less polar in order for such an inclusion compound to form8, 10, 14-17. The most common ratio of the host to guest is 1:1, but depending on the size comparisons between the host and guest, this can vary on both sides of this ratio. If the guest is small, more than one can be included in the cavity. But if it is large, more than one CD would be required to fully include the guest. This process of encapsulation of the guest in the CD leads to the most significant property of CDs that is its ability to form inclusion compounds (ICs).2
Figure 3 - Formation of inclusion complex of p-Xylene with α-CD in water 12
6
exterior is more hydrophilic on account of the presence of hydroxyl groups. These hydroxyl groups lead to increased solubility for the hydrophobic guests in an aqueous environment. The significant advantages of this lies in pharmaceuticals2, 18, where drugs having poor solubility in water can be made to include in CD. This would lead to an increased solubility in the aqueous environment inside the human body for the guest molecule and consequently lead to improved performance in such applications. In addition to pharmaceuticals, inclusion compounds of CD are extensively used in other industries19, 20. Another potential end-use is in textile dyeing and processing21. The dye or other specialty additive can be included in the CD cavity, which can lead to a higher and more uniform uptake of these chemicals by the textile material. This has been demonstrated by Savarino et al 22 in the case of dyeing of nylon-6 and nylon-66, with CD used to microencapsulate the dye. CDs have also been shown to give better performance enhancement with other textile finishing agents.
7
solid CD and molten polymer. The solid precipitate left behind is the inclusion compound with CD. As-received CD in its natural form assumes a cage or herringbone structure, while after inclusion of a polymeric guest, the resulting polymer CD-IC formed is in a columnar structure, and this is easily observable using x-ray diffraction. In addition to
XRD33, 34, we can use DSC34, NMR35, FTIR36, and photoluminescence spectroscopy to
characterize the inclusion compounds obtained, and also to validate the XRD results. Some of the common packing structures of CD37, 38 and its observed packing after formation of the inclusion compound are illustrated in Figure 4.
Figure 4 - Different packing structures adopted by cyclodextrin – cage or
herringbone, layered, columnar and columnar with polymer included39
1.4. Polymer Coalescence from CD Inclusion Compounds
8
Figure 5 - Polymer-CD inclusion compound formation and coalescence processes40
1.5. Polymer Modification using Cyclodextrins
This involves the incorporation of polymers into the CD architecture, with the complex the polymer selectively added via substitution of one or more of the hydroxyl groups on the CDs.
9
CD core were only recently investigated by Brad Busche46-48, and made using ATRP. The general schematic of the reaction scheme for synthesis of these γ-CD stars is illustrated in Figure 6. In order to make the initiator, we modify γ-CD with 2-bromoisobutyryl bromide, which results in formation of bromine terminated initiator sites44, 49, shown in Figure 6(a). The Br-γ-CD is then polymerized by ATRP using styrene monomer and catalyst giving polystyrene arms attached at the modified sites. Using 1H-NMR in deuterated DMSO, it was shown that a total of 12 hydroxyl groups are modified by the bromination of γ-CD, including all 8 of the primary hydroxyl groups and 4 of the possible 16 secondary hydroxyl groups. Additionally, using 1H-NMR in deuterated methylene choride, it was also shown that the styrene reacts with all of the brominated sites on Br-γ-CD. In our case we used the same sample of Br-γ-CD synthesized by Brad Busche, and the γ-CD star polymers were synthesized using the same technique.
10
1.6. Polymer Compatibilization using Cyclodextrins
The process of reducing the interfacial energy between two heterogeneous domains in a blend of two or more components leads to the formation of a product with reduced domain sizes and with improved mechanical properties. Compatibilization of polymer mixtures is possible by reactive blending: involving macromolecular in situ reactions and by addition of
an additional compatibilizing component: compatibilizer or CD.
1. Pure Cyclodextrins:
11 2. CD star polymers:
12
Figure 7 - Compatibilization of polymer mixture using CD-stars 49
2.
Motivation
for
Studying
Polythiophenes
One of the major issues encountered with conjugated conducting polymers like polythiophene (PT) has been the difficulty in their chemical processing. This has been attributed to their poor solubility in organic solvents with increase in conjugation length or molecular weight. PTs with molecular weights corresponding to more than 6 thiophene units are typically observed to be insoluble. Thus part of the motivation of this study was to provide an alternate for processing such polymers by studying their inclusion behavior with CDs, both α- and γ- forms. Inclusion compounds of dihalothiophenes with α-CD are found to be soluble in dimethyl sulfoxide, and the α-CD can be subsequently removed by washing with enzyme or hydrochloric acid. This would open up a lot of possibilities for the solvent processing of thiophenes, which are notorious for poor solubility.
13
an extension of the work done by Brad Busche where he showed the γ-CD star to be an effective compatibilizer for the blend of polystyrene and polydimethyl siloxanes. Polystyrene is an ideal polymer for blending using the cyclodextrin stars as they cannot include into the CD core cavity due to the large size of the styrene repeat unit coupled with the atactic nature of the polystyrene arms55, 56. Polystyrene is commonly used for blending as it increases
overall strength of the blended system in addition to being relatively cheap.
3.
Motivation
for
Blending
PMMA/PVAc
using
γ
Cyclodextrin
Neat PMMA and PVAc and their blends formed by complexation with γ-CD have already been well established. Here we attempted to study the effect of reducing the amount of γ-CD used during the inclusion process on the coalesced blends of the above two polymers. The stoichiometric ratios are thereby increased from fully covered 3:134 to 6:1, 9:1, and 18:1
14
2.
POLYTHIOPHENE/POLYSTYRENE
BLENDING
USING
CYCLODEXTRINS
1.
Introduction
1.1. Brief Overview
Polymers with alternating double and single bonds along their backbone are called conjugated polymers. Some typical polymers in this class include polyacetylene, polyaniline, polypyrrole, and polythiophene, shown in Figures 8 and 9. There were two major steps that led to the prominence of conducting polymers and a significant rise in research efforts on them. First was the doping of polyacetylene with iodine by H. Shirakawa et al in 197757, and the observation that the conductivity of polyacetylene was equivalent to that of metals. The second important step was the discovery of electroluminescence – the change in color of these conjugated macromolecules on the application of electric charge, at the Cambridge labs in the early 1990’s, opening applications in flexible displays and solar cells58.
15
Among the conjugated polymers, polythiophenes form an important species due to their resistance to heat and other factors like air, moisture, etc. This stability leads to a number of applications requiring conjugated polymers like antistatic coatings for charge dissipation or to prevent the build-up of static charge, and in batteries, which now find usage in hybrid cars. Its photo-luminescent property allows applications in optical devices, polymeric diodes, and many other electric applications such as conductors, sensors, solar cells and transistors. Its unique combination of properties also allows usage in biological implants, which can potentially respond to electric stimulus generated by neurons, akin to muscles.59
1.2. Polythiophene Synthesis Methods
1.1.1. Chemical Synthesis
Chemical synthesis of unsubstituted PTs was first reported by two groups – Yamamoto et al60
and Lin and Dudek61 in 1980 by the metal catalyzed synthesis of PT from
16
reaction was also done using the nickel, cobalt and ferric counterparts of the acetyl acetonate. Another method of producing PTs using ferric chloride catalyst with thiophene was investigated by Sugimoto61, 62. Also zeolites containing transition metal catalysts can be used
to make PTs from thiophene vapor encapsulated in them. These methods are summarized by McCullough59.
Figure 9 - Chemical synthesis routes for polythiophene59
1.1.2. Electrochemical Synthesis
Electrochemical processes for synthesis of PTs have been found to yield highly conjugated and conductive polymers63 compared to the chemically synthesized ones. Two routes exist
for the electrochemical production of these polymers:
17
other methods including no catalyst use, PT obtained directly as film on electrode surface, and good control of the film thickness.
2. Cathodic Route: Involves the (2-bromo-5-thieny1) triphenylnickel bromide complex electro-reduced in acetonitrile. Film thickness obtained by this method is limited to ~ 100 nm due to PT being produced in its neutral insulating form, leading to passivation of the electrode with the progress of the electrochemical reaction. However this method is useful for semi-conductors that are susceptible to anodic corrosion.
1.1.3. Photochemical Synthesis
The photochemical method for the synthesis of oligothiophenes was developed byNatarajan64‐66 as an alternative for the electrochemical process. The advantages of this
method, in addition to the relative ease of manufacture, include the lack of the need for a conducting substrate, and also the ease of integration into lithographic methods for production of micropatterned PT. In this method, 2,5-diiodothiophene monomer is vapor-deposited as a film onto a substrate, after which the film is irradiated with UV rays to give films of oligothiophene. Average conjugation lengths of up to 6-7 have been reported by photo-activation of the deposited film of monomer on copper substrate. Other substrates were found to give an average conjugation length of 4-5.
1.3. Characterization Techniques for Polythiophenes
1.3.1. Fluorescent Imaging and Photoluminescence Spectroscopy
18
region and then photographed using a digital camera. An increase in fluorescence is observed with increasing linkage of thiophene rings, and further increase in the degree of polymerization translates into fluorescence shifts from the blue or near UV to higher wavelength regions of the visible spectrum (yellow and yellow-green). This can be used to approximately gauge the conjugation length achieved during the polymerization process. A similar observation can also be made using fluorescent spectroscopy, where solutions are excited using light at the ultra-violet absorption maximum from UV spectroscopy and the consequent shifts in the emission pattern are observed.
1.3.2. UVVis Spectroscopy
Solutions of the sample are prepared and exposed to light from the ultra-violet to the visible range and the absorbance of light is studied as a function of wavelength. In this case we observe shifts in the amount of light absorbed at different wavelengths with variation in the polymerization time.
1.3.3. FTIR Spectroscopy
19 oxidation and contamination defects.
1.3.4. XRay Diffraction
X-ray diffraction is primarily used to study inclusion compounds of thiophene (both monomer and oligomers) with α- and γ- CDs. In the case of successful inclusion, we observe the channel structure, which is possible only if the thiophene is included in the CD-core. Formation of cage structure would not be conclusive evidence for thiophene inclusion in the CD-cavity. These two patterns are easily identifiable using x-ray diffraction, because characteristic peaks are observed in each case.
2.
Materials
20
3.
Experimental
Methods
3.1. Preparation of γCD with polystyrene arms
The Br-γ-CD ATRP initiator was prepared by Brad Busche and was used for preparation of the γ-CD stars. Initial molar ratios of 120/1/1/3/0.05, corresponding to [M]/[I]/[CuIBr]/[bpy]/[CuIIBr2], were used for synthesizing the polystyrene chains by atom transfer radical polymerization, where [M] is the styrene monomer, [I] is the number of bromine groups on the Br-γ-CD ATRP initiator, [CuIBr] is copper(I) bromide, [bpy] is 2,2’-bipyridine, and [CuIIBr2] is copper(II) bromide. Br-γ-CD initiator powder was added to a round bottom flask with continuous stirring using a Teflon coated magnetic stir bar. Three successions of vacuum at 500mtorr and nitrogen back filling were used to remove any trace of oxidizing impurities like oxygen. After nitrogen washing was completed, 1/3 of the styrene monomer was introduced via syringe into the flask. The contents are allowed to stir under nitrogen till complete dissolution.
In another round-bottom flask copper(I) bromide, copper(II) bromide, and bipyridine were added with constant stirring using a Teflon coated magnetic stir bar, followed by application of vacuum and nitrogen backfilling. The remaining monomer was added via syringe to this vessel causing it to turn black in color and thereby indicating heterogeneity. This mixture was placed into an oil bath preheated to 90° C and allowed to equilibrate over the next 10 minutes while stirring.
21
minutes the flask was removed from the oil bath and its contents precipitated into a 60/40 methanol/water mixture (roughly 10 times the reaction volume). The precipitate was collected by filtration after it settled in the beaker.
The CD star is separated from impurities using chloroform, which selectively solvates the precipitated star and the chloroform layer is pipetted out from the bottom of the beaker. The star molecules are recovered by evaporating the chloroform.
In order to further purify the product it is dissolved in chloroform and filtered through basic alumina twice, which removes any residual copper impurities. Elutant obtained after this was mixed with an acid ion-exchange resin (Dowex Marathon, Dow Chemical Co.) and stirred for two hours and filtered through basic alumina once more and directly precipitated into stirred methanol. An off-white solid is obtained which is air-dried overnight and subsequently vacuum dried at 80° C using 500 mtorr pressure. The recovered off-white solid was air-dried overnight and then vacuum dried for 24 hours at 80° C and 500mtorr.
3.2. Preparation of Samples for UV Exposure
Before exposure to UV light, the samples, which were either a mixture of polystyrene and monomer with or without the CD stars, or CD inclusion compounds of the monomer formed with α- and γ-CDs, were dissolved in THF, cyclohexanone, or DMSO and stirred for 30
22
carbon-halogen bond. The samples are named as monomer concentration (contains either DIT or DBT and PS along with concentration of monomer) or monomer_CDS concentration (same as above but contain γ-CD stars). After exposure of samples to UV for photo-initiation the samples containing the same mix of monomer and additives are differentiated by the amount of UV exposure time such as, DBT30_10, which implies that the DBT30 sample was exposed to UV radiation for 10 minutes.
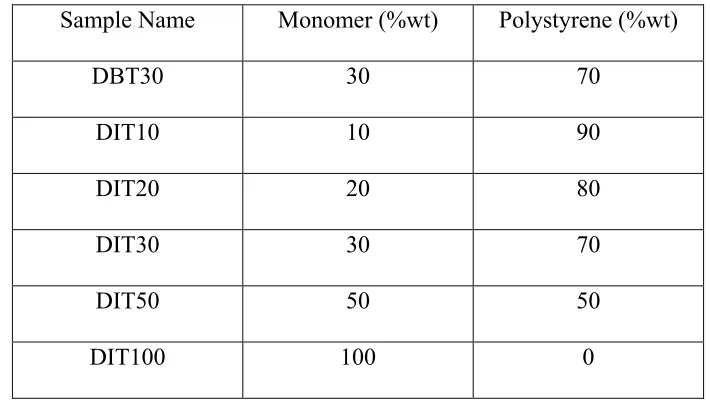
Table 2 – Unexposed thiophene samples for UV exposure
Sample Name Monomer (%wt) Polystyrene (%wt) DBT30 30 70
DIT10 10 90 DIT20 20 80 DIT30 30 70 DIT50 50 50
DIT100 100 0
3.3. Inclusion Compounds of α and γcyclodextrin with DIT
23
The calculated amounts of monomer (considering stoichiometric requirements for complete coverage) were dissolved in THF and it was allowed to stir for 30 minutes. About a two times excess of the stoichiometric quantity of α- and γ-CD for formation of inclusion compound between the monomer and CD was used, such that all the monomer will now be included in the CD cavity (100% coverage). After adding the monomer (DIT or DBT) solution, the mixture was sonicated for 10 minutes. The precipitate obtained after the sonication process was rinsed with water and dried in a vacuum oven.
3.4. UV Exposure
The samples in Table 2 were exposed to UV light using a Newport UV exposure system equipped with a 200W mercury lamp. The samples were placed on a hot plate which was maintained at 40° C and the entire setup was enclosed in a glove box for precise control of the atmospheric conditions. The samples were exposed to UV light for a certain period of time varying between 3-30 minutes in order to study the effect of exposure time on the formation of thiophene oligomers by the photo-initiation of monomer in solvent. The precise wavelength required was calculated from the bond dissociation energy and it was controlled using filters to block out the higher energy light. After exposure to UV, the polymer blend is extracted from the solution by evaporating the solvent via a draft of air. In case of solvents
24
4.
Characterization
Techniques
4.1. UVVisible Spectroscopy
50 ppm solutions of sample were prepared in chloroform. The spectra were obtained in the UV and visible range of 240 to 700 nm, 240 nm being the cut-off wavelength for chloroform. The measurements and analyses were done on a Cary 3E Ultra Violet visible spectrophotometer.
4.2. Fourier Transform Infra Red Spectroscopy
Fourier Transform Infrared Spectroscopy (FTIR) was performed on a Nicolet 510P FTIR in transmittance mode. The FTIR chamber was purged with dry air to eliminate water vapor. The data collection was done in ATR mode, and collected using a Germanium tip that is directly on top on the sample that was ground to a fine powder, instead of using potassium bromide pellets formed with the samples. The spectra were observed between 4000 – 400 cm-1, with 64 scans having a resolution of 4 cm-1.
4.3. Photoluminescence Spectroscopy
1 g/L solutions were prepared in THF or DMSO depending on the sample being analyzed. THF was used for mixtures of polystyrene and the oligothiophene, while DMSO was utilized mainly for inclusion compounds of α- and γ-CD with the thiophenes.
4.4. Wide Angle XRay Diffraction
25
intensities were measured every 0.1º from 2Θ = 5 to 30º at scanning speed of 2Θ= 5º/min. The supplied voltage and current were 35kV and 25 mA, respectively.
4.5. Differential Scanning Calorimetry
Glass transition temperatures for the blends of polystyrene with oligothiophene were ascertained using a TA Instruments Q1000 differential scanning calorimeter with liquid nitrogen cooling capacity. Helium purge rate of 25 ml/min was used in the calorimeter, and heating and cooling rate of 20° C/min was used. About 10-20 mg of the sample was weighed and sealed in an aluminum sample pan. Analysis of data was done with TA universal analysis software and the second heating cycle was used in all cases.
4.6. Nuclear Magnetic Resonance
1H-NMR was done on a Varian Gemini 300 MHz Spectrometer with a narrow bore magnet and 5 mm probe at room temperature. All samples examined by 1H-NMR had 32 sampling repetitions and a concentration of 50 g/L in deuterated methylene chloride was used for the analysis.
5.
Results
and
Discussions
5.1. Characterization of γCD stars
The γ-CD stars were synthesized by the ATRP method as utilized by Brad Busche, which was shown to give polystyrene arms with low polydispersity49 (Mw/Mn=1.1). The number of
26
the ratio of the normalized peak intensity corresponding to the protons from the phenyl group of styrene (5Hs ~7-7.5ppm) to the protons from methyl group attached to the γ-CD via the
initiator (6Hs from two methyl groups ~0.7-1ppm). In this case, the number of protons has to be factored into the equation. The former relates to the number of styrene monomers attached to the γ-CD in the form of star arms through ATRP and the latter to the number of available initiator sites for the polymerization process. So the degree of polymerization for the polystyrene star arms is calculated to be 4.24 using the values given in Figure 10 ([0.46/5H,styrene]/[0.13/6H, γ-CD]).
27
5.2. UV Exposure of DIT for photoinitiation
The exposure of the monomers in solvent to UV light is a means to test the feasibility of the photo-initiation process in solvent. This process was done primarily on pure monomer either in the form of a film for solid DIT64, 65, 67, 68 or in the form a liquid for the DBT. The process was previously attempted without the presence of any sort of solvent, so here we attempted to study the same process with the monomer dissolved in chloroform. The analysis of the UV exposed samples is done by comparison of the fluorescence images and also using photoluminescence spectroscopy. In both cases, we look for shifts in the fluorescence pattern which is indicative of formation of linkages between the thiophene rings resulting in the formation of a conjugated thiophene oligomer.
Fluorescence is a property observed in polythiophenes and other conducting polymers. It is found to have a causal link with the increase in the conjugation length in these polymers64, 68, 69. Natarajan et al.64-66 observed a shift in the fluorescence emission in DIT after it was exposed to UV light. Observing the samples under fluorescent light with wavelength in the near ultra-violet region is a simple, yet effective method to check this phenomenon. The sample is photographed under ultra-violet light using a TLC lamp with a wavelength in the near visible region.
28
shift to the higher end of the visible spectrum. As observed by Kim Seong et al67, this difference between the two samples manifests itself as an increased degree of conjugation resulting from formation of more thiophene linkages in the sample exposed for 5 minutes.
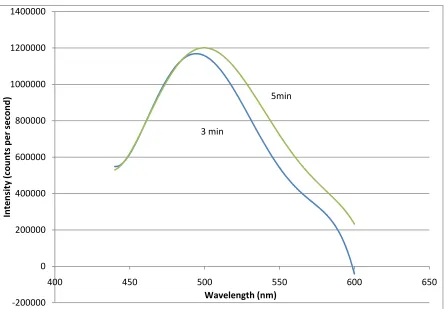
Photoluminescence spectroscopy is a more quantitative approach to measuring the shift in the fluorescence pattern with UV exposure for photoinitiation. In Figure 12, we observe shifts in the fluorescence pattern to the right as we go from DIT100 exposed for 3 min to 5 min, which is consistent with increased conjugation length of the oligomers67. These findings are in line with the observations shown above for the fluorescence images of the same samples.
29
Figure 12 - PL for DIT in chloroform exposed to UV for 3 and 5 min.
5.3. Inclusion Compounds between DIT and α and γCD
The inclusion properties of DIT and oligothiophene with both α- and γ- CD need to be studied, since we are using cyclodextrin in the modified form containing polystyrene arms. Additionally, it was shown that formation of the inclusion compound between thiophene monomer and α-CD resulted in solubility of the rotaxane in solvents for CD like water and
DMSO13, 70. The inclusion compounds both before and after UV exposure were studied
using X-Ray Diffraction, and Photoluminescence Spectroscopy.
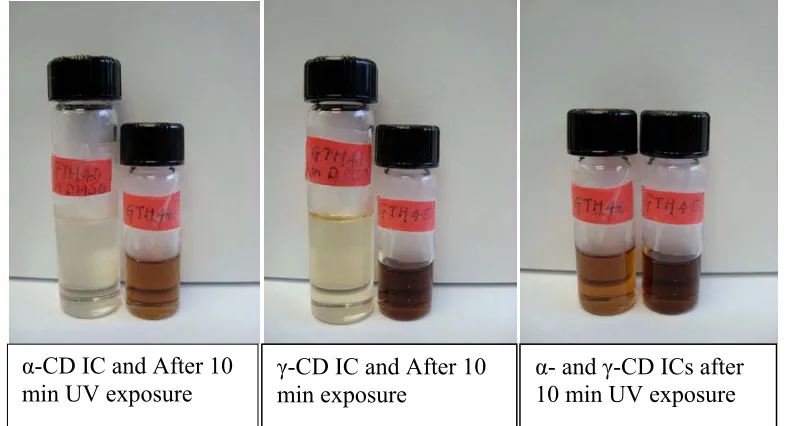
Color changes on UV exposure, from initially colorless to yellow to increasingly brown samples, are presented in Figure 13 for DIT-CD-ICs. This change in color with the sample
‐200000 0 200000 400000 600000 800000 1000000 1200000 1400000
400 450 500 550 600 650
Intensity (counts per second)
Wavelength (nm) 5min
30
exposure is consistent with the increase in the exposure time to which the DIT samples were subjected to UV light. This provides a preliminary indication of scission of the carbon-halogen (bromine or iodine) bond in the monomers. As shown by Lin, Sugimoto and other groups61, 62, the product mass obtained after polymerization is evidently brownish in appearance.
Figure 13 - Inclusion compounds of DIT with α- and γ-CD before and after UV exposure.
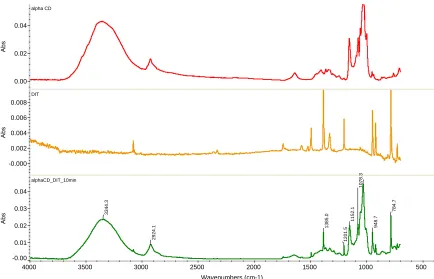
In Figure 14 below we contrast the FTIR spectra for α-CD, DIT and the inclusion compound between DIT and α-CD exposed to UV light for 10 minutes. We observe peaks from both the α-CD and DIT in the FTIR spectrum, showing the presence of both components in the mixture.
α- and γ-CD ICs after 10 min UV exposure γ-CD IC and After 10
min exposure α-CD IC and After 10
31
Figure 14 - FTIR spectra of α-CD, DIT, and α-CD-DIT IC after 10 min UV exposure.
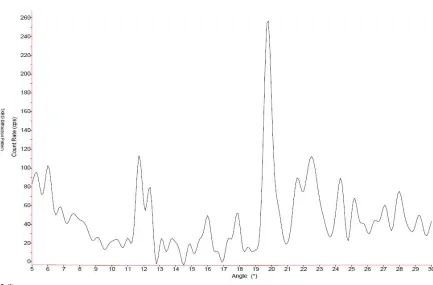
In order to verify the inclusion of the monomer and resultant oligomeric species, we blend the monomers with α- and γ-CD. The x-ray patterns taken before and after the inclusion of the monomer revealed a columnar structure in the case of α-CD, as evident through the prominent peak at 2θ=20°, which is the standard peak for channel structure in α-CD, shown in Figures 15 & 1671. The sample is then exposed to UV-light for photo-initiation and the x-ray patterns are taken again for the sample. Here as well, the same pattern revealed a columnar structure for α-CD after UV exposure. The presence of a columnar structure is a clear sign of inclusion of the DIT monomer in the CD cavity. The observance of such a structure with the α-CD-ICs after photo-initiation indicates that the DIT remains in the CD cavity after formation of oligomeric species in the cavity. Fluorescent imaging confirms this
32
oligomerization, as increased fluorescence relates to higher conjugation lengths for the oligomers. A notable property enhancement observed in this case is the solubility of the α -CD-ICs in DMSO, which under normal conditions cannot dissolve either the oligomers or the DIT monomer.
We also attempted to study the inclusion behavior of DIT with γ-CD, but observed a lack of channel formation for the potential IC both before and after the photo-initiation process. Consequently, we could either have a cage structure71 attained by the γ-CD on inclusion of the DIT guest, which precipitated out of the solvent after we attempt to form their inclusion compound.
2θ (°)
33 2θ (°)
Figure 16 - X-ray pattern of α-CD-DIT IC exposed to UV for 5 min.
FTIR spectra for samples of γ-CD and DIT both before and after UV exposure are represented in Figures 17 and 18, respectively. Comparing their expanded spectra shown in Figure 18, we observe a shift in the peak at 1374 cm-1 to 1384 cm-1 (Figure 19) as we go from
34
Figure 17 - FTIR spectrum of unexposed IC between DIT and γ-CD.
35
Figure 18 - FTIR spectrum of IC between DIT and γ-CD after 10 min UV exposure
36
Figure 19 - Expanded FTIR spectra for unexposed and UV exposed samples of γ-CD IC with DIT
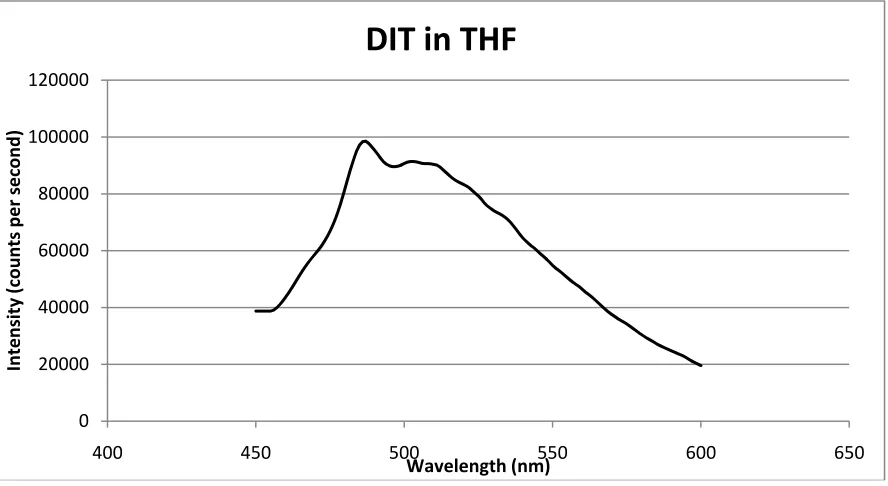
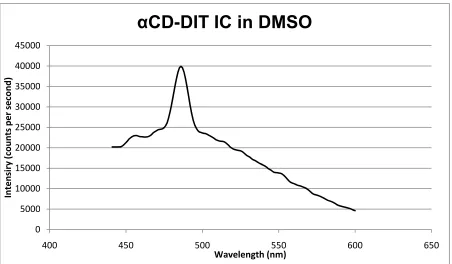
From PL spectroscopy we observe that the fluorescence pattern (Figures 20-22) observed in the case of DIT monomer and its oligomers is absent when we use α-CD for inclusion, whereas the pattern appears in part in the case of γ-CD. This supports the inclusion of the monomer and oligomeric forms of DIT into the α-CD cavity, thereby leading to the inhibition of the fluorescent emission spectra of the DIT species. Similar observations were observed by Gombojav et al, where a light blue luminescence was observed for samples of bithiophene ICs compared to the pure bithiophene72.
1335. 5 1374. 1 1414. 4 1335. 2 1384. 7 1413. 1 gammaCD+DIT unexposed
10 min UV exposure
37 Figure 20 - PL for DIT monomer in THF.
Figure 21 - PL for α-CD in THF.
0 20000 40000 60000 80000 100000 120000
400 450 500 550 600 650
Intensity (counts per second)
Wavelength (nm)
DIT
in
THF
0 5000 10000 15000 20000 25000 30000 35000 40000 45000
400 450 500 550 600 650
Intensiry (counts per second)
38 Figure 22 - PL of IC of DIT with α-CD.
By the combination of FTIR Spectroscopy, x-ray diffraction, photoluminescence
spectroscopy and optical images, we can study the inclusion as well as the oligomerization of DIT inside the α-CD channel.
5.4. Blending of Oligothiophene into PS using γCD stars
Similar to our observation with the CD-ICs, we saw a color change on UV exposure from initially colorless to yellow to brown shown in Figure 23 for DIT/PS with and without γ -CD-star showing the difference before and after the UV exposure indicative of scission of the carbon-halogen (bromine or iodine) bond in the monomers, as the other components including γ-CD stars, solvent and polystyrene were not affected by UV light used in the photo-initiation process. As shown by Lin, Sugimoto and other groups61, 62, the product mass
0 5000 10000 15000 20000 25000 30000 35000 40000 45000
400 450 500 550 600 650
Intensiry (counts per second)
39
40
Figure 23 - Samples of DIT/PS with and without CD-star after UV exposure.
The formation of oligomers in the DIT/PS blend is further confirmed using fluorescence imaging, UV-Vis spectroscopy and FTIR, using similar work done previously on polymerization of thiophene61, 64, 73, 74.
41
Natarajan et al64‐66, where increase in fluorescence was shown to be indicative of formation of
linkages between thiophene rings of the monomer after scission of the carbon-halogen bond in the monomer.
Figure 24 - Effect of heating and time (one week) on UV exposed samples of DIT+PS.
42
Figure 25 - Fluorescence contrast between 1:1 DIT/PS(left) and UV-exposed sample(right).
Figure 26 - Fluorescence contrast between DBT30 samples exposed for 30min(left) and 10min(right).
43
shoulder on the UV-Vis pattern at a wavelength ranging from 290-300 nm to the right of the main peak at about 285 nm, as can be seen in Figure 27. Similar patterns were also observed by Nishio et al74 for samples of DBT films initiated using a laser beam, and also in case of
oligothiophene prepared by other techniques.
This peak was not observed in any of the other samples. This subsidiary peak indicates that the sample has undergone better photo-initiation compared to the other samples. A key feature here is that these samples were exposed to the UV light in an aluminum weighing pan as opposed to a glass vial which was the case for all the other samples.
Additionally we did not use a UV filter to remove the higher energy UV light, which was used for the DIT monomer, as it was more sensitive to bond scission. For other samples of DBT+PS, we do not observe the shoulder peak. One of the possible reasons to attribute this to is the reduced intensity due to the direct polymerization in a glass vial and thus the carbon – halogen bond scission is highly limited.
44
Figure 27 - UV-Vis absorption spectra for mixture of PS+DBT, with and without γ-CD stars.
The shifts observed in the C=C asymmetric vibrations (~1360-1380 cm-1) using FTIR spectroscopy on the UV exposed samples, indicate the formation of linkages between the thiophene rings by photo-initiation of the DIT and DBT in solvent (THF, cyclohexanone). The FTIR Spectra of DBT and γ-CD star are presented in Figures 30-33. Using these spectra, we can confirm the presence of γ-CD stars and DBT in the FTIR spectra for DBT_CDS30 shown in Figures 31 and 33 (expanded to focus on the C=C vibrations). Similarly for DBT30 (without CD-star) in Figure 33 we have zoomed in on the 1300-1500 cm-1 region in Figure 31. We primarily look for shifts in the C=C symmetric and asymmetric vibrations. We can observe these shifts in Figures 31 and 33 for samples of DBT_CDS30 and DBT30 respectively. ‐0.2 0 0.2 0.4 0.6 0.8 1 1.2
240 260 280 300 320 340 360 380 400
Absorbance
(arb.
units)
Wavelength (nm)
DBT + PS
45 Figure 28 - FTIR spectrum of DBT.
Figure 29 - FTIR spectrum of γ-CD star polymer.
2,5-Dibromothiophene, 95% 0.1 0.2 0.3 0.4 0.5 0.6 0.7 0.8 0.9 1.0 Absorbance 500 1000 1500 2000 2500 3000 3500 4000 Wavenumbers (cm-1) 752.7 1450.3 1643.7 3384. 2
*CD-Star Thu Aug 27 11:01:51 2009 (GMT-04:00)
46
Figure 30 - FTIR spectrum of PS+DIT+CDstar after 30 min UV exposure.
Figure 31 - Comparison of DBT_CDS30 samples after 10 and 30 min UV exposure.
755. 5 1192. 3 1449. 8 1491. 5 1602. 2 1706. 2 2927. 6 3026. 3 3059. 7 GTH14_2 0.000 0.002 0.004 0.006 0.008 0.010 0.012 0.014 0.016 0.018 0.020 0.022 0.024 Absor b ance 500 1000 1500 2000 2500 3000 3500 4000 Wavenumbers (cm-1) 1368. 8 1491. 5 1365. 6 1411. 3 1491. 7
DBT_CDS30 30 min
DBT_CDS30 10 min
47
Figure 32 - FTIR spectrum of DBT30 after 30 min UV exposure.
Figure 33 - Comparison of DBT30 samples after 10 and 30 min UV Exposure.
757. 6 1027. 6 1449. 8 1492. 2 1600. 9 1708. 1 2924. 7 3025. 8 3059. 7 GTH16_1 0.001 0.002 0.003 0.004 0.005 0.006 0.007 0.008 0.009 0.010 0.011 0.012 0.013 Absorbance 500 1000 1500 2000 2500 3000 3500 4000 Wavenumbers (cm-1) 1371. 3 1492. 2 1328. 4 1362. 4 1450. 0 1491. 6
DBT30 30 min
DBT30 10 min
48
49
Figure 34 - DSC thermograms of PS+DBT+CDstar exposed to UV for 10 and 30 min.
50
6.
Conclusions
51
3.
NON
STOICHIOMETRIC
INCLUSION
COMPOUNDS
OF
PMMA,
PVAc
AND
THEIR
BLENDS
WITH
γ
CYCLODEXTRIN
1.
Materials
Poly (methyl methacrylate) (PMMA, MW = 350,000), poly (vinyl acetate) (PVAc, MW = 167,000 were purchased from Sigma Aldrich. α- and γ- CD (CD) used for polymer modification were obtained courtesy of Wacker Pharmaceuticals. ACS grade solvents 1,4-dioxane and dimethyl sulfoxide were all purchased from Sigma Aldrich Chemical Company. All chemicals were used as given, without any further purification.
2.
Experimental
Methods
2.1. Preparation of NonStoichiometric Inclusion Compound
52
solution of γ-CD was added drop-wise to the polymer solution with continuous stirring. The solution was allowed to stir at this temperature (60° C) for about 3 hours and then allowed to cool down to room temperature before stirring for an additional 3 days. After this period, the precipitate obtained was filtered through vacuum and dried in a vacuum oven. In addition to the polymer blend, inclusion compounds were made with each of the two polymers individually in the same ratios as that for the blend. The amount (weight in grams) of polymer, γ-CD and solvent used in each case is listed in Table 3. The procedure used by Uyar et al 34 for formation of inclusion compound with γ-CD was followed for all the samples in Table 3.
Table 3 - Samples of PMMA/PVAc inclusion compounds
Sample Name PMMA, g PVAc, g γ-CD, g
2:1 PVAc - 0.369 0.928
3:1 PVAc - 0.369 0.615
6:1 PVAc - 1.107 0.928
2:1 PMMA 0.429 - 0.928
3:1 PMMA 0.429 - 0.615
3:1 PMMA/PVAc(1:1) 0.429 0.369 1.23
53
3.
Characterization
Techniques
3.1. Fourier Transform Infra Red Spectroscopy
Fourier transform infrared spectroscopy (FTIR) was performed on a Nicolet 510P FTIR spectrophotometer in transmittance mode. The FTIR chamber was purged with dry air to eliminate water vapor. The data collection was done in ATR mode, and collected using a Germanium tip that is directly on top on the sample that was ground to a fine powder, instead of using potassium bromide pellets formed with the samples. The spectra were observed between 4000 – 400 cm-1, with 64 scans having resolution of 4 cm-1.
3.2. Differential Scanning Calorimetry
Glass transition temperature for poly methyl methacrlate, poly vinyl acetate and its blends were ascertained using a TA Instruments Q1000 differential scanning calorimeter with liquid nitrogen cooling capacity. Helium purge rate of 25 ml/min was used in the calorimeter, and heating and cooling rate of 20° C/min was used. About 10-20 mg of the sample was weighed and sealed in an aluminum sample pan. Analysis of data was done with TA universal analysis software and the second heating cycle was used in all cases.
3.3. Nuclear Magnetic Resonance
54
4.
Results
and
Discussion
4.1. NonStoichiometric Inclusion Compounds with PVAc or PMMA
Solid-state FTIR (not presented here) and solution 1H-NMR observations indicated the presence of both guest PVAc/PMMA and host γ-CD in the non-stoichiometric (n-s)-ICs. In addition their 1H-NMR observed stoichiometries were found to approximately those used in their formation (See Table 3).
55 Figure 36 - DSC thermogram of as-recd PVAc.
For (n-s)-PMMA-γ-CD-ICs, from Figures 40-41, we again observe a higher glass transition temperature for the (n-s) IC in comparison to pure PMMA. This can be attributed to the increased constraint placed on the unincluded ‘dangling” chain portions by the ordering of the included polymer chain portions that are forced to arrange themselves within the γ-CD cavities75. A similar trend was observed by Uyar et al after coalescence of PVAc and PMMA
from their full-coverage stoichiometric inclusion compounds with γ-CD34, where it was
56 Figure 37 - DSC thermogram of 6:1 (n-s) PVAc IC.
57 Figure 39 - DSC thermogram of 2:1 (n-s) PVAc IC.
58 Figure 41 - DSC thermogram of 2:1 PMMA IC.
Due to the formation of a channel structure in these inclusion compounds the CD’s arrange themselves in a tight structure through which the polymer chains are included. As a result, when the polymer comes out of the CD cavity, the adjacent polymer chains are tightly packed similar to that observed with a high density polymer brush76, 77. This increased density of the “dangling” polymer chains limitstheir mobility, delaying their transitions from a glassy to a more visco-elastic mobile phase, and causes increased glass transition temperatures.
59
placed on the dangling portion of the polymer by the CD channel structure can be altered by controlling the amount of CD used for the formation of the (n-s) IC. Thus glass transition temperature of a polymer could be potentially tailored to suit our end-requirement by simple processing with CD, without having to use a higher or lower molecular weight polymer for the same purpose.
4.2. NonStoichiometric Inclusion Compounds with PVAc/PMMA Blends
We have also studied the non-stoichiometric γ-CD-ICs formed with blends of the above two polymers (namely PMMA & PVAc), and prepared a (n-s) IC with a 3:1 ratio of the polymer pair (1:1 PMMA:PVAc) to γ-CD. We used equimolar amounts of PMMA and PVAc in the blend under the assumption of equal rate of inclusion of these polymers in the γ-CD cavity. In Figure 42 we observe the glass transition temperatures of PVAc and PMMA at 48 and 143o C, respectively. This is similar to the Tgs obtained (n-s)-ICs for pure PVAc and PMMA in the previous section. We also observe an intermediate Tg ~20° C below that of as-received PMMA
at about 105o C. This additional Tg, likely belonging to PMMA chains in PMMA-rich domains, can be explained by the preferential inclusion of PMMA. Thus, we have the presence of three domains in the blend architecture: PVAc domain, PMMA domain and an intermediate mixed domain having excess PMMA.
60
amounts of γ-CD also need to be adjusted in order to maintain the 3:1 ratio of the polymer to γ-CD in the (n-s) IC. We can see that unlike the Tg’s of the neat (n-s) ICs, which simply shifted to higher temperatures, in the case of the (n-s) PMMA/PVAc-γ-CD-IC they move closer to each other, indicating a certain degree of mixing between the dangling PMMA and PVAc chain portions. In addition to this, we observe a third glass transition temperature at about 140o C belonging the constrained PMMA phase. By contrast Uyar et al34 discovered
that for intimate blends prepared by coalescence from their fully covered stoichiometric ICs, second heating scans show that the polymers exhibit a single glass transition temperature, consistent with complete intimate mixing78.
61
Although the mixing was not complete, the difference in the Tg observed in relation to both the as-received and coalesced polymers is an indication of presence of PMMA in PVAc rich domains and vice versa. Thus, we get hardening of the PVAc component by the presence of
PMMA, and softening of the PMMA by PVAc resulting in decrease of its glass transition temperature, compared to as-received PMMA.
Figure 43 - DSC thermogram of 3:1 PMMA/PVAc(1:2) IC.
62
constraints placed on the polymer chains in the blend. This in turn, depends on the amount of CD used for the formation of the inclusion compound.
4.3. NMR Analysis of the Nonstoichiometric Inclusion Compounds
63
Figure 44 - NMR Spectrum of 3:1 ns-inclusion compound of γ-cyclodextrin with blend of PMMA and PVAc
5.
Conclusions
64
65
4.
CONCLUSIONS
AND
FUTURE
WORK
1.
Blending
of
Polythiophene
with
Polystyrene
using
Cyclodextrins
The inclusion behavior of DIT monomer was studied with both α- and γ-CDs using a combination of x-ray diffraction, fluorescent imaging and photoluminescence spectroscopy. Channel formation was evident from the diffraction pattern obtained for the IC of α-CD and DIT. However, for the mixture of γ-CD and DIT, we did not see any discernable pattern as observable using XRD. Subsequently, we studied the behavior of both the pure monomers and their ICs with α- and γ-CD after photo-initiation by ultra-violet light in suitable solvents that were previously shown to result in oligomerization of DIT and DBT. From the fluorescence results obtained from these oligomerized samples using near visible UV light, we observed shifts in the fluorescence pattern from the ultra-violet to visible region, consistent with increased conjugation of the monomer. This confirms the formation of oligomers of thiophene on exposure to a concentrated ultra-violet light source obtained by the scission of the carbon-halogen bonds in DIT and subsequent linkage of the free radicals of thiophene. The bond scission was visually manifested in the form of a dark brown hue observed in these samples with increased exposure time from the colorless solution seen in case of the monomer.
66
difference in the length of the thiophene oligomer obtained with or without the γ-CD stars. Finally we studied the thermal transitions in the DIT samples using a differential scanning calorimeter that reveal shifts in the glass transition temperature for these samples, which was found to be consistent with the period of time to which the samples were exposed to UV light for the photo-initiation process, and thereby the conjugation length.
The formation of inclusion compounds of DIT and its oligomers with α- and γ-CD allow us to utilize these ICs in traditional chemical polymerization techniques for thiophene discussed in chapter 1. This could potentially provide us with a conducting molecular wire of polythiophene inside an insulating layer of cyclodextrin. The solubility of the oligothiophene ICs in DMSO could mean the possible solubility of the polythiophene ICs in the same solvent. Using cyclodextrins, we can easily modify polymer behavior to suit our end-requirement by inducing changes in the polymer microstructure. This would allow us to further enhance applications like batteries, fuel cells, anti-static coating, polymeric diodes and also bio-implants.
2.
Non
Stoichiometric
Inclusion
compounds
with
PMMA/PVAc
with
γ
Cyclodextrin
67
using DSC. In this case, we observed for the equimolar blends (1:1 PMMA:PVAc) three glass transition temperatures, suggesting partial mixing and formation of a multi-phase blend. But the presence of two glass transition temperatures belonging to the PMMA rich phases indicated a preference in the inclusion of PMMA. So, we doubled the amount of PVAc in this blend, and again studied the DSC behavior in which case the glass transition temperatures of both components are again observed, and appeared to have shifted closer to each other in comparison to both their neat bulk and (n-s)-IC samples.
68
REFERENCES
1. Larsen, K. L. Journal of Inclusion Phenomena and Macrocyclic Chemistry 2002, 1-13.
2. Szejtli, J. Chem. Rev. 1998, 5, 1743.
3. Villier, M. A. Comptes. Rendus. Acad. Sci. 1891, 536.
4. Schardinger, F. Zentr. Bacteriol. Parasitenk. 1911, 188.
5. Pringsheim, H. In Chemistry of the Saccharides. McGraw-Hill: New York: 1932; .
6. Tchoreloff, P.; Baszkin, A.; Boisonnade, M. -.; Zhang, P.; Coleman, A. W.
Supramolecular Polymers Polymeric Betains Oligomers 1995, 169-171.
7. Del Valle, E. M. M. Process Biochemistry 2004, 9, 1033-1046.
8. Okumura, H.; Kawaguchi, Y.; Harada, A. Macromolecules 2001, 6338-6343.
9. Lo Nostro, P.; Lopes, J. R.; Cardelli, C. Langmuir 2001, 15, 4610-4615.
10. Ikeda, T.; Lee, W. K.; Ooya, T.; Yui, N. J Phys Chem B 2003, 14-19.
11. Rekharsky, M. V.; Inoue, Y. Chem. Rev. 1998, 5, 1875-1917.
69
13. Takashima, Y.; Sakamoto, K.; Oizumi, Y.; Yamaguchi, H.; Kamitori, S.; Harada, A.
Journal of Inclusion Phenomena and Macrocyclic Chemistry 2006, 1-2, 45-53.
14. Nepogodiev, S. A.; Stoddart, J. F. Chem. Rev. 1998, 5, 1959-1976.
15. Li, J. Inclusion Polymers 2009, 79-112.
16. Li, L.; Guo, X.; Fu, L.; Prud'homme, R. K.; Lincoln, S. F. Langmuir 2008, 15,
8290-8296.
17. Layre, A.; Wintgens, V.; Gosselet, N.; Dalmas, F.; Amiel, C. European Polymer Journal
2009, 11, 3016-3026.
18. Uekema, K. Chem. Pharm. Bull. 2004, 8, 900-915.
19. Hedges, A. R. Chem. Rev. 1998, 5, 2035-2044.
20. SAENGER, W. Angewandte Chemie.International edition in English 1980, 5, 344.
21. Buschmann, H.; Denter, U.; Knittel, D.; Schollmeyer, E. Journal of the Textile Institute
1998, 3, 554.
22. Savarino, P.; Viscardi, G.; Quagliotto, P.; Montoneri, E.; Barni, E. Dyes and Pigments
1999, 143-147.
70
24. Harada, A.; Hashidzume, A.; Takashima, Y. Supramolecular Polymers Polymeric
Betains Oligomers 2006, 1-43.
25. Harada, A.; Li, J.; Kamachi, M. Nature 1992, 6367, 325-327.
26. Rusa, C.; Wei, M.; Bullions, T. A.; Rusa, M.; Gomez, M. A.; Porbeni, F. E.; Wang, X.; Shin, I. D.; Balik, C. M.; White, J. L.; Tonelli, A. E. Crystal Growth & Design 2004, 6,
1431-1441.
27. Wenz, G.; Han, B. H.; Muller, A. Chem. Rev. 2006, 3, 782-817.
28. Wenz, G.; Keller, B. Angewandte Chemie-International Edition in English 1992, 2,
197-199.
29. Yhaya, F.; Gregory, A. M.; Stenzel, M. H. Aust. J. Chem. 2010, 2, 195-210.
30. Talwar, S.; Harding, J.; Khan, S. A. Xvth International Congress on Rheology - the
Society of Rheology 80th Annual Meeting, Pts 1 and 2 2008, 546-548.
31. Araki, J.; Ito, K. Soft Matter 2007, 12, 1456-1473.
32. Harada, A. Coordination Chemistry Reviews 1996, 115-133.
71
34. Uyar, T.; Rusa, C. C.; Wang, X. W.; Rusa, M.; Hacaloglu, J.; Tonelli, A. E. Journal of
Polymer Science Part B-Polymer Physics 2005, 18, 2578-2593.
35. Paik, Y.; Poliks, B.; Rusa, C. C.; Tonelli, A. E.; Schaefer, J. Journal of Polymer Science
Part B-Polymer Physics 2007, 11, 1271-1282.
36. Uyar, T. Nanostructuring Polymers with Cyclodextrins, North Carolina State University, Raleigh, NC, 2005.
37. Hunt, M. A.; Rusa, C. C.; Tonelli, A. E.; Balik, C. M. Carbohydr. Res. 2005, 9,
1631-1637.
38. Hunt, M. A.; Rusa, C. C.; Tonelli, A. E.; Balik, C. M. Carbohydr. Res. 2004, 17,
2805-2810.
39. Harata, K. Chemical Reviews 1998, 5, 1803-1828.
40. Tonelli, A. E. Polymer 2008, 7, 1725-1736.
41. Karaky, K.; Reynaud, S.; Billon, L.; François, J.; Chreim, Y. Journal of Polymer Science
Part A-Polymer Chemistry 2005, 21, 5186-5194.
42. Yang, C.; Li, H.; Goh, S. H.; Li, J. Biomaterials 2007, 21, 3245-3254.